

Abstract
The formation of the vertebrate brain requires the generation, migration, differentiation and survival of neurons. Genetic mutations that perturb these critical cellular events can result in malformations of the telencephalon, providing a molecular window into brain development. Here we report the identification of an N-ethyl-N-nitrosourea-induced mouse mutant characterized by a fractured hippocampal pyramidal cell layer, attributable to defects in neuronal migration. We show that this is caused by a hypomorphic mutation in Vps15 that perturbs endosomal–lysosomal trafficking and autophagy, resulting in an upregulation of Nischarin, which inhibits Pak1 signaling. The complete ablation of Vps15 results in the accumulation of autophagic substrates, the induction of apoptosis and severe cortical atrophy. Finally, we report that mutations in VPS15 are associated with cortical atrophy and epilepsy in humans. These data highlight the importance of the Vps15-Vps34 complex and the Nischarin-Pak1 signaling hub in the development of the telencephalon.
The formation of the vertebrate brain is a complex process that requires the generation and migration of neurons, followed by their differentiation and survival1. In the case of the cortex and hippocampus, neurogenesis occurs in the proliferative ventricular zones where radial glia and intermediate progenitors undergo extensive neurogenic divisions2. The resultant postmitotic neurons then begin a cellular journey, undertaking a series of genetically programmed morphological transitions before propelling themselves along the radial glia scaffold forming a laminar structure3. This migration requires the generation of polarity, extension of a leading process, translocation of the nucleus and retraction of the trailing process. Having reached their final destination, neurons mature through a process of differentiation that involves axon extension and the formation of dendritic processes.
Insight into the molecular mechanisms that mediate these critical cellular processes have been informed by the study of spontaneous and N-ethyl-N-nitrosourea (ENU)-induced mouse mutants4. For instance, the reeler mouse revealed the importance of the extra-cellular signaling protein Reelin5, the scrambler mutant implicated the tyrosine phosphatase Dab16 and the Tubala mouse mutant has underlined the role of the microtubule cytoskeleton7. The study of engineered mouse mutants has also been pivotal, highlighting the role of nonreceptor protein kinases such as JNK and Cdk58. Cdk5 sits at the intersection of a signaling pathway, phosphorylating molecules such as Dab1, Dcx, Map1b and Pak19. Pak1, which is an effector of Rac1 and Cdc42, has been implicated in the regulation of actin and microtubule dynamics. While these functional studies have advanced our understanding of the molecular mechanisms that mediate neuronal migration, it is nonetheless apparent that the picture is far from complete. In this study we established a genetic screen in mice to identify new genes required for telencephalic development, with a focus on neuronal migration. We report that mutations in Vps15 impair the migration and survival of neurons in mice depending on the protein dosage and that mutations in the human homolog are associated with neurodevelopmental disease.
Results
ENU screen, genetic mapping and rescue
We performed a recessive ENU screen, undertaking a quantitative and qualitative analysis of structural brain phenotypes in the adult mouse brain (Fig. 1a). This screen employed Nissl staining and assessed such attributes as ventricular volume, cortical thickness, the thickness of hippocampal layers, corpus callosal volume and the presence of ectopic cells (Supplementary Fig. 1a). We screened a total of 38 pedigrees, each with at least 12 animals per line. Based on the observed rate of ENU-induced mutations, this represents approximately 2.7% coverage of the coding genes in the mouse genome10. We identified six pedigrees with a variety of neuroanatomical abnormalities, one of which presented with striking pyramidal cell ectopia in the hippocampus, reminiscent of Tubala, Dcx and Lis1 mutant mice (Fig. 1d,e,g,h)7,11,12. To identify the causative mutation in this recessive line, nicknamed Marble, we adopted a traditional positional cloning strategy employing microsatellite markers. This approach narrowed the genomic interval to a 28.6-Mb region on distal chromosome 9 that contains 439 genes (Supplementary Fig. 1b). Whole-exome sequencing failed to identify any coding variants within this region, but revealed the presence of a T-to-A substitution in the intron upstream of exon 4 of Vps15 (GRCm38p4, chr9: 105,650,312; Fig. 1b). This mutation was not found in either of the strains used for mapping (C3H/HeH and C57/BL6J mice), nor is it reported to be a naturally occurring polymorphism in wild-type or inbred mice. The T-to-A mutation creates a novel splice acceptor site, which is predicted to introduce a premature stop codon resulting in a truncated protein of 289 amino acids (Fig. 1c). We extracted mRNA from the developing brain (at embryonic day (E) 14.5) of homozygous mutants (Mbe/Mbe) and confirmed the introduction of this stop codon into the transcript (Supplementary Fig. 1c). To formally test whether the mutation in Vps15 is responsible for the fractured pyramidal cell layer in the Marble line, we performed a rescue experiment by creating a bacterial artificial chromosome (BAC) transgenic mouse that has additional copies of Vps15. We selected a BAC (RP24-281C16) that contains the complete sequence of Vps15 and the partial sequence of the neighboring gene Col6a6. Following pronuclear injections and confirmation of germline transmission, we analyzed our BAC transgenic animals, confirming that the presence of additional copies of Vps15 does not result in a neurological phenotype (Supplementary Fig. 1d-m). We then crossed our BAC transgenic mice into the Marble line. We found that homozygous Mbe/Mbe mutants with the BAC transgene were indistinguishable from wild-type controls (Fig. 1d–i). Collectively, these data show that Vps15 is necessary for neuronal migration in the murine hippocampus.
Fig. 1. Vps15 is mutated in the Marble mouse.
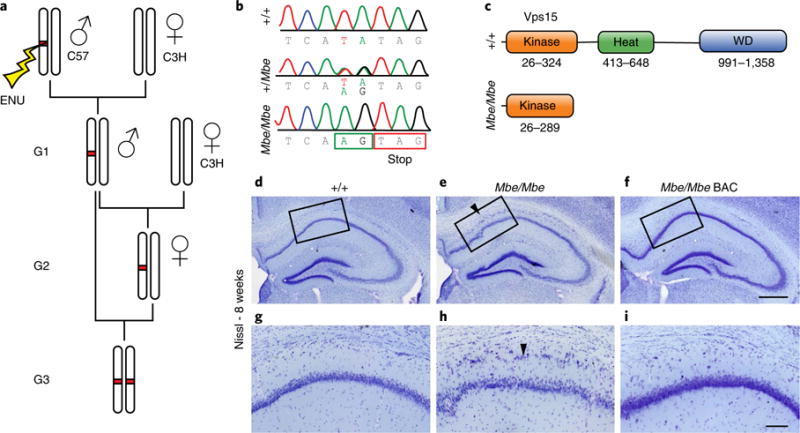
a, The Marble mouse was identified in a recessive ENU mutagenesis screen. ENU was injected into male C57/BL6 mice that were then crossed to C3H/HeH females. Male offspring (G1) were backcrossed to C3H/HeH females, and their daughters (G2) crossed to their G1 fathers. The resultant G3 offspring were subject to histological analysis (see Supplementary Fig. 1). b, The Marble mouse has a T-to-A substitution upstream of exon 4 of Vps15 (GRCm38p4, chr9: 105,650,312). This mutation, coupled with a single-nucleotide polymorphism on the C57/BL6 background, results in a premature splice acceptor site, introducing a premature stop codon in Mbe/Mbe mutants. c, Structure of the Vps15 protein, which is 1,358 amino acids in length and has a putative kinase domain (26-342), four heat domains (413-648), and seven WD domains (991-1,358). d–f, Representative hippocampal Nissl stains of adult wild-type animals (d, control), Marble mutants (e, Mbe/Mbe), and mutants with additional copies of Vps15 delivered by genetic methods (f, Mbe/Mbe BAC). Scale bar, 500 μm. g–i, Magnified boxed regions of the images shown in d–f, respectively. The fractured pyramidal cell layer in the hippocampus that extends from CA1 to CA3 (arrowhead) in mutant animals is completely rescued by Vps15 overexpression. This experiment was performed three times with similar results. Scale bar, 100 μm. Experiments shown in d–i were repeated in 3 animals per genotype.
The Mbe/Mbe mutation impairs the function of the Vps15–Vps34 complex
Vps15 is known to form a complex with Vps34 and Beclin1, catalyzing the formation of the phospholipid PI(3)P, which is important for the maturation of endosomes as well as the formation of autophagosomes13,14. Its essential role in vesicular processes is reflected by its ubiquitous expression pattern, which we confirmed by quantitative PCR (qPCR) (Supplementary Fig. 2a–c). To assess whether the Marble mutation perturbs the Vps15–Vps34–Beclin1 complex we extracted protein lysates from the developing mouse forebrain (E14.5) and mouse embryonic fibroblasts (MEFs) and performed western blot analysis. This revealed a large reduction in the total protein levels of full-length Vps15 and its binding partners Vps34 and Beclin1 in Mbe/Mbe mutants in the developing forebrain and in MEFs (Fig. 2a,b and Supplementary Fig. 2d,e). We were not able to detect a truncated form of the Vps15 protein in Mbe/Mbe MEF lysates using an N-terminal antibody (Supplementary Fig. 2g,h). An assessment of Vps15 transcript levels in the developing forebrain (E14.5) of Mbe/Mbe mutants revealed a reduction in Vps15 mRNA consistent with nonsense mediated degradation; however, this reduction was not statistically significant (P = 0.2; Supplementary Fig. 2f and Supplementary Tables 1 and 2). Transcript levels of Vps34 and Beclin1 were similar in Mbe/Mbe mutants and wild-type controls, indicating that the downregulation of these proteins was a consequence of post-transcriptional dysfunction. To assess the effect of the Mbe/Mbe mutation on endosomal trafficking, we performed an epidermal growth factor receptor (EGFR) assay in MEFs15. Treatment of MEFs with epidermal growth factor (EGF) results in a near complete degradation of the EGF–EGFR complex as internalized endosomes fuse with lysosomes. We pulsed MEFs with EGF and monitored the levels of EGFR over 4 h with normalization to Gapdh. We observed a rapid decrease in the levels of EGFR in wild-type cells that was absent in Mbe/Mbe mutants, most notably at 60 min (Fig. 2c,d). Consistent with this result, we observed an increased half-life of the PDGF receptor in Mbe/Mbe mutant MEFs following stimulation with the ligand PDGF-BB16 (Supplementary Fig. 2i,j). An assessment of lysosomal function using LysoTracker revealed no difference between genotypes (Supplementary Fig. 2k,l). Together, these data indicate that the mutation in Vps15 compromises endosome to lysosome trafficking but not lysosomal function.
Fig. 2. The Mbe/Mbe mutation compromises the function of the Vps15/Vps34 complex.
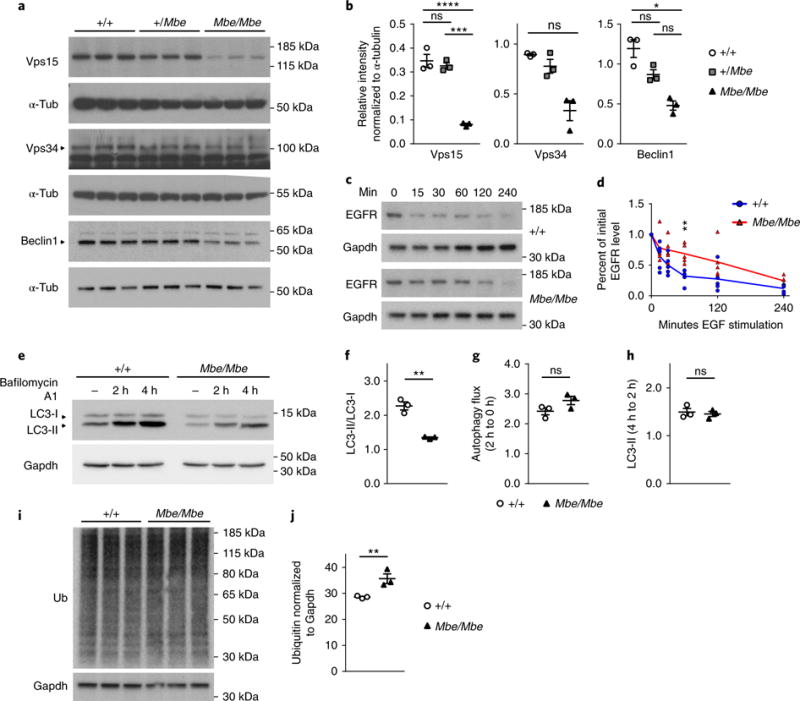
a, Western blot analysis of Vps15 and its interacting partners Vps34 and Beclin1 from E14.5 brain lysates reveals a dramatic reduction in protein levels in Mbe/Mbe mutants (n = 3 animals per genotype). b, Quantification of western blot results shows that the reduction of Vps15 and Beclin1 protein levels is significant (n = 3 animals per genotype; Vps15: one-way ANOVA with Tukey’s multiple-comparison test; control vs. Mbe/Mbe, P<0.0001; +/Mbe vs. Mbe/Mbe, P = 0.0002; Beclin1: Kruskal–Wallis test with Dunn’s multiple-comparison test; control vs. Mbe/Mbe, P = 0.034). Protein levels of Vps34 are greatly reduced, but this difference is not statistically significant (n = 3 animals per genotype; Kruskal–Wallis test with Dunn’s multiple-comparison test; control vs. Mbe/Mbe, P= 0.076). This experiment was performed twice with similar results. α-Tub, α-tubulin. c,d, EGF was employed to stimulate EGFR endocytosis and degradation in MEFs isolated from Mbe/Mbe mutants and littermate controls. Levels of EGFR were monitored over 4 h and normalized to Gapdh. Over time we observed a degradation of EGFR in wild-type control cells that was almost undetectable at 240 min (c). This contrasts with Mbe/Mbe mutants, in which higher levels of EGFR were present at all timepoints (d), indicative of a defect in endosome to lysosome trafficking (n = 5 animals per genotype; two-way repeated-measures ANOVA with Bonferroni multiple-comparison test, F1,8 = 7.694; overall effect of genotype: P = 0.024; at 60min: P = 0.008). e–h, Western blot analysis of LC3-I and LC3-II on protein lysates isolated from MEFs normalized to Gapdh. Quantification (f–h) shows a significant reduction in the ratio of LC3-II/LC3-I before incubation with bafilomycin A1 (n = 3 animals per genotype; unpaired two-tailed t test, Bonferroni corrected; t4 = 7.879, P= 0.004) but no significant difference in autophagy flux (n = 3 animals per genotype; autophagy flux (0-2 h): unpaired two-tailed t test, Bonferroni corrected; t4 = 1.958, P = 0.365; LC3-II (2-4h): unpaired two-tailed t test; t4 = 0.4196, P > 0.5). These data indicate there is a smaller pool of autophagosomes in Mbe/Mbe mutant cells. i, Western blot analysis of ubiquitinated (ub) proteins on lysates isolated from MEFs. j, Quantification shows an upregulation of ubiquitinated proteins in Mbe/Mbe mutants (n = 3 animals per genotype; one-tailed unpaired t test; t4 = 3.762, P=0.01). *P<0.05; **P<0.01; ***P<0.001; ****P< 0.0001; ns, not significant. All immunoblots shown are cropped; for full-length blots see Supplementary Fig. 11. Error bars show mean ± s.e.m.
Next, we assessed the effect of the Mbe/Mbe mutation on autophagy, by undertaking LC3 western blot analysis of protein lysates from MEFs (Fig. 2e–h). Autophagosomes are associated with the lipidation of the cytosolic form of LC3 (LC3-I), forming LC3-II. Following the fusion of autophagosomes with lysosomes, LC3-II is degraded by lysosomal proteases17. Consistent with a reduction in the number of autophagosomes, we observed a decreased ratio of LC3-II to LC3-I in Mbe/Mbe mutants (Fig. 2e,f). We assessed autophagy flux by incubating Mbe/Mbe MEFs with bafilomycin A1, which inhibits the fusion of autophagosomes with lysosomes. Analysis of LC3-II levels at 2 and 4 h relative to Gapdh levels revealed no differences in the flux of autophagosomes in Mbe/Mbe MEFs. These data indicate that there is a reduction in the initial pool of autophagosomes in Mbe/Mbe animals. Previous studies have shown that defects in autophagy can result in the accumulation of ubiquitinated substrates18. To ascertain whether this occurs in Mbe/Mbe mutants, we performed western blot analysis of MEF protein lysates with a ubiquitin antibody. This revealed a mild, but significant, upregulation of ubiquitinated proteins in Mbe/Mbe MEFs (n = 3, P=0.01; Fig. 2i,j). These data show that the Mbe/Mbe mutation compromises the function of the Vps15–Vps34 complex, impairing endosomal-to-lysosomal trafficking, accompanied by a reduction in the pool of autophagosomes.
Hippocampal proteomics reveals that Nischarin-Pak1 signaling is perturbed in Mbe/Mbe animals
To gain further insight into the molecular mechanisms, we assessed the impact of the Vps15 mutation on the global proteome of the developing hippocampus in Mbe/Mbe mutants. We chose to analyze mice at postnatal day (P) 0, as pyramidal cell neurogenesis peaks at E14 to E16 and the subsequent migration takes 5–7 d. Extracted protein samples from P0 hippocampi from wild-type and mutant animals (n = 3 replicates per genotype) were digested with trypsin, labeled with tandem mass tags and subjected to mass spectrometry (Fig. 3a). We generated a total of 1.1 million spectra, enabling the identification of 51,506 unique peptides. We observed at least 49,000 peptides in each sample, which were then mapped to 7,566 Swiss-Prot accessions. We employed this dataset as a discovery tool, applying a modified t test that incorporates a Bayesian approach19. We set a threshold of P < 0.01, resulting in the identification of 91 proteins that were more abundant and 96 that were less abundant in the Mbe/Mbe hippocampus (Supplementary Table 3). Consistent with results from our western blot experiments, we observed that Beclin1, Vps15 and Vps34 were all less abundant (Fig. 3b). We employed the Ingenuity software platform (Qiagen) to identify those proteins associated with cell movement (n = 18 proteins). We then manually annotated each of these proteins, drawing on the published literature, and identified six dysregulated proteins known to be involved in neuronal migration (RhoA, Jam3, Nischarin, Slit2, Fgfr3 and Ephb3), one of which (Nischarin) also harbored a phosphoinositol binding domain (Fig. 3c). We confirmed that Nischarin is more abundant in the Mbe/Mbe hippocampus, cortex and E14.5 forebrain by western blot analysis (Fig. 3d,e). In contrast, the levels of Nischarin mRNA were similar when comparing Mbe/Mbe mutants and controls, indicative of post-translational dysregulation (Fig. 3f). Nischarin is broadly expressed at low levels in adult organs, but is enriched in the developing mouse brain (Supplementary Fig. 3a,b). It is a cytoplasmic protein with a PX domain that binds PI(3)P, and it is targeted to endosomes20. It is known to bind integrins and inhibit cellular migration through a Rac1-Pak1 signaling pathway21. We asked whether the upregulation of Nischarin in the Marble mouse perturbs Pak1 activation by performing western blot analysis for the phosphorylated active (T422) form of Pak1 on P0 hippocampal lysates. This experiment revealed a significant reduction in the amount of activated Pak1 in Mbe/Mbe mutants in comparison to controls (n = 3, P=0.01; Fig. 3g,h). Taken together, these data show that the Mbe/Mbe mutation alters protein homeostasis within the developing hippocampus, perturbing Nischarin-Pak1 signaling.
Fig. 3. Global quantitative proteomics reveals that Nischarin is upregulated in Mbe/Mbe mutants.
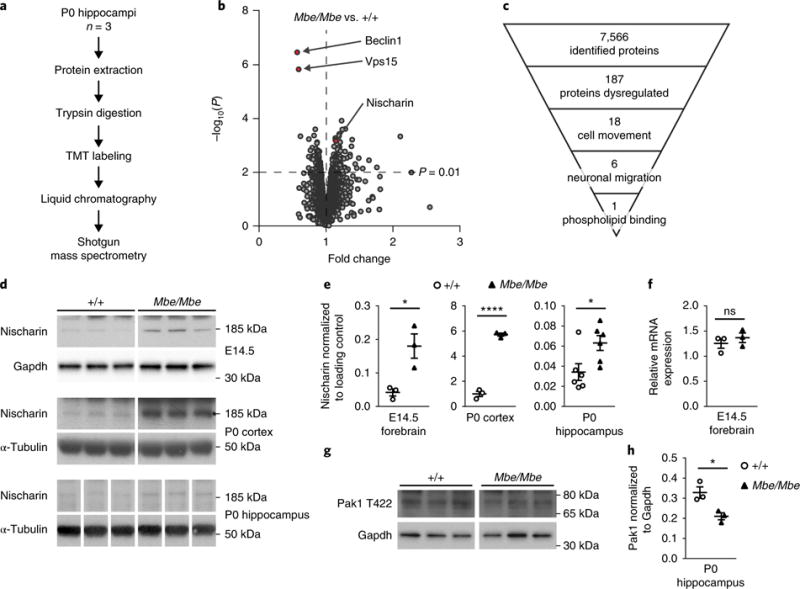
a, Schematic depicting the methodology employed for proteomic experiments. Hippocampi from Mbe/Mbe mutants and wild-type controls at P0 (n = 3 biological replicates per genotype, each consisting of pooled hippocampi from 2 animals) were lysed, and proteins extracted and subjected to tryptic digest before tandem mass tag (TMT) labeling. Following separation of protein fragments by liquid chromatography, samples were analyzed by mass spectrometry. b, Volcano plot showing peptides upregulated and downregulated in the Mbe/Mbe hippocampus with −log10(P) values shown on the y axis, following the application of a modified t test with Bayesian parameters. c, Pyramid showing how mass spectrometry data were analyzed. d,e, Western blot analysis and quantification confirm that Nischarin protein levels are increased in the Mbe/Mbe developing forebrain (E14.5; n = 3 animals per genotype; one-tailed unpaired t test; t4 = 3.667, P = 0.01), P0 cortex (n = 3 animals per genotype; one-tailed unpaired t test; t4 = 19.19, P < 0.0001) and P0 hippocampus (n = 6 animals per genotype; one-tailed unpaired t test; t10 = 2.584, P= 0.01). This experiment was performed twice with similar results. f, Quantification of mRNA expression of Nischarin in the E14.5 forebrain reveals no differences between genotypes (n = 3 animals per genotype; Mann-Whitney test, two tailed; P = 0.4). g, Western blot analysis of activated Pak1 (phosphorylated at T422) shows decreased Pak1 activation in the Mbe/Mbe P0 hippocampus. This experiment was performed twice with similar results. h, Quantification of Pak1 western blot reveals that the difference between genotypes is significant (n = 3 animals per genotype; one-tailed unpaired t test; t4 = 3.597, P = 0.01). *P < 0.05; ****P < 0.0001; ns, not significant. All immunoblots shown are cropped; see Supplementary Fig. 11 for full-length blots. Error bars show mean ± s.e.m.
Mbe/Mbe mutants have a severe defect in hippocampal neuronal migration and working memory
Next, we undertook a detailed examination of the neuroanatomical features of the Marble line, focusing on the hippocampus (Fig. 4a–i). Staining with the post-mitotic neuronal marker NeuN and the calcium binding protein calbindin showed that the ectopic cells displaced in the stratum oriens layer of the hippocampus are excitatory pyramidal neurons (Fig. 4d–i)22. These ectopic clusters of neurons were most prominent in the CA1 subfield (Fig. 4a–c). Notably, immunostaining in Mbe/Mbe mutants revealed an enrichment of Nischarin in ectopic pyramidal cells compared with those cells that were correctly positioned (Supplementary Fig. 3c–g). Staining with calretinin and parvalbumin showed that the distribution of interneurons within the oriens layer and pyramidal cell layer is not altered in Mbe/Mbe animals (Supplementary Fig. 4a–n). Golgi staining revealed no difference in spine density when comparing control (+/+) and Mbe/Mbe pyramidal neurons (Supplementary Fig. 4o,p). In contrast, a Sholl analysis highlighted a significant decrease in dendritic complexity in ectopic CA1 pyramidal cell neurons in Mbe/Mbe mutants that was not evident in correctly positioned neurons in Mbe/Mbe mutants or wild-type littermates (n = 3 animals per genotype, P < 0.0001; Supplementary Fig. 4q,r). Staining of the dentate gyrus with sera against GFAP (which labels glial-like progenitors), Tbr2 (which labels intermediate progenitors), Dcx (which labels newly born neurons) and Prox1 (which labels granule cells) revealed that the organization of the subgranular zone and granule cell layer is not affected in Mbe/Mbe mutants (n = 3; Supplementary Fig. 5a–x). To investigate the origin of the fractured pyramidal cell layer in Mbe/Mbe mutants, we performed birthdate labeling, injecting BrdU at E14.5, a peak time for hippocampal neurogenesis, and killed the mice and collected their brains at P11 (n = 3). Blind quantitation revealed a significantly higher percentage of BrdU+ cells in the stratum oriens in mutant animals (15.2% ± 1.2%) in comparison to littermate controls (10.4% ± 0.1%; n = 3, P=0.0002). This was accompanied by a concomitant decrease in BrdU+ cells in the pyramidal cell layer in Mbe/Mbe animals (n = 3; +/+: 59.6% ± 0.5%, Mbe/Mbe: 54.5% ± 1%, P < 0.0001; Fig. 4j,k). To assess whether ectopic neurons in the pyramidal cell layer are generated during a broader time window, we performed additional BrdU labeling at E12.5 and E16.5, quantifying the percentage of ectopic BrdU+NeuN+ cells (n = 3). This experiment showed that the neurons that form the ectopic layer are born at E12.5, E14.5 and E16.5 (Fig. 4l–w).
Fig. 4. Neuroanatomical characterization of the Mbe/Mbe hippocampus.
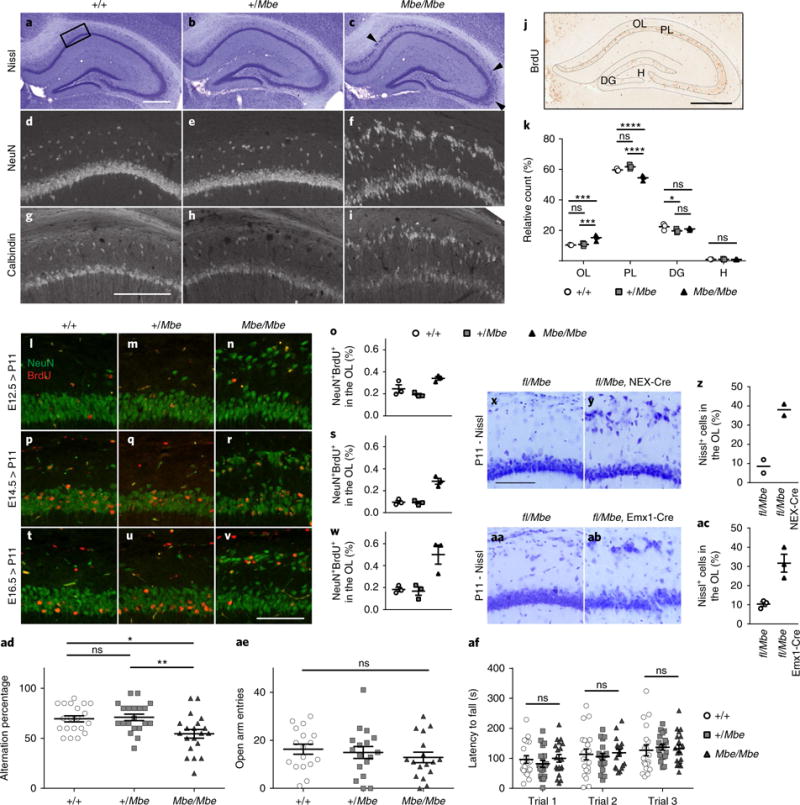
a–c, Representative Nissl stains of the hippocampus of wild-type controls (+/+), heterozygotes (+/Mbe) and Marble mutants (Mbe/Mbe) aged 8 weeks (n = 3 animals per genotype). Arrowheads highlight the fractured pyramidal cell layer visible in Mbe/Mbe mutants, which is most severe in the CA1 subfield but extends into CA2 and CA3. d–i, NeuN (d–f) and calbindin (g-i) staining of area boxed in a confirms that ectopic cells are pyramidal neurons. These experiments were performed twice with similar results. j, Diagram showing the regions of the hippocampus analyzed following BrdU injections at E14.5 and brain collection at P11. k, Graph showing the percentage of BrdU+ cells in the oriens layer (OL), pyramidal cell layer (PL), dentate gyrus (DG) and hilus (H). In Mbe/Mbe mutants we observe a significant increase in the percentage of BrdU positive cells in OL (n = 3 animals per genotype; two-way repeated-measures ANOVA with Tukey’s test for multiple comparison; +/+ vs. Mbe/Mbe, P = 0.0002; +/Mbe vs. Mbe/Mbe, P= 0.005) with a concomitant decrease in PL (+/+ vs. Mbe/Mbe, P < 0.0001; +/Mbe vs. Mbe/Mbe, P < 0.0001). l–w, Representative images of the pyramidal cell layer following BrdU injection at E12.5 (l–n), E14.5 (p–r) and E16.5 (t–v), stained with sera against NeuN (green) and BrdU (red). (o,s,w) Quantifications of the percentages of ectopic NeuN+BrdU+ neurons in OL relative to the total number of NeuN+BrdU+ neurons in CA1 in +/+, +/Mbe and Mbe/Mbe animals. Neurons destined for the OL in Mbe/Mbe mutants are born at E12.5, E14.5 and E16.5. x–ac, Generation of fl/Mbe compound heterozygotes in the absence of a Cre driver line (x,aa), or alternatively with a Nex-Cre (y) or Emx1-Cre (ab) driver. Representative images of the CA1 region of the hippocampus are shown. No lamination defect is apparent in the absence of Cre (x,aa), whereas ablation of Vps15 by Emx1-Cre or Nex-Cre recapitulates the Mbe/Mbe phenotype (y,ab). (z,ac) Quantitation of ectopic pyramidal cells in fl/Mbe Nex-Cre (38% ± 4%, n = 2 animals per genotype) and fl/Mbe Emx1-Cre mice (31% ± 8%, n = 3 animals per genotype). ad–af, Mbe/Mbe mutants exhibit a defect in working spatial memory (ad) when assessed using rewarded alternation (n = 20 animals per genotype; one-way ANOVA with Tukey’s multiple comparison; +/+ vs. Mbe/Mbe, P = 0.013; +/Mbe vs. Mbe/Mbe, P = 0.006) but normal anxiety phenotypes on the elevated plus maze (ae, open arm entries; n = 17 animals per genotype; one-way ANOVA with Tukey’s multiple comparison; +/+ vs. Mbe/Mbe, P = 0.54) and normal motor coordination on the rotarod (af, n = 19 animals per genotype; two-way repeated-measures ANOVA with Tukey’s multiple-comparison test; +/+ vs. Mbe/Mbe trial 1: P = 0.98; trial 2: P = 0.95; trial 3: P = 0.97). Scale bars: in a and j, 500 μm; in g, 200 μm; in v and x, 100 μm. *P<0.05; **P< 0.01; ***P< 0.001; ****P< 0.0001; ns, not significant. Error bars show mean ± s.e.m.
Next, we asked whether perturbation of Vps15 in neurons is sufficient to cause a fractured pyramidal cell layer in the hippocampus by exploiting a Vps15-conditional knockout mouse23. As adult homozygous knockout (loxP-flanked; hereafter fl) animals are not viable, we intercrossed the conditional-knockout line with Mbe/Mbe mutants, generating compound heterozygotes (fl/Mbe). In the absence of a Cre-recombinase, we observed normal lamination in the hippocampus (Fig. 4x,aa). We then performed genetic crosses, introducing either Emx1-Cre (which is expressed in both neurons and radial glia in the forebrain from E10.5)24 or Nex-Cre (which is only expressed in postmitotic neurons in the cortex and hippocampus from E11.5)25. Both the fl/Mbe Nex-Cre and fl/Mbe Emx1-Cre lines recapitulated the fractured pyramidal cell layer we observed in Mbe/Mbe mutants, with an increase in the number of ectopic pyramidal cells (Fig. 4y,ab). The numbers of ectopic cells in the oriens layer were similar in fl/Mbe Emx1-Cre (31% ± 4.5%, n = 3) and fl/Mbe Nex-Cre (38% ± 3%, n = 2) animals (Fig. 4z,ac). These data indicate that the fractured pyramidal cell layer we observed in the Mbe/Mbe hippocampus is attributable to Vps15 perturbation in neurons and not to glial dysfunction.
Given the defects in hippocampal lamination in the Mbe/Mbe mice we assessed their performance on a memory task that is hippocampal dependent. Employing rewarded alternation in the T-maze, we found that Mbe/Mbe mutants alternated just above chance (54% ± 4%), in contrast to heterozygotes (71% ± 3%) and +/+ (70% ± 3%) littermates (Fig. 4ad, n = 20, Mbe/Mbe vs. +/+: P = 0.01). An assessment of their anxiety-related behaviors employing the elevated-plus maze and open field revealed that Mbe/Mbe mutants are indistinguishable from wild-type controls (open arm entries, n = 17; Mbe/Mbe vs. +/+, P = 0.54; Fig. 4ae and Supplementary Fig. 5y,z). Similarly, they exhibit no defects in motor coordination when assessed with the rotarod (n = 19; Mbe/Mbe vs. +/+, P = 0.85; Fig. 4af). Taken together, these data show that the primary behavioral deficit in Mbe/Mbe mutants is working spatial memory, which is associated with a fractured pyramidal cell layer in the hippocampus.
Mbe/Mbe mutants have a mild defect in cortical neuronal migration
We investigated whether the laminar architecture of the cortex is also affected in Mbe/Mbe mutants by staining with sera against NeuN, Cux1 (a layer II/III and IV marker), Er81 (a layer V marker) and Foxp2 (a layer VI marker; n = 3; Fig. 5a–l). Using these antibodies, we were not able to detect any differences when comparing wild-type controls and Mbe/Mbe mutants, indicating that the structure of the cortex is intact in mutant animals. Next, we assessed neuronal migration in the cortex by birthdate-labeling experiments at E12.5, E14.5 and E16.5, after which mice were killed for analysis (blind quantitation) at P0. We divided the cortex into ten equal bins and counted the number of BrdU+ cells in each bin. We observed a mild migratory defect in Mbe/Mbe animals that was most noticeable following injection at E16.5. At this timepoint there was a significant accumulation of BrdU+ neurons in bins 9 and 10, with a concomitant decrease in bin 8 in Mbe/Mbe mutants (n = 3, +/+ vs. Mbe/Mbe; bin 8: P = 0.01; bin 9: P = 0.02; bin 10: P = 0.002). Moreover, there was a significant interaction between genotype and the distribution of BrdU+ cells across all bins (n = 3, P = 0.02; Fig. 5m–p and Supplementary Fig. 6a–h). Quantification of cortical thickness revealed no significant differences between Mbe/Mbe mutants and littermate controls at 8 weeks of age (n = 3; +/+ vs. Mbe/Mbe, P = 0.13) or 4 months (n = 3; +/+ vs. Mbe/Mbe, P = 0.93; Fig. 5q–w). Analysis of the laminar structure of the cerebellum, employing markers such as Foxp2 and calbindin, revealed no differences between genotypes (Supplementary Fig. 6i–q).
Fig. 5. Cortical architecture is preserved in Mbe/Mbe mutants, but acute depletion of Vps15 results in a neuronal migration defect.
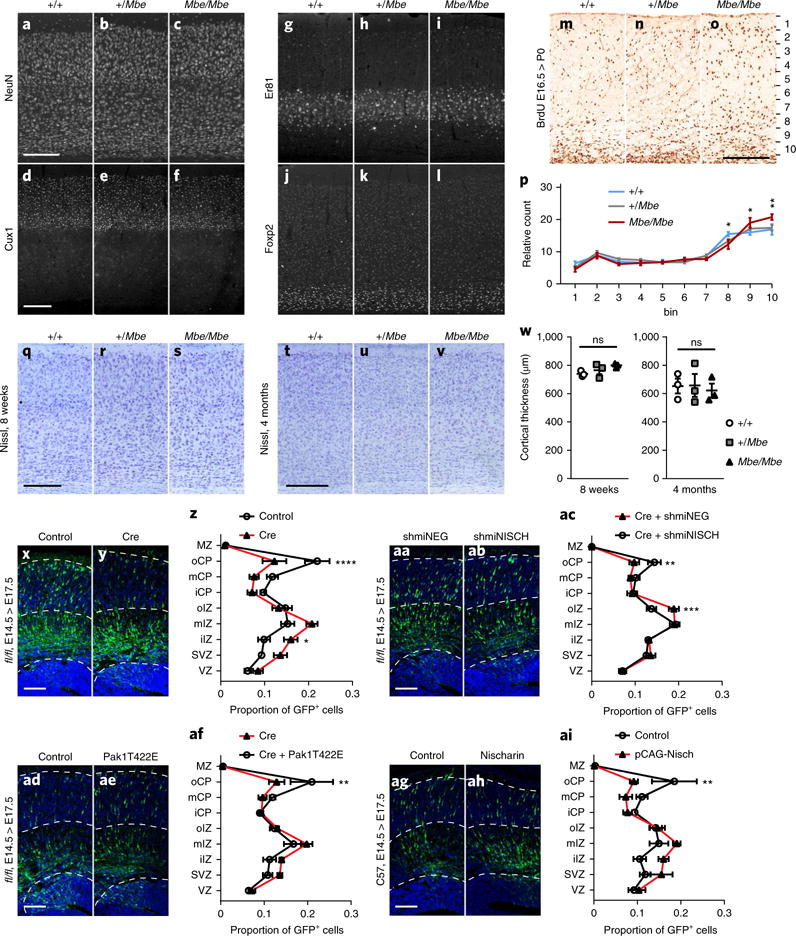
a-l, Representative immunostaining of the cortex for +/+, +/Mbe and Mbe/Mbe animals aged 8 weeks, using NeuN (a–c), Cux1, which labels layers II-IV (d–f), Er81, which labels layer V (g–i), and Foxp2, which labels layer VI (j–l; n = 3 animals per genotype). Cortical lamination is preserved in Mbe/Mbe mutants. These experiments were performed twice with similar results. m–p, Birthdate labeling results, showing representative coronal sections stained with sera against BrdU. BrdU was delivered to pregnant dams at E16.5, followed by analysis of brains at P0. The cortex was divided into ten equal bins and the distribution of BrdU+ cells mapped for +/+, +/Mbe and Mbe/Mbe animals (n = 3 animals per genotype). There was a significant interaction effect between genotype and distribution of cells across all bins (n = 3 animals per genotype; two-way repeated-measures ANOVA with Tukey’s multiple-correction test; F18,54 = 2.081, P = 0.02). In addition, there was a significant accumulation of BrdU+ neurons in bins 9 (+/+ vs. Mbe/Mbe, P = 0.018) and 10 (+/+ vs. Mbe/Mbe, P = 0.002; +/Mbe vs. Mbe/Mbe, P= 0.008), with a concomitant reduction of BrdU+ neurons in bin 8 (+/+ vs. Mbe/Mbe, P= 0.01). q–v, Representative Nissl staining of the somatosensory cortex of +/+, +/Mbe and Mbe/Mbe animals aged 8 weeks (q–s) and 4 months (t–v). w, Quantification of cortical thickness reveals no significant difference between genotypes (n = 3 animals per genotype; one-way ANOVA with Tukey’s multiple comparison; 8 weeks: +/+ vs. Mbe/Mbe, P= 0.13; +/Mbe vs. Mbe/Mbe, P = 0.44; 4 months: +/+ vs. Mbe/Mbe, P = 0.93; +/Mbe vs. Mbe/Mbe, P = 0.91). x–ai, Representative images for in utero electroporation experiments. Constructs were electroporated at E14.5 before analysis at E17.5. (x–z) Electroporation with a control vector or pCAG-Cre in Vps15 fl/fl animals revealed an accumulation of cells in the intermediate zone with a concomitant reduction in the cortical plate (n = 6 animals per condition; interaction P < 0.0001). (aa–ac) Expression of a shmiRNA targeting Nischarin (shmiNISH) partially rescues the phenotype caused by Cre mediated Vps15 depletion (shmiNEG, negative control shmiRNA; n = 4 animals per condition; interaction P = 0.002). (ad–af) Overexpression of a phosphomimetic mutant of Pak1 (T422E) partially rescues the phenotype caused by Cre mediated Vps15 depletion (n = 6 animals per condition; interaction P = 0.03). (ag–ai) Overexpression of Nischarin (pCAG-Nisch) in wild-type mice results in a defect in neuronal migration with a notable reduction in the number of GFP+ cells in the cortical plate (n = 4 animals per condition; interaction P = 0.01). VZ, ventricular zone; SVZ, subventricular zone; IZ, intermediate zone; CP, cortical plate; MZ, marginal zone; oCP, mCP, iCP, oIZ, mIZ and iIZ, outer, inner and medial CP and IZ, respectively. For x–ai we used two-way repeated-measures ANOVA with Bonferroni multiple-comparison tests; see Supplementary Table 1. **P< < 0.01; ***P< 0.001; ****P< 0.0001. Scale bars in a, d, o, q and t: 200μm; in x, aa, ad and ag: 100μm. Error bars show mean ± s.e.m.
Acute depletion of Vps15 causes neuronal migration defects in the murine cortex
As the Mbe/Mbe mutation results in some functional protein, we explored the effect of acute depletion of Vps15 in the developing cortex. We performed in utero electroporation on Vps15-knockout animals at E14.5, delivering a Cre recombinase alongside a GFP-expressing vector. Animals were killed for analysis at E17.5, and the distribution of GFP+ cells was blindly quantitated. We found that acute depletion of Vps15 results in a severe migration defect, with a notable reduction of GFP+ cells in the outer cortical plate (oCP; n = 6, P < 0.0001; Fig. 5x–z). Given that Nischarin is found at higher levels in Mbe/Mbe mutants, we then asked whether Nischarin knockdown might rescue the aforementioned migration defect. First, we confirmed that knockdown of Nischarin, by itself, does not influence neuronal migration, by delivering short hairpin microRNAs (shmiRNAs) validated in Neuro2A cells to the developing cortex (Supplementary Fig. 7a–e). Next, we delivered a Cre recombinase to Vps15–conditional knockout animals at E14.5 with shmiRNAs targeted to Nischarin or, alternatively, a scrambled control. Blind quantitation showed that Nischarin knockdown partially rescued the cortical migration defect that results from acute Vps15 depletion (n = 4, P = 0.003, oCP; Fig. 5aa–ac). Given the decreased phosphorylation (T422) of the downstream Nischarin effector Pak1 in Mbe/Mbe mutants, we then asked whether the effect of acute Vps15 ablation could be alleviated by expression of a Pak1 phosphomimetic. While overexpression of T422E Pak1 itself does not significantly influence the distribution of neurons (n = 4 animals per condition, interaction P = 0.7074; Supplementary Fig. 7f–h), when delivered with a Cre recombinase on the Vps15-knockout background, it enhanced neuronal migration (n = 6, P=0.003, oCP; Fig. 5ad–af). We further predicted that overexpression of Nischarin would cause a severe defect in migration in wild-type animals. To test this, we performed in utero electroporation of wild-type C57/Bl6J mice, which were killed for analysis at E17.5. Blind quantitation revealed an increase in the number of GFP+ cells in the subventricular and ventricular zones in animals overexpressing Nischarin, with a concomitant reduction in oCP (n = 4, P = 0.005; Fig. 5ag–ai and Supplementary Fig. 7i–n). Taken together, these experiments support the hypothesis that neuronal migration defects caused by Vps15 depletion are associated with perturbation of a Nischarin–Pak1 signaling pathway.
Complete ablation of Vps15 causes severe cortical atrophy
Next, we explored the impact of a complete ablation of Vps15 in the telencephalon, using a Vps15-conditional knockout animal crossed to the Emx1-Cre driver line23. We did not observe a phenotype in heterozygous animals (+/fl Emxl-Cre) but noted a reduction in cortical thickness in homozygotes (fl/fl Emxl-Cre) at P0 that was more severe at Pll (Fig. 6a-h). At both timepoints the hippocampus was barely discernible, with no structured pyramidal cell layer or dentate gyrus. This degeneration was accompanied by a large increase in caspase-3+ apoptotic cells in fl/fl Emxl-Cre animals at P0 (Fig. 6i-k). This phenotype was also evident at El4.5, where we again observed a reduction in cortical thickness, with extensive apoptosis in proliferative and postmitotic regions (Supplementary Fig. 8a-g). At El4.5 we observed a reduction in the thickness of Sox2+ and Tbr2+ progenitors, a decrease in the mitotic output as assessed by pH3 staining and a disorganized radial glial scaffold in fl/fl Emxl-Cre animals (Supplementary Fig. 8h-s). Next, we undertook histological analysis of P0 cortical sections stained with sera against LC3 and p62, which serves a cargo receptor for the autophagic degradation of ubiquitinated substrates26. We observed a large increase in the number of cells with p62+ (Fig. 6o-q) and LC3+ (Fig. 6l-n) puncta. Taken together, these data show that complete ablation of Vpsl5 results in severe, progressive degeneration of the hippocampus and cortex that is associated with caspase-induced apoptosis and the accumulation of LC3+ and p62+ substrates.
Fig. 6. Severe cortical atrophy and caspase-induced apoptosis in Vps15-knockout animals.
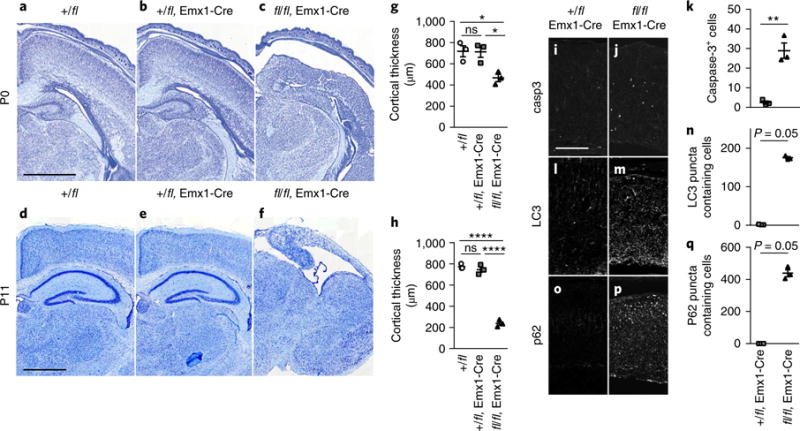
a–f, Representative Nissl stains of Vps15-knockout animals crossed with the Emx1-Cre driver line at P0 (a–c) or P11 (d–f). Three genotypes are shown; controls without Cre (+/fl), heterozygotes with Cre (+/fl Emx1-Cre) and homozygotes with Cre (fl/fl Emx1-Cre). While heterozygotes are unaffected, homozygous animals present with cortical atrophy at P0 that is more severe at P11, indicative of a progressive phenotype. These experiments were performed twice with similar results. g,h, Quantification at P0 (g) and P11 (h) reveals a highly significant reduction in cortical thickness in homozygous (fl/fl Emx1-Cre) animals (P0: n = 3 animals per genotype; one-way ANOVA with Tukey’s multiple comparison; +/fl vs. fl/fl Emx1-Cre, P = 0.026; +/fl Emx1-Cre vs. fl/fl Emx1-Cre, P = 0.028; P11: n = 3 animals per genotype; one-way ANOVA with Tukey’s multiple comparison; +/fl vs. fl/fl Emx1-Cre, P < 0.0001; +/fl Emx1-Cre vs. fl/fl Emx1-Cre, P < 0.0001). i,j, Representative images of caspase3 stained of P0 cortices in +/fl Emx1-Cre animals (which serve as controls as no phenotype is evident) and fl/fl Emx1-Cre mice (n = 3 animals per genotype). k, Quantification of caspase-3 staining shows a highly significant increase in positive cells in fl/fl Emx1-Cre mutants (n = 3 animals per genotype; one-tailed unpaired t test, t4 = 6.62, P = 0.001). l,m, LC3 staining in P0 cortices (representative images) reveals the presence of LC3 aggregations in fl/fl Emx1-Cre animals. n, Quantification of LC3 puncta in +/fl Emx1-Cre and fl/fl Emx1-Cre mice reveals a significant difference between genotypes (n = 3 animals per genotype; Mann-Whitney test, one-tailed; P = 0.05). o–q, p62 staining in P0 cortices (representative images) shows an upregulation of this cargo receptor in fl/fl Emx1-Cre that is significant and indicative of defects in the clearance of autophagosomes (n = 3 animals per genotype; Mann-Whitney test, one-tailed; P= 0.05). Scale bars in a and d, 1,000μm; in i, 200μm. *P<0.05; **P<0.01; ****P< 0.0001. Error bars show mean ± s.e.m.
Mutations in VPS15 are associated with neurodevelopmental disease in humans
Given that the Mbe/Mbe mice present with defects in neuronal migration and that complete ablation of Vpsl5 results in severe cortical atrophy, we explored whether mutations in the human homolog would result in structural brain phenotypes. We networked with clinical geneticists through interfaces such as Genematcher27. This resulted in the identification of a family with non-consanguineous parents in which one of four children presented with severe cortical and optic nerve atrophy, localized cortical dysplasia, intellectual impairment, spasticity, ataxia, psychomotor delay, muscle wasting, pseudobulbar palsy, a mild hearing deficit and late-onset epilepsy (Fig. 7a–c). Whole-exome sequencing (WES) of all family members identified a single homozygous coding variant in the affected patient that was not reported in online genome databases (for example, ExAC genome browser). We did not identify any other unreported de novo or inherited variants in the affected patient. This variant, an A-to-C mutation in VPS15 (GRCh38.p5; chr3: 130,681,528), alters a highly conserved leucine residue to arginine (L1224R) (Supplementary Fig. 9a,b). One unaffected sibling and both unaffected parents are heterozygous for this variant. We mapped the position of the mutation onto the structure of the yeast Vps15–Vps34–Beclin1 complex. L1224 lies within the WD40 domain of Vps15 on the fourth beta strand, a blade that is important for folding and stability28 (Fig. 7d).
Fig. 7. An L1224R mutation in VPS15 is associated with neurodevelopmental disease.
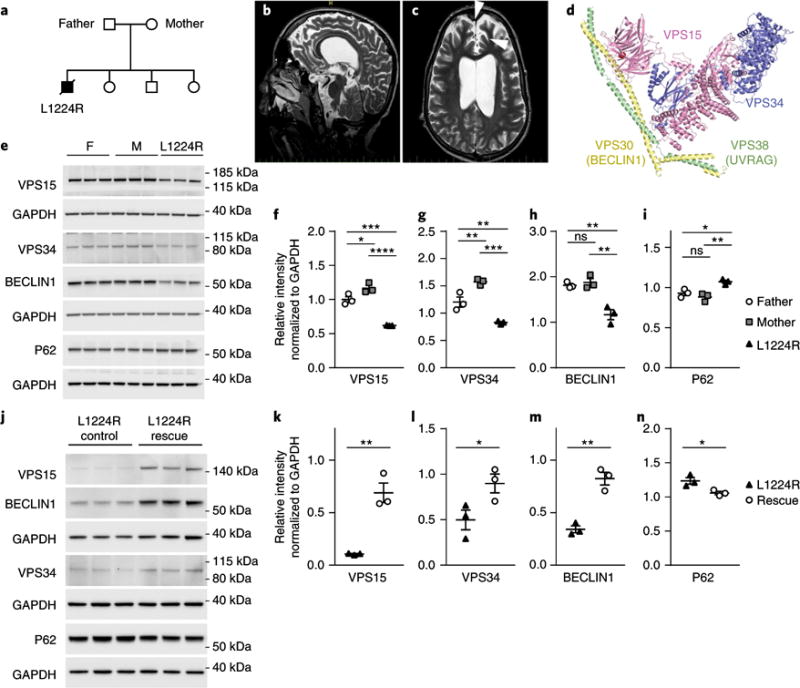
a, Structure of the family harboring a missense mutation in VPS15. The father and mother are heterozygous for the variant, whereas the proband (filled box) is homozygous for the L1224R mutation. Unaffected siblings were either heterozygous or wild-type. b,c, MRI images of the affected patient (at age 16) who presents with bilateral cortical and optic nerve atrophy, regions of cortical dysplasia (arrowheads), ataxia, intellectual impairment and epilepsy. d, Structural model of the VPS15-VPS34-BECLIN1 complex, with VPS15 shown in pink. The L1224R mutation lies in the WD40 domain in the fourth beta strand and is part of a hydrophobic core (red dot). e, Western blot analysis of VPS15, VPS34, BECLIN1 and P62 in protein lysates from dermal fibroblasts obtained from the father (F), mother (M) and proband (L1224R). f–i, Normalization with GAPDH reveals a highly significant reductions in VPS15, VPS34 and BECLIN1 in the affected proband and mild reductions in VPS15 and VPS34 in the father (n = 3 separate flasks per individual, one-way ANOVA with Tukey’s multiple comparison; VPS15: father vs. mother, P = 0.036; father vs. proband, P = 0.0007; mother vs. proband, P < 0.0001; VPS34: father vs. mother, P = 0.01; father vs. proband, P = 0.009; mother vs. proband, P = 0.0002; BECLIN1: father vs. proband, P = 0.004; mother vs. proband, P= 0.0052; P62: father vs. proband, P = 0.02; mother vs. proband, P=0.006). These experiments were performed twice with similar results. j, Western blot analysis of lentiviral rescue experiment. L1224R fibroblasts were infected with a lentivirus expressing either mCherry (control), or mCherry + wild-type VPS15 (rescue). k–m, This resulted in significant increases in VPS15, VPS34 and BECLIN1 in the rescue cells (n = 3 separate flasks per individual, one-tailed unpaired t test; VPS15: P = 0.002; VPS34: P= 0.03; BECLIN1: P= 0.001). These experiments were performed twice with similar results. n, Ectopic expression of VPS15 in L1224R cells resulted in a significant reduction in P62 (n = 3 separate flasks per individual, one-tailed unpaired t test, P = 0.015). All immunoblots shown are cropped; see Supplementary Fig. 11 for full-length blots). Error bars show mean ± s.e.m. *P<0.05; **P<0.01; ***P<0.001; ****P<0.0001.
We hypothesized that the L1224R mutation might compromise the stability of this protein complex. To test this, we obtained dermal fibroblasts from the affected individual and his parents. Western blot analysis revealed a large reduction in the amount of VPS15 protein in the proband in comparison to parental fibroblasts (n = 3 replicates, proband vs. mother: P < 0.0001; proband vs. father: P = 0.0007; Fig. 7e,f). We also observed a concomitant decrease in the levels of VPS34 and BECLIN1 in fibroblasts of the affected patient (n = 3 replicates, VPS34: proband vs. mother, P = 0.0002; proband vs. father, P = 0.009; BECLIN1: proband vs. mother, P = 0.002; proband vs. father, P = 0.004; Fig. 7e,g,h). In general, we observed reduced levels of the VPS15–BECLIN1–VPS34 complex in the father in comparison to the mother. We did not observe any significant differences in mRNA levels for VPS15, VPS34 and BECLIN1 when comparing patient and parent cell lines, indicating that the reduction in protein levels is due to post-transcriptional dysregulation (Supplementary Fig. 9c). An assessment of the number of autophagosomes and autophagy flux by analysis of LC3-I and LC3-II levels revealed a mild impairment in the patient when compared to his parents, but this difference was not statistically significant (Supplementary Fig. 9d–g). In contrast, we did observe a significant increase in the levels of the autophagy cargo receptor P62 (n = 3, proband vs. mother: P = 0.006; proband vs. father: P = 0.02; Fig. 7e,i) and a reduction in LysoTracker staining in the cells of the proband when compared to the father (n = 3, proband vs. father: P = 0.046; Supplementary Fig. 9h,i).
We asked whether we could rescue the accumulation of P62+ autophagic substrates in the L1224R patient cells by ectopically expressing wild-type VPS15. To do so, we generated a lentivirus that expresses VPS15 and mCherry. Delivery of this virus to patient cells resulted in upregulation of the VPS15 protein and stabilization of BECLIN1 and VPS34 levels (Fig. 7j–m). Moreover, in comparison to infected control cells, we observed a significant decrease in P62 levels upon ectopic expression of VPS15 (n = 3, P = 0.015; Fig. 7j,n). Taken together, these data show that the L1224R mutation compromises the function of the VPS15-BECLIN1-VPS34 complex, leads to an accumulation of autophagic substrates and indicates that mutations in VPS15 are associated with human neurodevelopmental disease.
Discussion
The role of Vps15 in neuronal migration
Here we report the establishment of a forward genetics screen for mice with structural brain phenotypes. This has resulted in the identification of the Marble mouse, which presents with a fractured pyramidal cell layer in the hippocampus, attributable to an impairment in neuronal migration and a hypomorphic mutation in Vps15. How do mutations in Vps15 cause defects in neuronal migration? We have shown that there is a large increase in Nischarin in the developing telencephalon in Mbe/Mbe mutants, accompanied by reduction in activated Pak1. This result is consistent with previous studies showing that Nischarin binds to and inhibits the kinase activity of Pak1, exerting an inhibitory impact on cell migration21. This is further reinforced by our in utero electroporations, which showed that acute ablation of Vps15 in the cortex results in a migration defect that can be rescued, in part, by reducing the levels of Nischarin or by overexpression of a Pak1 phosphomimetic. Pak1 is known to play a critical role in cytoskeletal organization, by influencing microtubule dynamics through the phosphorylation of tubulin cofactor B29. Pak1 has also been reported to influence the actin cytoskeleton by activating LIM kinase (LIMK1), which regulates cofilin phosphorylation30. There is further evidence that the amino terminus of Nischarin binds directly to the PDZ domains of LIMK1, exerting an inhibitory effect31. Cofilin phosphorylation has been shown to stabilize the actin cytoskeleton in the leading process of migrating neurons, promoting somal translocation32. The reduced levels of activated Pak1 in Mbe/Mbe mutants and the abundance of Nischarin might result in decreased cofilin phosphorylation, destabilizing the leading process. As Nischarin is known to bind integrins, it is also conceivable that the distribution of cell surface receptors may be altered in Mbe/Mbe mutants. Anton and colleagues have shown that perturbation of integrin signaling in α3β10-deficient neurons results in a defect in neuronal migration that is associated with altered actin dynamics in the leading and trailing processes33. In light of this fact, and as Nischarin and Pak1 have multiple effectors, we propose that the neuronal migration defect in Mbe/Mbe mutants involves multiple pathways that converge on the microtubule and actin cytoskeleton (Supplementary Fig. 10). We emphasize that we cannot exclude the possibility that other proteins misregulated in the Marble mouse (for example, Fgfr3 or Slit2) also contribute to the phenotype; however, it is apparent that overexpression of Nischarin alone is sufficient to result in a neuronal migration phenotype.
Phospholipids and neurodevelopmental disease
Evidence that abnormalities in the processing of various phospholipids cause neurodevelopmental syndromes34 is accumulating. Genetic studies in humans have shown that mutations in PIK3R2 and PIK3CA cause a spectrum of phenotypes, including megalencephaly, polymicrogyria and focal cortical dysplasia, the last of which in some instances is accompanied by hydrocephalus and polydactyly35,36. Together, PIK3R2 and PIK3CA are responsible for phosphorylating phosphatidylinositol 4,5-bisphosphate, generating phosphatidylinositol 3,4,5-trisphosphate (PIP3), which regulates a wide range of cellular processes. More recently, mutations in SNX14, a protein that is associated with late endosomes and lysosomes and that binds to phosphatidylinositol (3,5)-bisphosphate, was shown to cause cerebellar atrophy. This phenotype was associated with impaired autophagic clearance and subsequent caspase-induced cell death26. This work suggests that mutations in the VPS15–VPS34–BECLIN1 complex may be associated with neurological disorders, both common and rare. Indeed, there is some evidence to suggest a variant within the promoter of VPS34 may be associated with schizophrenia37. In summary, this work highlights the utility of forward-driven genetic screens to gain novel insights into the molecular basis of telencephalic development and underscores the importance of the Vps15–Vps34 complex in neuronal migration and survival.
Methods
Methods, including statements of data availability and any associated accession codes and references, are available at https://doi.org/10.1038/s41593-017-0053-5.
Methods
ENU screen
C57BL/6 male mice (Mus musculus) were given ENU injections and subsequently crossed with C3H/HeH females to generate G1 founder males. These founders were then out-crossed to C3H/HeH and the G2 daughters backcrossed to the G1 Founder male. Adult G3 mice aged approximately 16 weeks were killed for analysis and their brains postfixed in 4% paraformaldehyde (PFA) before dehydration in 30% sucrose. Brains were sectioned coronally (40 μm) and stereotaxically matched sections through the telencephalon (bregma −2.06 mm) were mounted on electrostatically charged slides and Nissl stained (0.6% cresyl violet). Sections were scanned using an Epson Perfection V750 Pro scanner and the following measurements recorded using the Image J software package: volume of the third ventricle and lateral ventricles; total brain volume; corpus callosum volume; thickness of the cortex; length of the pyramidal cell layer of the hippocampus; thickness of the molecular layer of the hippocampus; thickness of the stratum oriens of the hippocampus. For each genotype, at least 12 animals were analyzed.
Genetic mapping, exome sequencing and genotyping
DNA was extracted by standard techniques and 51 microsatellite markers covering all autosomes were amplified by PCR and visualized on agarose gels stained with ethidium bromide (4%). This established linkage to chromosome 9 between D9MIT11 and D9MIT81. Whole-exome sequencing was then performed using the Agilent whole-exome capture kit (SureSelectXT Mouse Kit, S0276129). Captured material was indexed and sequenced on the Illumina platform at the Wellcome Trust Sanger Institute. Exome sequence data were mapped to the mouse genome using Burrows-Wheeler Aligner (BWA) v0.5.9 and variants called using mPileUp within the SAMTools v0.1.19 suite38. The data has been submitted to the ENA (accession: ERS017958). The variant in Vps15 was confirmed by Sanger sequencing using the following primers: forward, AGTCCAACTGGCCTTAAACT; reverse, GTATAACCAAAATCCGCTCA, which were then employed to genotype animals for the subsequent studies. Mbe/Mbe animals were maintained on a C3H/He background. Vps15–conditional knockout animals were maintained on a C57/BL6 background. The Vps15 rescue line was created by injection of a modified BAC (RP24-281C16) into the pronuclei of B6CBAF1 zygotes. Transgenic founders were identified by PCR analysis (Supplementary Table 2) before crossing into the Mbe line. Animals were housed at the IMP/IMBA preclinical phenotyping facility with a maximum of six individuals per cage, with a 14-h light (6:00 to 20:00) and 10-h dark cycle.
Cellular studies
Mouse embryonic fibroblasts (MEFs) were prepared from E13.5 embryos. The body (without head or liver) was minced and incubated in 0.05% trypsin-EDTA at 37°C for 10 min and then triturated with a pipette tip. The suspension was centrifuged at 800 rpm for 5 min and the cell pellet suspended in culture medium (DMEM supplemented with 10% FBS (FBS), 2% L-glutamine (Sigma, G7513), 1% PenStrep (Sigma, P0781) and 1% nonessential amino acids (Sigma, M7145). The following day, cells were trypsinized in 0.15% trypsin EDTA, passed through a 70-μm cell strainer and plated on gelatin-coated dishes. Human dermal fibroblasts were cultured in DMEM supplemented with 20% FBS, 1% L-glutamine, 1% PenStrep. For the EGFR degradation assay, cells were serum-starved in serum-free culture medium for 2 h. Culture medium was replaced with prewarmed uptake medium (DMEM supplemented with 2% L-glutamine, 1% PenStrep, 1% nonessential amino acids, 20 mM HEPES, 2% BSA and 100 ng/mL mouse EGF-488 (Thermo Fisher Scientific, E-13345)), and cells were incubated for the indicated time periods. Cells were washed twice with ice-cold 1×PBS, then lysed in ice-cold lysis buffer. Autophagy flux was assessed as previously described39. Cells were treated with 200 nM (MEFs) or 400 nM (HDFs) of the lysosomal inhibitor Bafilomycin A1. Autophagy flux was calculated by assessing the accumulation of LC3-II, 2 h and 4 h following lysosomal inhibition. Specifically, flux was calculated by: (LC3-II 2 h/Gapdh)/(LC3-II 0 h/Gapdh) and (LC3-II 4 h/Gapdh)/(LC3-II 2 h/Gapdh); n = 3 animals. The PDGF receptor degradation assay was performed as previously reported16 (n = 3 animals per genotype, one or two technical replicates/timepoint). Mouse embryonic fibroblasts (MEFs) were starved in medium containing 0.2% BSA for 24 h, then treated with 20 μg/mL cycloheximide for 30 min before stimulation of receptor endocytosis by addition of 20 ng/mL PDGF-BB (Gibco, PMG0044) in starving medium supplemented with cycloheximide. At indicated timepoints, cells were washed twice with ice-cold 1×PBS and fixed in 4% PFA for 15 min, followed by permeabilization in 0.1% Triton X-100 in PBS. Cells were then incubated with primary antibody against PDGF receptor β (1:250, Cell Signaling #3169) followed by IRDye 800-labeled secondary antibody (LI-COR) and CellTag 700 stain (LI-COR) for normalization. Signal was detected using an Odyssey scanner (LI-COR). Signal from wells that were not treated with primary antibody was subtracted from the signal from sample wells, and empty wells were used for background subtraction. The half-life of PDGFR was calculated by fitting data to a one-phase decay curve using GraphPad Prism.
Rescue experiment in human cells
Human VPS15 cDNA was cloned into the pRRL lentiviral backbone downstream of a SFFV promoter40. For virus production, the transfer vectors psPAX2 (Addgene) and PMD2.G (Addgene) were transfected into Lenti-X (Clonetech) packaging cells. Human dermal fibroblasts were transduced with concentrated virus at an efficiency of >90% as determined by mCherry expression. Four days after infection, cell lysates were prepared for western blot analysis.
Western blotting
Protein lysates were prepared in ice-cold RIPA buffer (10 mM TrisHCl pH 7.5, 150 mM NaCl, 1 mM EGTA, 1% sodium deoxycholate, 1% Triton X-100, 0.1% SDS) supplemented with protease and phosphatase inhibitor (Pierce #88668). Cells were incubated in lysis buffer for 15 min on ice before centrifugation. Frozen tissue samples were homogenized using a tungsten carbide bead in a Qiagen Tissue Lyser (2×1 min, 20 Hz), incubated on ice for 1 h, then centrifuged twice for 20 min each time. Protein concentration was measured using a Pierce BCA Protein Assay Kit (#23225). Protein lysates were run on NuPAGE protein gels, blotted onto nitrocellulose or polyvinylidene fluoride membranes, blocked and probed with primary antibodies in 5% skimmed milk/TBST or 5% BSA/TBS. Antibodies targeting phosphoproteins were incubated with 1 mM sodium orthovanadate in 0.5% BSA/TBS. The following primary antibodies were used: 1:2,000 Vps15 for mouse studies (Novus Biologicals NBP1-30463)39, 1:1,000 VPS15 for human studies (Abcam ab124817, Abcam ab128903)41, 1:500 Vps34 (Cell Signaling, #3811)42,43, 1:1,000 Beclin1 (Cell Signaling #3738)44, 1:500 p62 (Novus Biologicals, H00008878-M01)45, 1:2,000 GAPDH (Millipore, MAB3 74)26,46, 1:1,000 ubiquitin (Santa Cruz, sc-8017)47, 1:10,000 α-tubulin (Sigma Aldrich, T6199)48, 1:100 LC3 (Nanotools, 0260-100/LC3-2G6)49, 1:600 EGFR (Cell Signaling #4267 S)50, 1:200 Nischarin (Santa Cruz, sc-365364)21, 1:500 PAK1 T423 (Cell Signaling, #2601 S)51 and 1:500 N-terminal Vps15 antibody (Proteintech, 17894-1-AP). Western blots were quantified using ImageJ. Western blots were replicated at least once, yielding similar results.
qPCR
qPCR was performed as previously described52. This involved the dissection of brains from embryos (E10.5, E12.5, E14.5, E16.5 and E18.5) and postnatal mice (P0, P6 and adult). Samples were then frozen before mRNA extraction and cDNA synthesis (SuperScript III First-Strand Synthesis System, Invitrogen, 18080-051). We used SYBR green on a Bio-Rad Cycler together with intron spanning primers to amplify Vps15, Vps34, Beclin1 and Nischarin along with three control genes (Pgk1, Tfrc and Hprt; Supplementary Table 2). Reactions were performed in triplicate and the Ct values ascertained. The geometric mean of the control genes was calculated, permitting determination of ΔCt and the relative mRNA level53,54. For qPCR on human dermal fibroblast samples, qPCR used intron spanning primers to amplify VPS15, VPS34, BECLIN1 and three control genes (Supplementary Table 2).
Whole-brain proteomics
Quantitative tandem mass tags (TMT) proteomics was performed in accordance with previously described protocols55. First, flash-frozen hippocampi were homogenized in a buffer containing 8 M urea with 200 mM ammonium bicarbonate using a Qiagen tissue lyser at 20 Hz twice for 1 min each time. Samples were then treated with TCEB at 56 °C for 30 min and 7.5 μL; 5 mg/mL iodoacetamide solution for 30 min before dilution with 20 mM ABC and digestion with LysC (enzyme-to-protein ratio of 1:40 for 3 h at 37 °C). After this predigestion, samples were diluted with 200 mM ABC to a final urea concentration of 2 M. The tryptic digest was done with an enzyme-to-protein ratio of 1:40 for 2 h at 37 °C. Following desalting with C18 cartridges (Sep-Pak Vac 1 cc (50 mg)), samples were labeled with TMT in accordance with the manufacturer’s specifications. TMT labeling reagents were equilibrated to room temperature and 41 μL of anhydrous acetonitrile added before incubation with the samples for 1 h. Strong cation exchange chromatography (SCX) was performed using an Ultimate system (Thermo Fisher Scientific) at a flow rate of 25 μL/min and a custom-made PolySULFOETHYL A (poly LC) column (5 μm particles, 300 Å, 1 mm i.d. X 250 mm). A total of 300 pg of peptide was loaded on the column, and 130 fractions were collected and stored at −80 °C. SCX fractions were then analyzed further using an UltiMate 3000 HPLC RSLCnano system (Thermo Scientific) coupled to a Q Exactive Plus mass spectrometer (Thermo Scientific) equipped with a Proxeon nanospray source. Fractions were loaded onto a trap column at a flow rate of 25 μL/min using 0.1% TFA as a mobile phase. After 10 min, the trap column was switched in line with the analytical column. Peptides were eluted using a flow rate of 230 nL/min and a binary 180-min gradient. The two-step gradient started with the mobile phases: 95% A (water/formic acid, 99.9/0.1, v/v) and 5% B (water/acetonitrile/ formic acid, 19.92/80/0.08, v/v/v) increased to 10% B over the next 5 min and to 35% B over the next 55 min, followed by a gradient over 5 min to 90% B, where it was kept for 5 min, then decreased over 2 min back to the gradient 95% A and 5% B for equilibration at 30 °C. The Q Exactive Plus mass spectrometer was operated in data-dependent mode, using a full scan (m/z range 350–1,650, resolution of 70,000, target value 3 × 10⁶) followed by MS/MS scans (resolution of 35,000, target value 1 × 10⁶, maximum injection time 120 ms) of the 10 most abundant ions. MS/ MS spectra were acquired using normalized collision energy 35% and an isolation width of 1.2 m/z. For detection of TMT reporter ions, a fixed first mass of 115 m/z was set for the MS/MS scans. Precursor ions selected for fragmentation were put on a dynamic exclusion list for 30 s. Raw data were processed in Proteome Discoverer (version 1.4.1.14, Thermo Fisher Scientific, Bremen, Germany) using MS Amanda (version 1.4.14.5564, FH OÖ/IMP, Austria) as a database search engine against the UniProt mouse database (20150830, 16,719 sequences) concatenated with a database of 298 contaminants provided with Proteome Discoverer. All acquired SCX fractions were searched simultaneously using a precursor mass tolerance of 7 ppm and 0.03 Da fragment ion tolerance. Methylthiocysteine and 6plex-TMT at the N-terminus and lysine were specified as fixed modifications, whereas oxidation of methionine was set as dynamic modification. The result was filtered to 0.5% FDR using a Percolator algorithm integrated in Proteome Discoverer, and a minimum peptide sequence length of 7 and a minimum Amanda Score of 120 were required. To quantify TMT reporter ions, we used the integration method provided by Proteome Discoverer with a mass window of 5 ppm. Protein grouping was performed, applying strict maximum parsimony. Statistical significance of protein regulation was determined using LIMMA.
Immunohistochemistry
Mice were killed for analysis at E14.5, P0 and P11. Brains were fixed in 4% PFA overnight, dehydrated in 30% sucrose, and 12-μm sections were prepared. Adult mice aged 8 weeks and 4 months were perfused with 0.9% NaCl and 4% PFA and their brains postfixed for 6 h in 4% PFA. Following dehydration in 30% sucrose, 40-μm sections were prepared on a sledge microtome. Primary antibodies were diluted in 0.1–0.3% Triton-X100/PBS supplemented with 2% donkey serum (Abcam, ab7475) overnight at 4 °C (for fluorescence) or in 0.1–0.3% Triton-X100/PBS supplemented with 2% dry milk powder (for permanent staining). The following concentrations were used: 1:1,000 GFP (Abcam, ab13970)56, 1:400 caspase-3 (Cell Signaling, #9661)57, 1:500 LC3 (Nanotools, 0260-100/LC3-2G6), 1:500 p62 (Novus Biologicals, H00008878-M01), 1:300 Sox2 (Santa Cruz, sc-17320)58, 1:300 Tbr2 (Millipore, AB15894)59, 1:100 DCX (Santa Cruz, sc-8066)60, 1:500 pH3 (Millipore, 06-570)61, 1:300 nestin (BD Biosciences, #611658)62, 1:300 NeuN (Millipore, MAB377)63, 1:250 calbindin (Millipore, MAB1778)64, 1:100 Cux1 (Santa Cruz, sc-6327)7, 1:50 Nischarin (Santa Cruz, sc-365364), 1:1,000 Er81 (Jessell lab)7, 1:300 FoxP2 (Abcam, ab16046)7, 1:400 Prox1 (Millipore, MAB5654)65, 1:500 GFAP (Dako, Z0334)66, 1:2,000 calretinin (Swant, 6B3)67 and 1:500 parvalbumin (Millipore, MAB1572)68. Where necessary, antigen retrieval was performed by heating sections to 90 °C in antigen retrieval buffer (Vector, H-3301), cooled at room temperature (20-25 °C) for 20 min and washed in 1× PBS before incubation with primary antibody. For Nischarin immunohistochemistry, sections were blocked with the Mouse on Mouse (M.O.M.) basic kit (Vector, MKB-2202). For the quantification of cleaved caspase-3, the total number of positive cells was counted manually in a 340-μm (E14.5) or 850-μm (P0 and P11) stretch of the cortex (n = 3 animals, 3 images/animal). For quantification of LC3 and p62, the numbers of cells positive for puncta were counted manually using the DAPI channel as a reference in a 200-μm broad region of the cortex (n = 3 animals, 3 images/animal). All counting was conducted blind to genotype.
Nissl and Golgi-Cox staining
For Nissl staining sections were incubated in 1% cresyl violet solution for 3–4 min, then washed and dehydrated in increasing ethanol concentrations. The cortical thickness was measured in Nissl-stained sections using ImageJ software. For each animal, we took three measurements in the somatosensory cortex and the visual cortex (n = 3 animals per genotype). Ectopic Nissl+ cells in the oriens layer of the hippocampus were quantified using ImageJ software by manually counting the number of pyramidal cells in the oriens layer and the pyramidal cell layer in a box of 310-μm edge length. For Golgi staining, mice aged 4 months were perfused with 0.9% NaCl and their brains treated with the Rapid GolgiStain Kit according to the manufacturer’s instructions (FD Neurotechnologies, Inc., PK401). Dendritic spines were quantified as described69. In short, images of pyramidal neurons of the CA1 region of the hippocampus were captured using a Axioplan bright-field microscope. Spines located on tertiary apical dendritic branches in a single focal plane located at least 120 μm from the soma were quantitated (n = 4–6 neurons per animal (n = 3 animals per genotype). Neuron morphology was analyzed as previously reported70. Golgi-Cox impregnated 120-μm adult mouse brain sections were imaged in 1-μm z-intervals using a Axioplan bright-field microscope, and CA1 pyramidal neurons were traced in 3D using ImageJ’s Simple Neurite Tracer plugin (n = 3 animals per genotype, 3 neurons each). Sholl analysis was performed using ImageJ’s Sholl analysis tool. Concentric circles were chosen in 20-μm increments, centered on the soma. All quantification of Nissl stains and assessment of spines was performed blind to genotype.
Birthdate labeling experiments
Pregnant mice at E12.5, E14.5 and E16.5 were injected intraperitoneally with BrdU at 100 μg/g body weight. Offspring were killed for analysis at P0 and P11 and their brains were sectioned. After quenching (3% H2O2, 0.1% sodium azide, 5 min), antigen retrieval and acid treatment (2 N HCl, 37 °C, 70 min), sections were incubated with a primary antibody against BrdU (1:300, ABD Serotec, OBT0030) in 2% milk in 0.3% Triton X-100/PBS overnight. After washing, sections were incubated with a conjugated secondary antibody (Vector Laboratories, MP-7404) followed by peroxidase substrate (Vector Laboratories, SK-4105). The P0 cortex was divided into ten bins of the same size and the number of BrdU+ puncta counted manually in blinded images (n =3 animals, 4–6 images/animal). For quantification of P11 brains, four regions of the hippocampus, equally spaced from rostral to caudal, were chosen for analysis. In each section, BrdU+ puncta were counted in the oriens layer, the pyramidal cell layer, the granule cell layer of the dentate gyrus and the hilus of the dentate gyrus and expressed as relative to the total number of BrdU+ puncta in the hippocampal area (n = 3 animals, 8-10 images/animal). For BrdU/NeuN immunohistochemistry, sections were subject to antigen retrieval, acid treatment (2 N HCl, 37 °C, 45 min) and incubated with primary antibodies against BrdU (1:300, ABD Serotec, OBT0030) and NeuN (1:300, Millipore, MAB377) in 0.3% Triton X-100/PBS supplemented with 2% donkey serum (Abcam, ab7475) overnight. Three regions of the hippocampus equally spaced from rostral to caudal were chosen for analysis. The number of BrdU+NeuN+ cells in a 850 μm × 850 μm window of the CA1 region was counted. The percentage of ectopic BrdU+NeuN+ neurons in the oriens layer relative to the total number of BrdU+NeuN+ neurons was then calculated. All cell counting was performed blind to genotype. All histological procedures were carried out according to legal requirements and covered by an approved license (MA58/006093/2011/14) from the city of Vienna, Austria.
In utero electroporation experiments
The full-length sequences of Nischarin and Pak1 were amplified by PCR from a mouse brain cDNA library and cloned into the pCAGEN vector (Addgene). ShmiRNAs were cloned using the BLOCK-iT Pol II miR RNAi Expression Vector Kit (Invitrogen, K4936-00) according to the manufacturers instructions. The knockdown efficiencies of shmiRNA constructs were determined following transfection into Neuro2A cells, FACS and western blot analysis. The control shmiRNA consisted of a scrambled sequence. The uteri of time-mated (E14.5), anesthetized C57/BL6J females were exposed after incision in the skin and peritoneum. Constructs supplemented with Fast Green tracer dye (Sigma Aldrich, F7252-5G) were injected into the lateral ventricle of the developing embryo. pCAGEN, pCAG-Cre (Addgene), pCAG-Nischarin and pCAG-Pak1T422E were injected at 0.5 μg/μL, pCAG-GFP (Addgene) at 0.2 μ g/μL and shmiRNA constructs at 1.9 μg/μL. Five 50-ms pulses of 36 V (950-ms intervals) were delivered using platinum electrodes coupled to a ECM830 (BTX) electroporator. Uterine horns were placed back into the abdomen and the incision closed with surgical sutures. The pregnant mouse was killed 3 d later by cervical dislocation and embryos collected for analysis. Following sectioning and staining with antibodies against GFP, images were captured and cell counting performed blind to the condition. A total of 2–5 images per mouse were counted using ImageJ.
Behavioral phenotyping
The behavioral testing of the mice started at age 12 weeks, and all tests were carried out chronologically as listed below on separate days. The open field was an enclosed arena consisting of gray PVC, measuring 50 cm long and 30 cm wide with 18-cm tall walls. The mouse was placed in a corner of the open field box, facing the wall, and tracked for 5 min. Distance travelled in the center, distance along the periphery and center entries were recorded. The elevated plus maze (EPM) consisted of two 29-cm long, 6-cm wide opposing open arms and two opposing enclosed arms 27 cm long and 6 cm wide at a height of 30 cm above the ground. The mouse was placed in the junction of the arms facing one of the closed arms and tracked for 5 min. We used the Anymaze software program (Stoelting Europe) to track the animals and extract the distance traveled, time spent in open and closed arms, and the number of entries. For rotarod assessment, mice were placed on the beam of the rotarod (Ugo Basile, Italy) facing in the direction opposite to rotation for 1 min at 5 rpm. Rotation speed was accelerated to a maximum of 30 rpm over 4 min. The latency before falling was measured up to a maximum of 6 min on the rod. Three trials were carried out with 1-h intervals71. For rewarded alternation, the T-maze consisted of one start arm and two goal arms each measuring 30 cm long, 10 cm wide and 29 cm tall. A food reward (condensed milk) was placed in each goal arm. Mice were food-deprived to 85% of their free-feeding weight. Mice were placed in the start arm facing the wall, and a free sample run was permitted. Following consumption of the food reward mice were placed back in the start arm and the rate of alternation recorded72. All behavioral phenotyping was performed blind to genotype. All animals were sex-matched littermates (n = 11 males, n = 9 females). Animals and their corresponding littermates were excluded in instances where the software tracking failed. All behavioral experiments were performed between 1 pm and 4 pm, during the animals dark cycle, and were carried out according to legal requirements and covered by an approved license (MA58/002639/2008/5) from the city of Vienna, Austria.
Human genetics
Exome sequencing was performed on all family members (proband, mother, father and three siblings). The family was a Caucasian family from the Czech Republic. For exome enrichment, the NimbleGen SeqCap EZ v3.0 system was used according to the manufacturer’s instructions. Adaptor-ligated libraries were then sequenced on an Illumina HiSeq 2000 instrument with a paired-end run of 101 bp to reach median coverage of 105×–140×. Image analysis, base calling and quality scoring were processed using the manufacturer’s software Real Time Analysis (RTA 1.13.48) and FASTQ sequence files generated by CASAVA. Sequence reads were trimmed to the first base with a quality >30 and mapped to Human Genome build hg19 (GRCh37) using GEM mapper73. SAMtools suite version 0.1.18 was used to call single nucleotide variants and short indels. Variants on regions with low mappability74, with read depth <10 or with strand bias P < 0.001 were filtered out. The population frequency of the variants was assessed by comparison to several databases: the 1,000 Genomes Project (http://www.1000genomes.org/), NHLBI Sequencing Project (ESP) release ESP5400 (http://evs.gs.washington.edu/EVS/), the ExAC genome browser and in-house databases. Variant annotation and functional prediction was performed with Annovar version 2011 Dec20, dbNSFP version light 1.3 and snpEff version 2.0.5d75. Unreported and rare coding variants were selected and subsequently filtered for various inheritance models (de novo, autosomal recessive, compound heterozygous and X-linked). The population frequency cut off was 1%, 0.1%, 2% and 1% for autosomal recessive, de novo, compound heterozygous and X-linked inheritance models, respectively. The mutation in VPS15 was confirmed by Sanger sequencing. This investigation was approved by the First Faculty of Medicine of the Charles University, Prague, Czech Republic. Informed consent was obtained from the family.
Statistics
All statistical analysis was executed in GraphPad Prism software package (v7.0c). For analysis of histological, western blot, cellular and behavioral data we performed either one-way ANOVA, two-way ANOVA, or t tests with post hoc comparisons (for example, Tukey tests). For analysis of our EGFR degradation assay, birthdate labeling experiments and rotarod results, we performed repeated-measures ANOVA with post hoc corrections. Datasets were checked for normality by Shapiro–Wilk tests. Where datasets were nonparametric transformations, Mann-Whitney or Kruskal–Wallis tests were applied. The statistical test applied for each experiment and the results obtained are shown in Supplementary Table 1. No statistical methods were used to predetermine sample sizes for our histological, behavioral and cellular experiments, but our sample sizes are similar to those reported in previous publications7,39,52,71. Samples and animals were not subject to randomization, but were assigned to experimental groups based on their genotype. In addition see the Life Sciences Reporting Summary.
Accession numbers
European Nucleotide Archive: ERS017958.
Life Sciences Reporting Summary
Further information on experimental design is available in the Life Sciences Reporting Summary.
Data availability
The data that support the findings of this study are available from the corresponding author upon reasonable request, with the exception of the human genetic data, which is subject to patient confidentiality. Whole-exome sequencing data of the Mbe/Mbe mouse has been archived by the Wellcome Trust Sanger Institute with accession code ERP000467 (http://www.sanger.ac.uk/datasharing/).
Supplementary Material
Acknowledgments
We thank the family for the donation of the genetic and biological material. We also acknowledge the input of P. Potter and S. Wells from the mutagenesis program at MRC Harwell and the MRC funding that underpinned it (MC U142684172). We are indebted to R. Williams for modeling the VPS15 human mutation. We also thank the transgenic, bio-optics, proteomic and graphics services groups at the IMP/IMBA. We thank The National Center for Medical Genomics (LM2015091) for providing allelic frequencies in ethnically matched populations (project CZ.02.1.01/0.0/0.0/16_013/0001634). We thank Boehringer Ingelheim and the FWF for funding this research (D.A.K., I914, P24267). The human studies were funded by the European Community’s 7th Framework Program (FP7/2007-2013). S.K., A.P. and V.S. were supported by institutional programs of Charles University in Prague (UNCE 204011, PROGRES-Q26/LF1 and SVV 260367/2017). We acknowledge grants 15-28208A and RVO-VFN 64165 from the Ministry of Health of the Czech Republic and the project LQ1604 NPU II from the Ministry of Education.
Footnotes
Author contributions
A.E., J.F. and D.A.K. performed the phenotypic screen and genetic mapping. T.M.K. and D.J.A. did the whole-exome sequencing on the Marble mouse. T.G., G.R. and T.Hochstoeger analyzed the expression of Vps15. T.G., I.L., M.B., S.P.-C., A.H.H., R.T. and L.L. were responsible for the characterization of the Marble and KO mouse lines. K.M. and G.D. undertook the mass spectroscopy experiments. M.R. and T.G. performed the in utero electroporation analysis. A.P., T.Honzik, M.G., S.B., E.S., S.K., V.S. and I.G. collated the clinical data and performed whole-exome sequencing and analysis of the L1224R patient. T.G. performed the functional experiments. A.K.T., T.G. and J.Z. designed and performed the lentiviral rescue experiment. T.G. and D.A.K. wrote the manuscript and all authors commented on it.
Competing interests
The authors declare no competing financial interests.
Supplementary information is available for this paper at https://doi.org/10.1038/s41593-017-0053-5.
Publisher’s note: Springer Nature remains neutral with regard to jurisdictional claims in published maps and institutional affiliations
References
- 1.Ayala R, Shu T, Tsai LH. Trekking across the brain: the journey of neuronal migration. Cell. 2007;128:29–43. doi: 10.1016/j.cell.2006.12.021. [DOI] [PubMed] [Google Scholar]
- 2.Noctor SC, Flint AC, Weissman TA, Dammerman RS, Kriegstein AR. Neurons derived from radial glial cells establish radial units in neocortex. Nature. 2001;409:714–720. doi: 10.1038/35055553. [DOI] [PubMed] [Google Scholar]
- 3.Heng JI, Chariot A, Nguyen L. Molecular layers underlying cytoskeletal remodelling during cortical development. Trends Neurosci. 2010;33:38–47. doi: 10.1016/j.tins.2009.09.003. [DOI] [PubMed] [Google Scholar]
- 4.Gleeson JG, Walsh CA. Neuronal migration disorders: from genetic diseases to developmental mechanisms. Trends Neurosci. 2000;23:352–359. doi: 10.1016/s0166-2236(00)01607-6. [DOI] [PubMed] [Google Scholar]
- 5.DArcangelo G, et al. A protein related to extracellular matrix proteins deleted in the mouse mutant reeler. Nature. 1995;374:719–723. doi: 10.1038/374719a0. [DOI] [PubMed] [Google Scholar]
- 6.Sheldon M, et al. Scrambler and yotari disrupt the disabled gene and produce a reeler-like phenotype in mice. Nature. 1997;389:730–733. doi: 10.1038/39601. [DOI] [PubMed] [Google Scholar]
- 7.Keays DA, et al. Mutations in alpha-tubulin cause abnormal neuronal migration in mice and lissencephaly in humans. Cell. 2007;128:45–57. doi: 10.1016/j.cell.2006.12.017. [DOI] [PMC free article] [PubMed] [Google Scholar]
- 8.Chae T, et al. Mice lacking p35, a neuronal specific activator of Cdk5, display cortical lamination defects, seizures, and adult lethality. Neuron. 1997;18:29–42. doi: 10.1016/s0896-6273(01)80044-1. [DOI] [PubMed] [Google Scholar]
- 9.Dhavan R, Tsai LH. A decade of CDK5. Nat Rev Mol Cell Biol. 2001;2:749–759. doi: 10.1038/35096019. [DOI] [PubMed] [Google Scholar]
- 10.Keays DA, Clark TG, Flint J. Estimating the number of coding mutations in genotypic- and phenotypic-driven N-ethyl-N-nitrosourea (ENU) screens. Mamm Genome. 2006;17:230–238. doi: 10.1007/s00335-005-0101-4. [DOI] [PubMed] [Google Scholar]
- 11.Corbo JC, et al. Doublecortin is required in mice for lamination of the hippocampus but not the neocortex. J Neurosci. 2002;22:7548–7557. doi: 10.1523/JNEUROSCI.22-17-07548.2002. [DOI] [PMC free article] [PubMed] [Google Scholar]
- 12.Hirotsune S, et al. Graded reduction of Pafah1b1 (Lis1) activity results in neuronal migration defects and early embryonic lethality. Nat Genet. 1998;19:333–339. doi: 10.1038/1221. [DOI] [PubMed] [Google Scholar]
- 13.Stack JH, Herman PK, Schu PV, Emr SD. A membrane-associated complex containing the Vps15 protein kinase and the Vps34 PI 3-kinase is essential for protein sorting to the yeast lysosome-like vacuole. EMBO J. 1993;12:2195–2204. doi: 10.1002/j.1460-2075.1993.tb05867.x. [DOI] [PMC free article] [PubMed] [Google Scholar]
- 14.Stein MP, Feng Y, Cooper KL, Welford AM, Wandinger-Ness A. Human VPS34 and p150 are Rab7 interacting partners. Traffic. 2003;4:754–771. doi: 10.1034/j.1600-0854.2003.00133.x. [DOI] [PubMed] [Google Scholar]
- 15.Sun Q, Westphal W, Wong KN, Tan I, Zhong Q. Rubicon controls endosome maturation as a Rab7 effector. Proc Natl Acad Sci USA. 2010;107:19338–19343. doi: 10.1073/pnas.1010554107. [DOI] [PMC free article] [PubMed] [Google Scholar]
- 16.Ruas M, et al. TPC1 has two variant isoforms, and their removal has different effects on endo-lysosomal functions compared to loss of TPC2. Mol Cell Biol. 2014;34:3981–3992. doi: 10.1128/MCB.00113-14. [DOI] [PMC free article] [PubMed] [Google Scholar]
- 17.Tanida I, Ueno T, Kominami E. LC3 and autophagy. Methods Mol Biol. 2008;445:77–88. doi: 10.1007/978-1-59745-157-4_4. [DOI] [PubMed] [Google Scholar]
- 18.Hara T, et al. Suppression of basal autophagy in neural cells causes neurodegenerative disease in mice. Nature. 2006;441:885–889. doi: 10.1038/nature04724. [DOI] [PubMed] [Google Scholar]
- 19.Schwämmle V, León IR, Jensen ON. Assessment and improvement of statistical tools for comparative proteomics analysis of sparse data sets with few experimental replicates. J Proteome Res. 2013;12:3874–3883. doi: 10.1021/pr400045u. [DOI] [PubMed] [Google Scholar]
- 20.Lim KP, Hong W. Human Nischarin/imidazoline receptor antisera-selected protein is targeted to the endosomes by a combined action of a PX domain and a coiled-coil region. J Biol Chem. 2004;279:54770–54782. doi: 10.1074/jbc.M411315200. [DOI] [PubMed] [Google Scholar]
- 21.Alahari SK, Reddig PJ, Juliano RL. The integrin-binding protein Nischarin regulates cell migration by inhibiting PAK. EMBO J. 2004;23:2777–2788. doi: 10.1038/sj.emboj.7600291. [DOI] [PMC free article] [PubMed] [Google Scholar]
- 22.Seress L, Gulyas AI, Freund TF. Pyramidal neurons are immunoreactive for calbindin D28k in the CA1 subfield of the human hippocampus. Neurosci Lett. 1992;138:257–260. doi: 10.1016/0304-3940(92)90928-z. [DOI] [PubMed] [Google Scholar]
- 23.Nemazanyy I, et al. Defects of Vps15 in skeletal muscles lead to autophagic vacuolar myopathy and lysosomal disease. EMBO Mol Med. 2013;5:870–890. doi: 10.1002/emmm.201202057. [DOI] [PMC free article] [PubMed] [Google Scholar]
- 24.Gorski JA, et al. Cortical excitatory neurons and glia, but not GABAergic neurons, are produced in the Emx1-expressing lineage. J Neurosci. 2002;22:6309–6314. doi: 10.1523/JNEUROSCI.22-15-06309.2002. [DOI] [PMC free article] [PubMed] [Google Scholar]
- 25.Goebbels S, et al. Genetic targeting of principal neurons in neocortex and hippocampus of NEX-Cre mice. Genesis. 2006;44:611–621. doi: 10.1002/dvg.20256. [DOI] [PubMed] [Google Scholar]
- 26.Akizu N, et al. Biallelic mutations in SNX14 cause a syndromic form of cerebellar atrophy and lysosome-autophagosome dysfunction. Nat Genet. 2015;47:528–534. doi: 10.1038/ng.3256. [DOI] [PMC free article] [PubMed] [Google Scholar]
- 27.Sobreira N, Schiettecatte F, Valle D, Hamosh A. GeneMatcher: a matching tool for connecting investigators with an interest in the same gene. Hum Mutat. 2015;36:928–930. doi: 10.1002/humu.22844. [DOI] [PMC free article] [PubMed] [Google Scholar]
- 28.Rostislavleva K, et al. Structure and flexibility of the endosomal Vps34 complex reveals the basis of its function on membranes. Science. 2015;350:aac7365. doi: 10.1126/science.aac7365. [DOI] [PMC free article] [PubMed] [Google Scholar]
- 29.Vadlamudi RK, et al. p21-activated kinase 1 regulates microtubule dynamics by phosphorylating tubulin cofactor B. Mol Cell Biol. 2005;25:3726–3736. doi: 10.1128/MCB.25.9.3726-3736.2005. [DOI] [PMC free article] [PubMed] [Google Scholar]
- 30.Arber S, et al. Regulation of actin dynamics through phosphorylation of cofilin by LIM-kinase. Nature. 1998;393:805–809. doi: 10.1038/31729. [DOI] [PubMed] [Google Scholar]
- 31.Ding Y, Milosavljevic T, Alahari SK. Nischarin inhibits LIM kinase to regulate cofilin phosphorylation and cell invasion. Mol Cell Biol. 2008;28:3742–3756. doi: 10.1128/MCB.01832-07. [DOI] [PMC free article] [PubMed] [Google Scholar]
- 32.Chai X, Förster E, Zhao S, Bock HH, Frotscher M. Reelin stabilizes the actin cytoskeleton of neuronal processes by inducing n-cofilin phosphorylation at serine3. J Neurosci. 2009;29:288–299. doi: 10.1523/JNEUROSCI.2934-08.2009. [DOI] [PMC free article] [PubMed] [Google Scholar]
- 33.Schmid RS, et al. alpha3beta1 integrin modulates neuronal migration and placement during early stages of cerebral cortical development. Development. 2004;131:6023–6031. doi: 10.1242/dev.01532. [DOI] [PubMed] [Google Scholar]
- 34.Waugh MG. PIPs in neurological diseases. Biochim Biophys Acta. 2015;1851:1066–1082. doi: 10.1016/j.bbalip.2015.02.002. [DOI] [PubMed] [Google Scholar]
- 35.Rivière JB, et al. De novo germline and postzygotic mutations in AKT3, PIK3R2 and PIK3CA cause a spectrum of related megalencephaly syndromes. Nat Genet. 2012;44:934–940. doi: 10.1038/ng.2331. [DOI] [PMC free article] [PubMed] [Google Scholar]
- 36.Mirzaa GM, et al. Characterisation of mutations of the phosphoinositide-3-kinase regulatory subunit, PIK3R2, in perisylvian polymicrogyria: a next-generation sequencing study. Lancet Neurol. 2015;14:1182–1195. doi: 10.1016/S1474-4422(15)00278-1. [DOI] [PMC free article] [PubMed] [Google Scholar]
- 37.Stopkova P, et al. Identification of PIK3C3 promoter variant associated with bipolar disorder and schizophrenia. Biol Psychiatry. 2004;55:981–988. doi: 10.1016/j.biopsych.2004.01.014. [DOI] [PubMed] [Google Scholar]
- 38.Li H, Durbin R. Fast and accurate short read alignment with BurrowsWheeler transform. Bioinformatics. 2009;25:1754–1760. doi: 10.1093/bioinformatics/btp324. [DOI] [PMC free article] [PubMed] [Google Scholar]
- 39.Bejarano E, et al. Connexins modulate autophagosome biogenesis. Nat Cell Biol. 2014;16:401–414. doi: 10.1038/ncb2934. [DOI] [PMC free article] [PubMed] [Google Scholar]
- 40.Dull T, et al. A third-generation lentivirus vector with a conditional packaging system. J Virol. 1998;72:8463–8471. doi: 10.1128/jvi.72.11.8463-8471.1998. [DOI] [PMC free article] [PubMed] [Google Scholar]
- 41.Sun T, et al. Acetylation of Beclin 1 inhibits autophagosome maturation and promotes tumour growth. Nat Commun. 2015;6:7215. doi: 10.1038/ncomms8215. [DOI] [PMC free article] [PubMed] [Google Scholar]
- 42.Feng W, et al. Dissection of autophagy in human platelets. Autophagy. 2014;10:642–651. doi: 10.4161/auto.27832. [DOI] [PMC free article] [PubMed] [Google Scholar]
- 43.Ma Y, et al. Toll-like receptor (TLR) 2 and TLR4 differentially regulate doxorubicin induced cardiomyopathy in mice. PLoS ONE. 2012;7:e40763. doi: 10.1371/journal.pone.0040763. [DOI] [PMC free article] [PubMed] [Google Scholar]
- 44.Lee H, et al. Pathological roles of the VEGF/SphK pathway in Niemann-Pick type C neurons. Nat Commun. 2014;5:5514. doi: 10.1038/ncomms6514. [DOI] [PMC free article] [PubMed] [Google Scholar]
- 45.Willy JA, et al. Function of inhibitor of Bruton’s tyrosine kinase isoform α (IBTKα) in nonalcoholic steatohepatitis links autophagy and the unfolded protein response. J Biol Chem. 2017;292:14050–14065. doi: 10.1074/jbc.M117.799304. [DOI] [PMC free article] [PubMed] [Google Scholar]
- 46.Jana NR, Tanaka M, Wang Gh, Nukina N. Polyglutamine length-dependent interaction of Hsp40 and Hsp70 family chaperones with truncated N-terminal huntingtin: their role in suppression of aggregation and cellular toxicity. Hum Mol Genet. 2000;9:2009–2018. doi: 10.1093/hmg/9.13.2009. [DOI] [PubMed] [Google Scholar]
- 47.Santoh M, et al. Acetaminophen induces accumulation of functional rat CYP3A via polyubiquitination dysfunction. Sci Rep. 2016;6:21373. doi: 10.1038/srep21373. [DOI] [PMC free article] [PubMed] [Google Scholar]
- 48.Rinaldi C, et al. Insulinlike growth factor (IGF)-1 administration ameliorates disease manifestations in a mouse model of spinal and bulbar muscular atrophy. Mol Med. 2012;18:1261–1268. doi: 10.2119/molmed.2012.00271. [DOI] [PMC free article] [PubMed] [Google Scholar]
- 49.Walls KC, et al. Lysosome dysfunction triggers Atg7-dependent neural apoptosis. J Biol Chem. 2010;285:10497–10507. doi: 10.1074/jbc.M110.103747. [DOI] [PMC free article] [PubMed] [Google Scholar]
- 50.Bertrand T, et al. Conformations of tissue plasminogen activator (tPA) orchestrate neuronal survival by a crosstalk between EGFR and NMDAR. Cell Death Dis. 2015;6:e1924. doi: 10.1038/cddis.2015.296. [DOI] [PMC free article] [PubMed] [Google Scholar]
- 51.Li S, Leshchyns’ka I, Chernyshova Y, Schachner M, Sytnyk V. The neural cell adhesion molecule (NCAM) associates with and signals through p21-activated kinase 1 (Pak1) J Neurosci. 2013;33:790–803. doi: 10.1523/JNEUROSCI.1238-12.2013. [DOI] [PMC free article] [PubMed] [Google Scholar]
- 52.Breuss M, et al. Mutations in the β-tubulin gene TUBB5 cause microcephaly with structural brain abnormalities. Cell Rep. 2012;2:1554–1562. doi: 10.1016/j.celrep.2012.11.017. [DOI] [PMC free article] [PubMed] [Google Scholar]
- 53.Vandesompele J, et al. Accurate normalization of real-time quantitative RT-PCR data by geometric averaging of multiple internal control genes. Genome Biol. 2002;3:H0034. doi: 10.1186/gb-2002-3-7-research0034. [DOI] [PMC free article] [PubMed] [Google Scholar]
- 54.Boda E, Pini A, Hoxha E, Parolisi R, Tempia F. Selection of reference genes for quantitative real-time RT-PCR studies in mouse brain. J Mol Neurosci. 2009;37:238–253. doi: 10.1007/s12031-008-9128-9. [DOI] [PubMed] [Google Scholar]
- 55.Pichler P, et al. Peptide labeling with isobaric tags yields higher identification rates using iTRAQ 4-plex compared to TMT 6-plex and iTRAQ 8-plex on LTQ Orbitrap. Anal Chem. 2010;82:6549–6558. doi: 10.1021/ac100890k. [DOI] [PMC free article] [PubMed] [Google Scholar]
- 56.Kita Y, Kawakami K, Takahashi Y, Murakami F. Development of cerebellar neurons and glias revealed by in utero electroporation: Golgi-like labeling of cerebellar neurons and glias. PLoS ONE. 2013;8:e70091. doi: 10.1371/journal.pone.0070091. [DOI] [PMC free article] [PubMed] [Google Scholar]
- 57.Chu YY, et al. Astrocytic CCAAT/enhancer binding protein delta regulates neuronal viability and spatial learning ability via miR-135a. Mol Neurobiol. 2016;53:4173–4188. doi: 10.1007/s12035-015-9359-z. [DOI] [PMC free article] [PubMed] [Google Scholar]
- 58.Navarro-Quiroga I, Hernandez-Valdes M, Lin SL, Naegele JR. Postnatal cellular contributions of the hippocampus subventricular zone to the dentate gyrus, corpus callosum, fimbria, and cerebral cortex. J Comp Neurol. 2006;497:833–845. doi: 10.1002/cne.21037. [DOI] [PubMed] [Google Scholar]
- 59.Vasistha NA, et al. Cortical and clonal contribution of Tbr2 expressing progenitors in the developing mouse brain. Cereb Cortex. 2015;25:3290–3302. doi: 10.1093/cercor/bhu125. [DOI] [PMC free article] [PubMed] [Google Scholar]
- 60.Boekhoorn K, et al. Doublecortin (DCX) and doublecortin-like (DCL) are differentially expressed in the early but not late stages of murine neocortical development. J Comp Neurol. 2008;507:1639–1652. doi: 10.1002/cne.21646. [DOI] [PubMed] [Google Scholar]
- 61.Hendzel MJ, et al. Mitosis-specific phosphorylation of histone H3 initiates primarily within pericentromeric heterochromatin during G2 and spreads in an ordered fashion coincident with mitotic chromosome condensation. Chromosoma. 1997;106:348–360. doi: 10.1007/s004120050256. [DOI] [PubMed] [Google Scholar]
- 62.Shah B, et al. C3G/Rapgef1 is required in multipolar neurons for the transition to a bipolar morphology during cortical development. PLoS ONE. 2016;11:e0154174. doi: 10.1371/journal.pone.0154174. [DOI] [PMC free article] [PubMed] [Google Scholar]
- 63.Mullen RJ, Buck CR, Smith AM. NeuN, a neuronal specific nuclear protein in vertebrates. Development. 1992;116:201–211. doi: 10.1242/dev.116.1.201. [DOI] [PubMed] [Google Scholar]
- 64.Nóbrega C, et al. Silencing mutant ataxin-3 rescues motor deficits and neuropathology in Machado-Joseph disease transgenic mice. PLoS ONE. 2013;8:e52396. doi: 10.1371/journal.pone.0052396. [DOI] [PMC free article] [PubMed] [Google Scholar]
- 65.Keays DA, et al. The role of Tuba1a in adult hippocampal neurogenesis and the formation of the dentate gyrus. Dev Neurosci. 2010;32:268–277. doi: 10.1159/000319663. [DOI] [PubMed] [Google Scholar]
- 66.Castellano B, et al. A double staining technique for simultaneous demonstration of astrocytes and microglia in brain sections and astroglial cell cultures. J Histochem Cytochem. 1991;39:561–568. doi: 10.1177/39.5.1707903. [DOI] [PubMed] [Google Scholar]
- 67.Gonchar Y, Wang Q, Burkhalter A. Multiple distinct subtypes of GABAergic neurons in mouse visual cortex identified by triple immunostaining. Front Neuroanat. 2008;1:3. doi: 10.3389/neuro.05.003.2007. [DOI] [PMC free article] [PubMed] [Google Scholar]
- 68.Gandal MJ, et al. GABAB-mediated rescue of altered excitatory-inhibitory balance, gamma synchrony and behavioral deficits following constitutive NMDAR-hypofunction. Transl Psychiatry. 2012;2:e142. doi: 10.1038/tp.2012.69. [DOI] [PMC free article] [PubMed] [Google Scholar]
- 69.Pillai AG, et al. Dendritic morphology of hippocampal and amygdalar neurons in adolescent mice is resilient to genetic differences in stress reactivity. PLoS ONE. 2012;7:e38971. doi: 10.1371/journal.pone.0038971. [DOI] [PMC free article] [PubMed] [Google Scholar]
- 70.Bas-Orth C, Tan YW, Oliveira AM, Bengtson CP, Bading H. The calmodulin-binding transcription activator CAMTA1 is required for long-term memory formation in mice. Learn Mem. 2016;23:313–321. doi: 10.1101/lm.041111.115. [DOI] [PMC free article] [PubMed] [Google Scholar]
- 71.Oliver PL, Keays DA, Davies KE. Behavioural characterisation of the robotic mouse mutant. Behav Brain Res. 2007;181:239–247. doi: 10.1016/j.bbr.2007.04.012. [DOI] [PubMed] [Google Scholar]
- 72.Deacon RM, Rawlins JN. T-maze alternation in the rodent. Nat Protoc. 2006;1:7–12. doi: 10.1038/nprot.2006.2. [DOI] [PubMed] [Google Scholar]
- 73.Marco-Sola S, Sammeth M, Guigó R, Ribeca P. The GEM mapper: fast, accurate and versatile alignment by filtration. Nat Methods. 2012;9:1185–1188. doi: 10.1038/nmeth.2221. [DOI] [PubMed] [Google Scholar]
- 74.Derrien T, et al. Fast computation and applications of genome mappability. PLoS ONE. 2012;7:e30377. doi: 10.1371/journal.pone.0030377. [DOI] [PMC free article] [PubMed] [Google Scholar]
- 75.Cingolani P, et al. A program for annotating and predicting the effects of single nucleotide polymorphisms, SnpEff: SNPs in the genome of Drosophila melanogaster strain w1118; iso-2; iso-3. Fly. 2012;6:80–92. doi: 10.4161/fly.19695. [DOI] [PMC free article] [PubMed] [Google Scholar]
Associated Data
This section collects any data citations, data availability statements, or supplementary materials included in this article.
Supplementary Materials
Data Availability Statement
The data that support the findings of this study are available from the corresponding author upon reasonable request, with the exception of the human genetic data, which is subject to patient confidentiality. Whole-exome sequencing data of the Mbe/Mbe mouse has been archived by the Wellcome Trust Sanger Institute with accession code ERP000467 (http://www.sanger.ac.uk/datasharing/).