

Abstract
Consumption of green tea (GT) extracts or purified catechins has shown the ability to prevent oral and other cancers and inhibit cancer progression in rodent models, but the evidence for this in humans is mixed. Working with humans, we sought to understand the source of variable responses to GT by examining its effects on oral epithelium. Lingual epithelial RNA and lingual and gingival microbiota were measured before and after 4 weeks of exposure in tobacco smokers, whom are at high risk of oral cancer. GT consumption had on average inconsistent effects on miRNA expression in the oral epithelium. Only analysis that examined paired miRNAs, showing changed and coordinated expression with GT exposure, provided evidence for a GT effect on miRNAs, identifying miRNAs co-expressed with two hubs, miR-181a-5p and 301a-3p. An examination of the microbiome on cancer prone lingual mucosa, in contrast, showed clear shifts in the relative abundance of Streptococcus and Staphylococcus, and other genera after GT exposure. These data support the idea that tea consumption can consistently change oral bacteria in humans, which may affect carcinogenesis, but argue that GT effects on oral epithelial miRNA expression in humans vary between individuals.
Introduction
Green tea (GT), a beverage consumed throughout the world, contains high amounts of polyphenols, chiefly catechins, chemicals that are believed to play a role in improving health. Epidemiological research shows a possible effect for GT catechins, such as (-)-Epigallocatechin Gallate (EGCG) in the prevention of a number of cancers including lung and oral cancer, though clinical trial analysis has been confusing1–3. In contrast the majority of published studies in rodents provide ample evidence that GT or purified GT catechins show the ability to prevent the formation and progression of induced cancers of the oral cavity, lung, digestive tract, skin, prostate, and breast4–9. Various studies done in cell culture provide explanations for how EGCG or other GT components may alter carcinogenesis. These include assisting in detoxification of carcinogen oxidizing agents, changes in gene expression, induction of cell cycle arrest and apoptosis, anti-inflammatory actions, and inhibition of tumor-associated angiogenesis10, at times working through miRNA intermediaries11. Application of these results to in vivo experiments has been slow12. Plasma and cellular levels of intact catechins are often quite low due to poor uptake by gut epithelium, and the metabolized forms seen at high levels in cells in vivo can differ from what is studied in vitro13–15. There has been little progress in determining how GT changes global gene expression in vivo, information that may inform us on the mechanism of cancer inhibition. A lung cancer induction model in mice has been used to identify gene expression changes related to inflammation and regulation of cell proliferation that occur weeks after EGCG exposure in lung adenoma tissue16. Further analysis of miRNA expression, major regulators of gene expression in cells, in this lung model and a liver model showed changes in miRNAs with EGCG exposure17,18. This correlated well with the decrease in progression of adenomas to carcinoma in the lung tumor model and argues for changes in epithelial gene expression induced by GT exposure. Evidence for changes in RNA expression in humans due to GT is limited19.
Tobacco exposure is a major risk factor for a number of the cancers that epidemiological and rodent studies indicate GT may prevent. Tobacco can induce tumors as a mutagen, though it also causes additional changes in cellular gene expression and the way cells interact with the microenvironment, resulting in cancer20,21. Tobacco-induced changes in mRNA and microRNA in upper airway epithelium are well documented and include changes in xenobiotic metabolism, antioxidant- and inflammation-related genes21–23. Tobacco exposure is thought to prime epithelial cells for a pathway toward transformation, while there is evidence that GT can minimize in vivo effects of smoking, such as DNA adducts and inflammation, and increase DNA repair capability24–28.
Potential oral cavity effects of tea consumption associated with bacteria include reduction in inflammation, decreased periodontal disease and reduced caries29,30. These conditions have been linked to chronic systemic diseases such as cancer and diabetes31. Many studies have shown direct toxicity of GT to assorted oral and gut bacteria during long-term incubation in vitro via membrane damage, prevention of biofilm formation, enzyme poisoning, etc.32,33. Members of the Streptococcus genus tend to be particularly susceptible to GT polyphenol toxicity in vitro as are some species of Staphylococcus though somewhat less so. The concentration range for GT effects on bacteria can vary from 10–1000 µg/ml32,34–36. This is well within the range of GT catechin concentration in undiluted tea (approximately 1 mg/ml at most). There is limited knowledge about selective antibiotic effects of GT consumed on bacteria in vivo and almost all studies were in gut. In vivo bacteria are typically present in biofilms and are therefore likely to be exposed to lower levels of GT-derived compounds. Studies focusing on a limited number of genera, in animals where GT extract or GT polyphenols are added to food at 0.2 to 0.6%, have shown decreases in gut C. Perfringens and other genera and increases in Bifidobacterium and Lactobacilli37–39. A study of humans consuming a tea polyphenol mix (largely of catechins) at the equivalent of 10 cups per day saw reduced C. perfringens and other Clostridium species while Bifidobacterium increased40. A much more recent study with ten subjects consuming 10 cups of GT per day saw an increase in Bifidobacterium41. A study that examined effects of high-level dosage of EGCG plus caffeine over a 12-week period in humans saw no changes in gut microbiota on the phylum level in 30 subjects compared to baseline but did not test for changes on lower classification levels of bacteria42,43. As evidence mounts that the oral cavity is a source of bacteria that play a role in systemic disease, it becomes important to determine if GT consumed at a reasonable level can alter the oral microbiome and thus oral and systemic health.
Soft tissue disease in the oral cavity is often related to tobacco exposure. We hypothesized that GT exposure would result in measurable changes in oral epithelial miRNA expression and oral microbiome in smokers. The detection of such changes is a first step in identifying mechanisms by which GT exposure can affect oral health. We enrolled a group of 16 subjects screened to ensure low baseline catechin and polyphenol levels and no tea exposure. Over a 4-week period the subjects consumed five cups of GT per day, with sampling for oral epithelial miRNA expression and oral microbial community structure analyses done at intervals.
Results
Tobacco users show marked changes in miRNA expression in oral epithelium
16 tobacco-using subjects were enrolled. One dropped out due to scheduling problems. Based on the food frequency questionnaires (FFQs), all showed low level of dietary intake of polyphenol at the start of the study (Table 1). RNA was isolated from the lateral border of the tongue. RNA from the 11 subjects with the highest yield was studied, (4 females, 7 males) 22 to 47 years of age with average age of 35. Control samples from nonsmokers (5 females, 4 males) 28 to 77 years of age, were also largely from the lateral border of the tongue, though two samples were from keratinized gingiva44. A comparison of miRNA expression between the two groups revealed many differences in the smoker group even in normal appearing tissue. Tobacco exposure is associated with marked differences in epithelial gene and miRNA expression45,46, and that was what was observed. Comparison to an earlier study on bronchial epithelium revealed that of 12 miRNAs detectable in both studies, 3 showed the same statistically validated differences in oral epithelium with tobacco smoke exposure, miR-126-3p, miR-133a-3p, and miR-193-3p22 (Table 2). That the miRNA changes were substantial in tobacco smoke exposed lateral border of the tongue was corroborated by the fact that nonsupervised clustering of the samples47 correctly sorted them into smoker and nonsmoker samples with 100% accuracy (Supplementary Fig. S1).
Table 1.
Demographics and usual dietary intakes of 15 enrolled participants who completed the study.
| Characteristics | Total Sample N = 15 | Women (n = 6) | Men (n = 9) |
|---|---|---|---|
| Age (y) | 31.3 ± 7.3 | 31.2 ± 6.4 | 31.4 ± 8.0 |
| BMI (kg/m2) | 25.5 ± 5.2 | 28.2 ± 8.1 | 24.0 ± 2.1 |
| Reported Activity levels (%) | |||
| Low active/sedentary | 65 | 100 | 45.4 |
| Active/very active | 35 | 0 | 54.5 |
| Multivitamin Supplement use (%) baseline- | 47.1 | 33.3 | 54.5 |
| Daily Food Intakes | |||
| Energy | 2568 (1789, 3332) | 1789 (1353, 2234) | 3186 (2101, 3643) |
| Dietary fiber, g/1000 kcal | 8.6 (5.7, 9.2) | 7.3 (5.3, 9.5) | 8.8 (5.9, 9.2) |
| Fruit (svgs) | 0.5 (0.2, 0.8) | 0.2 (0.0, 0.7) | 0.8 (0.2, 0.8) |
| Vegetables (svgs) | 0.5 (0.2, 1.5) | 0.2 (0.0, 1.2) | 0.5 (0.2, 2.0) |
| Whole Grains (svgs) | 0.5 (0.1, 1.5) | 0.1 (0.2, 2.3) | 0.7 (0.2, 1.4) |
| Low Fat Dairy (svgs) | 0.2 (0.0, 0.8) | 0.1(0.0, 0.6) | 0.2 (0.1, 1.3) |
| Sweets (svgs) | 1.0 (0.5, 1.3) | 1.2 ((0.6, 2.2) | 0.8 (0.3, 1.1) |
| Alcohol (% energy) | 6.7 (2.7, 16.1) | 3.3 (0.0, 22.0) | 7.1 (4.4, 15.5) |
| HEI 2010 score | 55.2 (50.5, 63.6) | 56.8 (46.2, 64.4) | 55.2 (50.4, 64.9) |
| Total Polyphenols (mg) | 2.1 (0.6, 14.5) | 1.3 (0.2, 5.8) | 6.7 (0.8, 27.0) |
| (mg/1000 kcal) | 1.1 (0.3, 6.9) | 0.7 (0.2, 2.8) | 2.7 (0.2, 7.4) |
BMI: Body mass index; HEI 2010 Score: Healthy Eating Index 2010 score developed by the USDA1 to assess overall dietary quality with scores that range from 0 to 100, where 100 reflect optimal dietary quality97.
Table 2.
Top miRNAs significantly up- and down-regulated in smokers vs never smokers FDR < 0.05.
| Unique ID | Parametric p-value | FDR | Fold-change1 |
|---|---|---|---|
| hsa-miR-185-5p | <1e-07 | <1e-07 | 0.12 |
| hsa-miR-31-5p | 3.00E-06 | 0.000309 | 9.02 |
| hsa-miR-133a-3p | 8.00E-06 | 0.000549 | 51.27 |
| hsa-miR-629-5p | 3.71E-05 | 0.00171 | 3.19 |
| hsa-miR-215-5p | 4.15E-05 | 0.00171 | 2.32 |
| hsa-miR-155-5p | 5.01E-05 | 0.00172 | 0.26 |
| hsa-miR-134-5p | 6.27E-05 | 0.00185 | 5.66 |
| hsa-miR-212-3p | 0.0001077 | 0.00221 | 4.35 |
| hsa-miR-34b-3p | 0.0001095 | 0.00221 | 3.36 |
| hsa-miR-34c-3p | 0.0001128 | 0.00221 | 5.97 |
| hsa-miR-19b-3p | 0.0001178 | 0.00221 | 0.51 |
| hsa-miR-181b-5p | 0.0001344 | 0.0023 | 0.33 |
| hsa-miR-502-5p | 0.0001577 | 0.0025 | 8.52 |
| hsa-miR-361-5p | 0.0001717 | 0.00253 | 2.07 |
| hsa-miR-132-3p | 0.0004769 | 0.00655 | 2.29 |
| hsa-miR-324-5p | 0.0005343 | 0.00688 | 0.48 |
| hsa-miR-197-3p | 0.0005722 | 0.00693 | 2.6 |
| hsa-miR-192-5p | 0.000799 | 0.00866 | 2.08 |
| hsa-miR-126-5p | 0.000872 | 0.00898 | 7.7 |
1Fold change of 1 is no change.
miRNA in lingual mucosa in tobacco users before and after GT exposure
Brush biopsy at the end of 4 weeks of tea consumption was used to harvest lingual epithelium from the lateral border of the tongue. An analysis of the expression level of 372 miRNAS revealed no average changes rose to the false discovery rate, FDR, of 0.1 and few even had uncorrected p values below 0.05. (Table 3, Supplementary Fig. S2).
Table 3.
No miRNAs were significantly up- or down-regulated after 4 weeks of GT consumption. p < 0.05.
| Unique ID | Parametric p-value | FDR | Fold-change1 |
|---|---|---|---|
| hsa-miR-326 | 0.0245 | 0.981 | 0.54 |
| hsa-miR-187-3p | 0.0338 | 0.981 | 0.25 |
1Fold change of 1 is no change.
Analysis of GT effects on coordinated miRNA expression in the oral epithelium
Rather than measuring mean changes in miRNA levels before and after GT exposure, a combined measure of differential gene expression and co-expression of miRNA pairs was done to identify co-expressed miRNAs that changed in level with GT exposure (see methods section). This analysis revealed 15 pairs of miRNAs that were co-expressed with GT exposure that also showed significance at FDR 0.01 using the Stouffer combined Z-score (Table 4). Of the 15 pairs, including 18 miRNAs, mir-181a-5p and mir-301a-3p formed hubs co-expressed with 7 and 3 other miRNAs, respectively (Supplementary Fig. S3). mRNA targets of these two groups of miRNAs were identified using Tarbase48,49. miRPath was then used with the group of mRNAs targeted by miR-181a-5p, miR-150-5p, miR-145-5p, miR-425, miR199b-5p, miR-328-3p, miR-766-3p, and miR-142-3p to identify a list of enriched mRNA-associated pathways, identified at p < 0.0001 of statistical significance. Any pathways that appeared at the same or higher significance when examining 40 groups of 8 random miRNAs were omitted. The Kyoto Encyclopedia of Genes and Genomes (KEGG) pathways, estrogen receptor signaling pathway hsa0915, central carbon metabolism in cancer, hsa05230, signaling pathways regulating pluripotency of stem cells, hsa04550 were highly associated with the miR-181a-5p hub miRNAs. The second group, of miR-301a-3p, miR-30e-3p, miR-182-5p, and miR-30e-5p showed no pathway that was not also identified using random lists of 4 miRNAs and miRPath.
Table 4.
miRNAs pairs that are co-expressed and show evidence for differential expression by 4 weeks of GT consumption.
| miRNA | miRNA2 | P_DE (miRNA1) | P_DE (miRNA2) | CC | P_CC | Min_ttest_pval | Stoufer Zscore | pval_Zscore | FDR_Zscore |
|---|---|---|---|---|---|---|---|---|---|
| hsa-miR-328-3p | hsa-miR-181a-5p | 3.61E-01 | 4.67E-02 | 7.74E-01 | 1.18E-05 | 4.67E-02 | 4.28 | 9.28E-06 | 7.21E-03 |
| hsa-miR-199b-5p | hsa-miR-181a-5p | 4.90E-01 | 4.67E-02 | 8.44E-01 | 3.94E-07 | 4.67E-02 | 4.73 | 1.14E-06 | 2.43E-03 |
| hsa-miR-378a-3p | hsa-miR-375 | 3.07E-02 | 6.70E-02 | 6.93E-01 | 1.76E-04 | 3.07E-02 | 4.29 | 8.78-06 | 7.15E-03 |
| hsa-miR-425-5p | hsa-miR-181a-5p | 2.11E-01 | 4.67E-02 | 8.19E-01 | 1.55E-06 | 4.67E-02 | 4.82 | 7.16E-07 | 1.75E-03 |
| hsa-miR-423-3p | hsa-miR-484 | 8.03E-02 | 2.53E-02 | 6.84E-01 | 2.25E-04 | 2.53E-02 | 4.24 | 1.14E-05 | 8.27E-03 |
| hsa-miR-301a-3p | hsa-miR-30e-5p | 4.29E-02 | 5.24E-01 | 7.94E-01 | 5.04E-06 | 4.29E-02 | 4.28 | 9.23E-06 | 7.21E-03 |
| hsa-miR-301a-3p | hsa-miR-30e-3p | 4.29E-02 | 3.61E-01 | 8 > 86E-01 | 2.08E-08 | 4.29E-02 | 5.32 | 5.07E-08 | 3.47E-04 |
| hsa-miR-301a-3p | hsa-miR-182-5p | 4.29E-02 | 2.78E-01 | 8.55E-01 | 1.95E-07 | 4.29E-02 | 5.08 | 1.85E-07 | 7.94E-04 |
| hsa-miR-150-5p | hsa-miR-181a-5p | 4.09E-01 | 4.67E-02 | 7 > 71E-01 | 1.35E-05 | 4.67E-02 | 4.21 | 1.30E-05 | 9.06E-03 |
| hsa-miR-145-5p | hsa-miR-181a-5p | 1.87E-01 | 4.67E-02 | 7.88E-01 | 6.76E-06 | 4.67E-02 | 4.60 | 2.11E-06 | 3.79E-03 |
| hsa-miR-145-5p | hsa-miR-766-3p | 1.87E-01 | 4.47E-02 | 7.22E-01 | 7.38E-05 | 4.47E-02 | 4.16 | 1.62E-05 | 9.92E-03 |
| hsa-miR-181a-5p | hsa-miR-766-3p | 4.67E-02 | 4.47E-02 | 7.15E-01 | 9.10E-05 | 4.47E-02 | 4.43 | 4.62E-06 | 4.60E-03 |
| hsa-miR-181a-5p | hsa-miR-142-3p | 4.67E-02 | 1.30E-01 | 7 > 70E-01 | 1.41E-05 | 4.67E-02 | 4.56 | 2.52E-06 | 3.87E-03 |
| hsa-miR-766-3p | hsa-miR-142-3p | 4.47E-02 | 1.30E-01 | 7.53E-01 | 2.65E-05 | 4.47E-02 | 4.45 | 4.23E-06 | 4.52E-03 |
| hsa-miR-340-5p | hsa-miR-410-3p | 1.27E-01 | 2.86E-02 | −8.12E-01 | 2.27E-06 | 2.86E-02 | 4.99 | 3.08E-07 | 9.59E-04 |
p DE miRNA is p value of student t test of specific miRNA level at baseline, 0 weeks, compared to that after 4 weeks of GT consumption
CC is Spearman rank correlation of expression between the miRNA1 and miRNA2
Z Stouffer calculated by weighted sum of z-values assigned to p DE(mRNA1), p DE(mRNA2), and p CC.
Changes in oral mucosal bacteria with GT consumption
Twelve subjects (6 females, 6 males, 26–48 years of age, average age 35) were subjected to oral swabbing of the lateral border of tongue and gingival mucosa. Ten subjects provided samples through the whole trial, while two had microbes collected only after the first week. On average for tongue samples there were 32,933 reads after chimeric removal per sample when we sequenced the 16S rRNA hypervariable region, with counts ranging from 14,927 to 48,270. For keratinized gingiva, there were 40,516 average, ranging from 16,254 to 80,508.
Effect of GT on oral microbiome
In vitro GT polyphenols can kill a large range of bacteria types, while some are resistant. Quantitation of the level of total bacteria 16s rRNA genes in each sample measured by qPCR before and after tea consumption provides an estimate of total bacteria content in samples. This was done for lingual samples and showed normalized levels of total bacteria 16s rDNA at 1.0 ± 0.34 week 0 and 0.80 ± 0.32 week 4, t < 0.55 by Student’s t-test. NGS sequencing of the same samples and QIIME based matching to known OTUs allowed quantitation of relative amounts of each OTU in each sample. Analysis of Alpha diversity by computing the Shannon Diversity Index revealed no difference in the richness or distribution of the bacterial genera on lingual or gingival surfaces in subjects at baseline versus after 2 and 4 weeks of GT exposure (Fig. 1). Together these findings suggest that GT as a diet component did not act as a broad-spectrum antibiotic.
Figure 1.

Shannon’s Diversity Index at the genus level for the different sites at baseline and after 2 and 4 weeks of 5× per day GT consumption did not differ. (a) Samples from lateral border of the tongue. (b) Samples from keratinized gingiva.
Beta diversity comparisons allow us to examine differences overall in the identity of the bacteria on each surface before and after GT exposure. This tested if GT exposure, directly or indirectly, can causes change in the microenvironment that affects the selection process on these two oral mucosal surfaces thus changing the identities of taxa that are found. Non-metric multidimensional scaling (NMDS) was used to make these comparisons and revealed that overall the exposure to GT did not make large changes in the pattern of genera in the baseline versus post 4-weeks GT exposure at either site (Supplementary Fig. S4).
An examination of only the major constituents of the microbiome before and during GT exposure on the two mucosal surfaces is shown in Fig. 2. The only discernable change is that in lingual tissue there is a decrease in Streptococcus during GT exposure (Fig. 3). More informative is a representation of the differences in all taxa present in Fig. 2C and D. We found significant differences in total abundance of a number of genera or subset of families when comparing values after 4 weeks of GT exposure to those from baseline using White’s nonparametric test and Storey’s FDR (p < 0.1) to correct for multiple testing50,51. Some of the taxa detected as differentially abundant were unclassified at the genus level. With the exception of one taxon, all showed consistent changes after 2 and 4 weeks of GT consumption (Fig. 2).
Figure 2.

Taxonomic profiles averaged at baseline and at 2 and 4 weeks after GT exposure for (a) Tongue and (b) keratinized gingiva. We note Streptococcus is the dominant genus. (c and d) Levels of genera and subsets of families that were differentially abundant at 0 vs. 4 weeks of GT exposure are shown for tongue and keratinized gingiva, at FDR < 0.1 Note unclassified samples are subsets of families that were not assigned to a specific genus.
Figure 3.
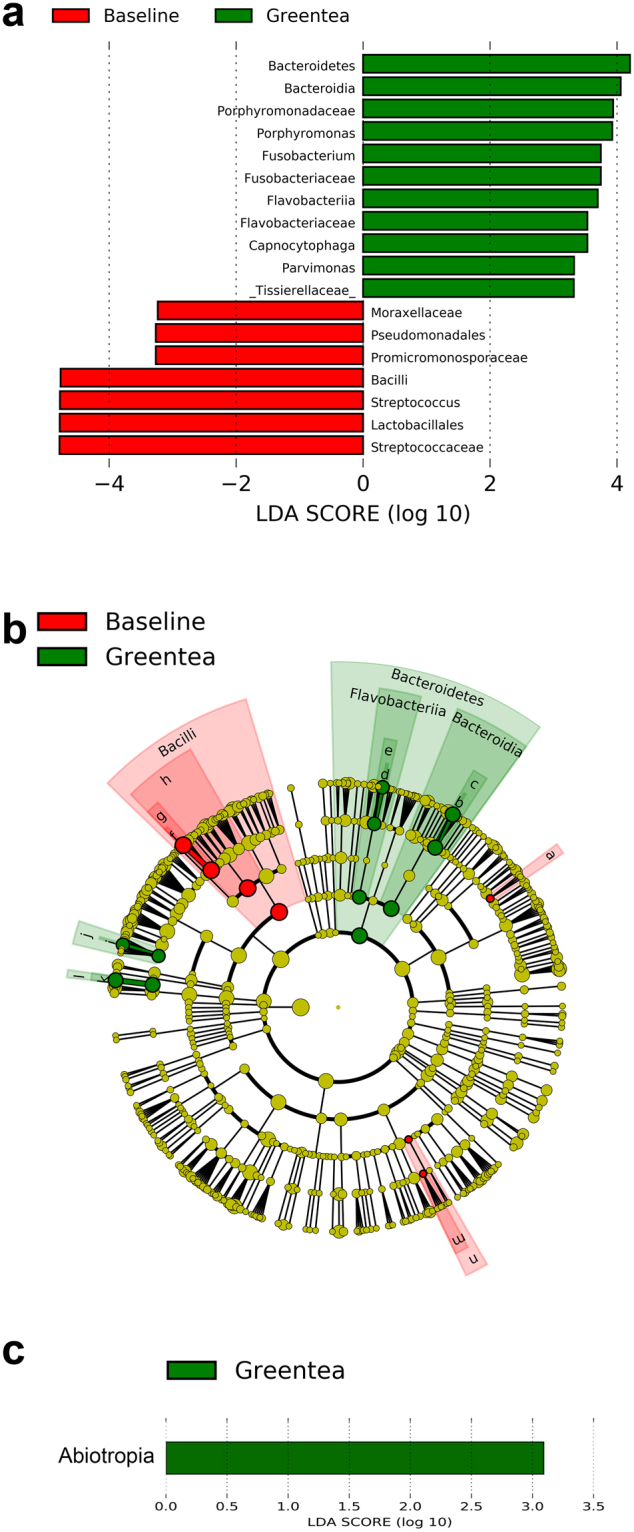
LDA Effect Size (LEfSe) algorithm was used on genus level OTU tables to determine taxa that best characterize the changes in the mucosal microbiome that occur at 0 versus 2 and 4 weeks of GT exposure. (a) Tongue showed decreases in Streptococcus and Lactobacillus among other changes. (b) The cladogram for the taxa that are different in tongue with green tea exposure shows their taxonomic relationships. (c) Keratinized gingiva showed less conclusive changes with only the genus Abiotrophia different at a high level of statistical significance.
To determine the taxa changes most likely biologically relevant to GT exposure, we used linear discriminant analysis of effect size (LEfSe) to determine taxa that were differentially abundant before and after GT exposure comparing the baseline levels versus those at weeks 2 and 4 of GT exposure, which were combined into one group52. An examination of tongue bacteria showed changes in several bacteria groups, including a decrease in the high frequency genus Streptococcus on the lateral border of the tongue, while several taxon units at low levels at that site were shown to increase (Fig. 3). This method to highlight biologically relevant markers only showed one operational taxon unit to change with high statistical significance at the keratinized gingival site with GT consumption.
Discussion
A major goal of this study was to define oral mucosal miRNA expression changes induced by GT exposure, which would shed light on the mode of action of GT on oral mucosal health. miRNA expression changes due to tobacco exposure were measured in oral epithelium. As a positive control miRNA expression in epithelium of the lateral border of the tongue in subjects who had smoked cigarettes over at least 2 years was compared to that of a separate group of never smokers (see Table 2). A large number of differences that were distinct enough to separate the samples based on smoking status with 100% accuracy using nonsupervised clustering were observed (Supplementary Fig. 1)53. Some of the changes were similar to those seen in earlier studies on other epithelium, such as that of the bronchi, including changes in miR-126-3p, miR-133a-3p, and miR-193-3p22. That not more were shared in both studies may be due to differences in the type of mucosa, squamous epithelium versus pseudostratified columnar epithelium or the method of miRNA measurement. This nonsmoker versus smoker comparison, a cross sectional study, showed differences in 19 miRNAs at FDR < 0.01% with several miRNAs showing 5 × differences. A similar statistical analysis revealed no consistent changes at FDR < 0.1 when the same cigarette smokers consumed 5 cups of GT per day over a 4-week period (see Table 3, Supplementary Fig. 3)54. The conclusion is that either GT had little effect on the oral epithelium RNA or that many of the changes were too variable across the group to show consistent differences.
Working on the assumption that some subjects may have oral epithelium that respond more robustly to GT than others, we hypothesized that some miRNAs may be co-regulated and show similar changes in level with GT exposure. Thus, subjects with low or intermediate GT response would not obscure the high level changes seen in the best responders if there was also a focus on maintenance of co-expression. Indeed, 2 hubs with co-regulated miRNAs were identified that show some level of differential expression with GT exposure. Interestingly, one of these hub miRNAs, miR-181a-5p, and the 7 co-expressed miRNAs, target mRNAs associated with the estrogen receptors signaling pathway. GT catechin have been shown to both inhibit or stimulate in a concentration dependent manner, different components of the estrogen receptor signaling pathway including ER alpha itself55 Estrogen receptor and estrogen levels are thought to be important in head and neck SCC outcomes56. The epidermal growth factor receptor is activated during carcinogensis in many head and neck cancers and is thought to be a key driver of that state57. Two additional pathways identified, which may be targeted by the hsa-miR-181a-5p hub, are central carbon metabolism in cancer and signaling pathways regulating pluripotency of stem cells, and are also potentially directly or indirectly regulated by green tea consumption, and may play roles in its OSCC inhibition58,59, but much more work is needed to verify these GT-related miRNA changes and GT effects on the 3 pathways.
Changes in oral mucosal bacteria with GT exposure were clear in our study. Most of the changes, before and after tea exposure, were different at the two mucosal sites tested. Lateral border of the tongue and keratinized gingival epithelium, though both squamous epithelium, have different histological features and indeed showed different adherent microbiomes60. Because biofilms on different mucosal surfaces may depend on different anchor bacteria, it is hard to predict how GT will affect different biofilms. It was not clear if changes in certain genera were directly due to cytotoxicity, changes in bacteria adherence, or effects on other bacteria in the biofilm, etc. Importantly, the time course in Fig. 3 showed similar changes in levels of OTUs at both 2 weeks and 4 weeks of GT exposure, reinforcing the identification of these OTUs as being differentially abundant after GT exposure. While they did not mimic the changes seen in earlier studies on gut, that was not expected, due to all the differences in the gut versus oral environment37–41. GT did not seem to work as a broad-spectrum antibiotic as a reduction in total bacteria and/or a decrease in bacterial diversity was not seen (Fig. 1).
LEfSe analysis, which in part puts the focus on changes in closely related bacteria types, highlighted decreases in Streptococcus after GT exposure52. Streptococcus is a major constituent of lingual and gingival mucosa biofilm so if this change is a common response to GT exposure it has the potential to have large effects on oral mucosa. Staphylococcus, typically at low level in the mouth, was also observed to decrease after GT exposure. Both of these genera have been shown to be elevated in the mouths of tobacco users and oral squamous cell carcinoma patients, so these genera are associated with habits that lead to OSCC and possibly OSCC itself61,62. Tobacco smoke is thought to change oral bacteria by altering oral pH, O2 levels, bacteria adherence properties, host immunity, or oral nutrients62–66. Because Streptococcus and Staphylococcus are associated with tobacco use, one might propose reductions in these bacteria by GT could help inhibit OSCC formation. We note over 13 different Streptococci species were identified in the samples by metagenomic analysis, making it difficult to pinpoint the species affected by GT. Several genera were shown to increase with GT exposure and LEfSe highlighted some of these. Porphymonas gingivalis and Fusobacterium nucleatum are species of interest in OSCC as they are associated with other cancers and our in the oral cavity67,68. Porphyromonas, seen to increase after GT consumption, likely refers to two species KLE1280 and oral taxon 279 and not Porphyromonas gingivalis, which is known to be inhibited by GT extract and was present at 100× -fold lower levels when detectable in the tongue mucosal samples35. The most abundant Fusobacteria was Fusobacterium periodontium, a species not associated with carcinogenesis. Several other Fusobacterium species, including Fusobacterium nucleatum, which has been associated with colorectal cancer and is enriched on OSCC mucosa68–70 were present at much lower levels on the lateral border of the tongue. While GT is directly toxic to Fusobacterium nucleatum in vitro, causing killing and changing adherence71, we do not have measurements of the levels of this particular species after GT exposure in our studies. LEfSe analysis of gingival bacteria was less clear and only one genus showed differential abundance at high probability after 2 and 4 weeks of GT exposure at that site.
As postulated some years ago, GT and other polyphenols may work largely indirectly in the human body72. First, as shown here, they can change oral bacteria, which may change oral and systemic health. Second, it appears GT chemicals, such as the catechins, are much more efficiently absorbed by gut mucosal epithelium, for example, and then transferred to the blood, after metabolism by colonic microbes73,74. These metabolites have higher bioavailability than the parent molecule14,15,75. Metabolism of GT catechins also occurs in the mouth but the process is not well described12,76. One explanation for variable oral epithelial response to GT may be differences in oral bacteria or cells enzymes that metabolize GT to forms that can be absorbed. Our human results stand in contrast to those from Zhou et al. who saw consistent and significant changes in miRNA expression in the lung adenomas of mice given GT extract in their water over 1 week18. We speculate that mice, often genetically identical, housed together on the same diet, would have similar oral and gut bacteria, and would thus respond consistently to GT extract exposure in regard to RNA expression or, in turn, inhibition of epithelial tumor formation.
Care was taken to make sure polyphenol intake of the subjects was unchanged throughout the study, except for the consumption of the GT. An examination of the dietary information shows overall the group consumed minimal levels of polyphenol due to limited fruit and vegetable intake (Table 1). Urine EGCG examination showed variable baseline but increases in urine EGCG in all subjects except one (see Supplementary Table 1). Surprisingly, one subject who consumed tea immediately prior to sample acquisition showed exceptionally high aglycone EGCG in urine at two different times, suggesting very rapid excretion of much of this catechin right after consumption14,77. While the subjects involved in this study did not have an illness, thus minimizing some potential aspects of the placebo effect, it is possible the effects seen were due to the thermal effects of drinking warm water or the reduction of some other component(s) of their diet. Most importantly, very recent clinical work on another proposed neutraceutical, curcumin, has revealed gender specific effects on gene expression in blood monocytes78. Given that in one study that women, and not men, showed a negative correlation between GT consumption and OSCC it will be important to determine if GT has similar gender-specific miRNA expression effects in a study with sufficient numbers of subjects7.
Methods
Subjects
16 smokers (5–15 cigarettes per day during the preceding two years) were recruited. Subjects reported no usage of antibiotics or other medications in the two weeks preceding the study and through the course of the study. At entry all recruits completed a food frequency questionnaire (FFQ) used to estimate usual intakes of polyphenol-rich foods and to determine little or no tea intake in the month before the study (Graphical Vioscreen FFQ, Viocare, Princeton, NJ, USA)79. Nutrient composition analyses of FFQ using Nutrition Data Systems for Research, version 45, (University of Minnesota Nutrition Coordinating Center, Minneapolis, MN, USA) was performed within Viocare software. Additional data on polyphenol content in foods were obtained from the Phenol-Explorer database (www.phenol-explorer.eu)
The subjects were instructed to maintain their initial diet over the study, avoiding changes in fruits, vegetables, and other beverages enriched in polyphenols. After entry into the study, a dietary screener, which contained a checklist of these polyphenol-rich foods and beverages (i.e, wine, tea, coffee, berries, citrus fruits, beans, onions nuts, leafy vegetables, beer, fruits) was administered to all subjects weekly. All subjects provided RNA, the 11 with the highest yield were studied. Twelve subjects supplied oral microbiome samples at various time points.
All subjects in all groups provided oral informed consent for the telephone interview to determine eligibility and then written informed consent to participate in accordance with guidelines of the Office for the Protection of Research Subjects of the University of Illinois at Chicago, the local Institutional Review Board that formally approved of this research. Control nonsmokers used for RNA studies were described in an earlier study (34).
Tea dosage
All subjects were instructed on tea preparation and given 35 tea bags of Bigelow Organic Green Tea, each bag steeped in 1 cup water 1 minute at 80 °C. Subjects were encouraged to allow the tea to cool several minutes prior to drinking. Subjects returned every 7 days and were given tea for the next week and returned all used tea bags. The tea used was selected because it had the higher EGCG level of two brands tested that were available in single lots80.
Measurement of aglycon EGCG in urine
All urine samples were collected at the subjects’ first visit and then at weekly intervals between 10:00 AM and 4:00 PM typically the same time for each subject. Samples were aliquoted and stored at −80 °C with 100 µM ascorbic acid. Liquid chromatography followed by tandem mass spectroscopy was used to separate and analyze levels of EGCG after enzymatic cleavage from glucuronide and sulfate forms80.
RNA analysis
Brush biopsy was used to harvest cells from the lateral border of the tongue of each subject and samples were stored in Trizol at −80 degrees prior to purification of small RNAS using RNeasy chromatography as described earlier. 100 ng RNA was reverse transcribed in 20 ul reactions using the miRCURY LNA Universal RT microRNA PCR, Polyadenylation and cDNA synthesis kit (Exiqon, Woburn, MA, USA) and was assayed once by RT-qPCR on the microRNA Ready-to-Use PCR, Human panel I (Exiqon), which includes 372 miRNA primer sets. Both version V3.M and V4.M panels were used. To compensate for individual miRNA assays that were altered by the manufacturer between versions, batch effect correction was done for all assays using Combat after preliminary normalization of tests within each group81. Negative controls, excluding template from the reverse transcription reaction, were tested and profiled like the samples with individual primer pairs. The amplification was performed in an Applied Biosystems Viia 7 RT-qPCR System (Life Technologies, Carlsbad, CA, USA) in 384 well plates. The amplification curves were analyzed for Ct values using the built-in software, with a single baseline and threshold set manually for each plate (Exiqon).
Microbiota
Mucosal sample collection and analysis
Swab samples taken for microbiome analysis were frozen immediately after collection. Genomic DNA was extracted from swabs using the MasterPure Gram Positive DNA Purification Kit (Epicentre, Madison, WI, USA) according to manufacturer’s instructions.
Quantitation of microbial abundance
Quantitative PCR analysis was performed to determine the relative abundance of microbial 16 S rRNA genes in swab sample extracts. Amplification reactions were performed as described previously82. PCR was performed using a StepOne Plus Real Time PCR System (Life Technologies), and all samples were analyzed using technical duplicates.
Characterization of microbial community structure
Microbial community structure was characterized using high-throughput sequencing of PCR amplicons generated from the V1–V3 variable regions of bacterial 16S ribosomal RNA (rRNA) genes. Briefly, the widely used primer sets 27F/534R, targeting the V1–V3 variable region of the 16S rRNA gene of bacteria, was used for amplification as done earlier with slight modifications83. A two-stage PCR or “targeted amplicon sequencing (TAS)” approach was performed to generate amplicon libraries84,85. In the first of the two-stage amplification procedure, the templates were amplified (28 cycles) using primers containing 27F and 534R (Bacteria), and 5′ linkers CS1 and CS2 linkers, as described previously86 PCRs were performed in 10 µl reaction volumes using the KAPA HiFi HotStart PCR Kit, and the PCR conditions were as follows: 5 min initial denaturation at 95 °C, followed by 28 cycles of: 95 °C for 30″, 50 °C for 30″, 72 °C for 60″. Subsequently, a second PCR reaction was established, with one µl of amplification product from the first stage used as input to the second reaction. The primers for the second stage amplifications were the AccessArray barcoding system primers (Fluidigm, South San Francisco, CA, USA), containing Illumina sequencing adapters, sample-specific barcodes, and CS1 and CS2 linkers. PCR conditions for the second reaction were as follows: 5 min initial denaturation at 95 °C, followed by 8 cycles of: 95 °C for 30″ 60 °C for 30″, 72 °C for 60″. Samples were pooled in equimolar ratio and quantified using a Qubit 2.0 fluorometer. Sequencing was performed on an Illumina MiSeq sequencer using standard V3 chemistry with paired-end, 300 base reads. Fluidigm sequencing primers, targeting the CS1 and CS2 linker regions, were used to initiate sequencing. Demultiplexing of reads was performed on instrument. Library preparation was performed at the DNA Services Facility at the University of Illinois at Chicago, and sequencing was performed at the W.M. Keck Center for Comparative and Functional Genomics at the University of Illinois at Urbana-Champaign (UIUC).
Bioinformatics analysis
Microbiome
Raw paired-end FASTQ files were merged using the Paired-End reAd merger (PEAR) algorithm87. Subsequently, merged data were quality trimmed (Q20) and sequences shorter than 450 bases were removed. The remaining sequences were exported as FASTA and processed through the software package QIIME (v1.8.0)88. Sequences were screened for chimeras using the USEARCH61 algorithm89 and putative chimeric sequences were removed from the data set. Chimera-free samples were then pooled, and clustered into operational taxonomic units (OTU) at 97% similarity using the usearch61 de47 generated at taxonomic levels from phylum to species.
Statistical analysis
Epithelium RNA
Differential Expression Analysis: A two sample t-test was done to identify likely differentially expressed miRNAs with a parametric p-value derived and False Discovery Rate, FDR, to correct for multiple testing within the framework of BRB-Array Tools. The same was used to generate heat maps to display their expression after hierarchical clustering53. Only miRNAs detectable in over 60% of samples were examined.
Co-expression Analysis: miRNA expression levels of 11 subjects at baseline and 4 weeks were analyzed. miRNAs with more than 12 missing values out of the 22 samples were removed, and among the remaining miRNAs, missing values were replaced with the overall average of available expression values for the miRNA. For each miRNA differential expression between 4 wk and 0 wk, samples were tested using a two-sided paired t-test, and resulting p-value denoted by pDE. For each pair of miRNAs the Spearman correlation coefficient across all 22 samples was computed and the resulting p-value denoted by pCC. To combine evidence of co-expression of a miRNA pair with evidence of their differential expression, the Stouffer’s weighted z-score was used90,91.
| 1 |
where ZDE(miR) denotes the Z-score of differential expression of miR obtained from its pDE by applying the inverse of standard normal cumulative distribution function to 1- pDE and ZCC(miR1, miR2) denotes the Z-score of co-expression of miR1 and miR2, similarly obtained from pCC. The weights used to combine evidence were wCC = 1 and wDE = 0.5. The Stouffer’s z-score was converted to a p-value using the standard normal distribution and finally corrected for multiple hypothesis testing using FDR. miRNA pairs at FDR < 0.01 where at least one miRNA of the pair has pDE <0.05 were determined.
Prediction of miRNA targets and their functional analysis
Potential miRNA targets were identified using DIANA‐miRPath v3.0 (http://www.microrna.gr/miRPathv3). Validated mRNA targets were selected, using Tarbase, which uses only experimentally verified targets48,49,92. For functional annotation of potential targets, we used Kyoto Encyclopedia of Genes and Genomes (KEGG) pathways term enrichment analysis, using the computational tool miRPath, to identify a list of pathways showing statistically higher levels of representation than that expected by chance. The Estrogen Receptor Signaling Pathway, hsa04915, was ranked highest using the experimentally verified Tarbase mRNA target sets and an adaptation of miRPath to help insure accuracy93,94. A similar analysis of 40 random sets of 8 miRNAs, was done and none were associated with such high probability with this pathway helping to show its validity94. Two other pathways, hsa05230 and hsa04550, were also identified though at lower probability. For each, one of forty randomized miRNA sets showed a similar probability of association with that pathway.
Microbiome
BIOMs were used: (a) for calculation of alpha diversity indices (e.g. taxon richness), (b) for visualization of data at multiple taxonomic levels with non-metric multidimensional scaling (NMDS), (c) for analysis of similarity (ANOSIM) tests to determine if microbial communities were significantly different between groups, and (d) to identify taxa which were significantly differentially abundant between a priori defined groups. An unpaired Student’s t test was used to determine if microbial alpha diversity (i.e., Shannon index) was significantly different (P < 0.05) between smokers and non-smokers. Differences in microbiota taxonomic abundance between the groups were tested using White’s nonparametric test. False discovery rate–corrected P values were estimated in the method of Storey for all taxa comparisons50. Significance was set at P < 0.05 for White’s nonparametric test with a false discovery rate of <0.10 allowed51. All statistical analyses were performed using Primer 795 with the exception of the identification of differentially abundant taxa, which was done using the software package STAMP96.
Data availability
The sequencing data from this study is deposited as SRP136940 in the Sequence Read Archive at the NCBI.
Electronic supplementary material
Acknowledgements
This work was supported by R03CA178843 from the National Cancer Institute to GRA and JLS. We thank Hana Siddique for help with patient subject interactions at the initiation of the study.
Author Contributions
J.L.T. and Y.Z. carried out experiments and data analysis; G.R.A. carried out experiments, data analysis and wrote the manuscript; C.C.T. performed dietary analysis and monitored subjects; S.G. and S.S. did the co-expression analysis of miRNA; A.N. and S.J.G. did the 16s DNA sequencing and assignment of sequencing reads to taxa; G.R.A., S.J.G., S.S., J.L.S. and C.C.T. revised the manuscript; G.R.A. and J.L.S. collected samples; G.R.A., C.C.T. and J.L.S. conceived experiments. All the authors contributed critical discussion and approved the final version of the manuscript.
Competing Interests
The authors declare no competing interests.
Footnotes
Electronic supplementary material
Supplementary information accompanies this paper at 10.1038/s41598-018-22994-3.
Publisher's note: Springer Nature remains neutral with regard to jurisdictional claims in published maps and institutional affiliations.
References
- 1.Fritz H, et al. Green tea and lung cancer: a systematic review. Integr Cancer Ther. 2013;12:7–24. doi: 10.1177/1534735412442378. [DOI] [PubMed] [Google Scholar]
- 2.Yang CS, Chen JX, Wang H, Lim J. Lessons learned from cancer prevention studies with nutrients and non-nutritive dietary constituents. Mol Nutr Food Res. 2016;60:1239–1250. doi: 10.1002/mnfr.201500766. [DOI] [PMC free article] [PubMed] [Google Scholar]
- 3.Zhang W, Geng T, Han W, Dou H. Tea intake and risk of oral, pharyngeal, and laryngeal carcinoma: a meta-analysis. Med Sci Monit. 2014;20:2142–2150. doi: 10.12659/MSM.892333. [DOI] [PMC free article] [PubMed] [Google Scholar]
- 4.Fiala ES, et al. Induction of preneoplastic lung lesions in guinea pigs by cigarette smoke inhalation and their exacerbation by high dietary levels of vitamins C and E. Carcinogenesis. 2005;26:605–612. doi: 10.1093/carcin/bgh341. [DOI] [PubMed] [Google Scholar]
- 5.Fu Y, et al. In vivo detection of a novel endogenous etheno-DNA adduct derived from arachidonic acid and the effects of antioxidants on its formation. Free Radic Biol Med. 2014;73:12–20. doi: 10.1016/j.freeradbiomed.2014.04.032. [DOI] [PMC free article] [PubMed] [Google Scholar]
- 6.Hu Y, et al. Manipulation of the gut microbiota using resistant starch is associated with protection against colitis-associated colorectal cancer in rats. Carcinogenesis. 2016;37:366–375. doi: 10.1093/carcin/bgw019. [DOI] [PubMed] [Google Scholar]
- 7.Ide R, et al. A prospective study of green tea consumption and oral cancer incidence in Japan. Ann Epidemiol. 2007;17:821–826. doi: 10.1016/j.annepidem.2007.04.003. [DOI] [PubMed] [Google Scholar]
- 8.Witschi H. Successful and not so successful chemoprevention of tobacco smoke-induced lung tumors. Exp Lung Res. 2000;26:743–755. doi: 10.1080/01902140150216792. [DOI] [PubMed] [Google Scholar]
- 9.Yang CS, Wang X, Lu G, Picinich SC. Cancer prevention by tea: animal studies, molecular mechanisms and human relevance. Nat Rev Cancer. 2009;9:429–439. doi: 10.1038/nrc2641. [DOI] [PMC free article] [PubMed] [Google Scholar]
- 10.Chen L, et al. Therapeutic properties of green tea against environmental insults. J Nutr Biochem. 2017;40:1–13. doi: 10.1016/j.jnutbio.2016.05.005. [DOI] [PMC free article] [PubMed] [Google Scholar]
- 11.Zhang C, Shu L, Kong AN. MicroRNAs: New players in cancer prevention targeting Nrf2, oxidative stress and inflammatory pathways. Curr Pharmacol Rep. 2015;1:21–30. doi: 10.1007/s40495-014-0013-7. [DOI] [PMC free article] [PubMed] [Google Scholar]
- 12.Yang CS, Wang H. Mechanistic issues concerning cancer prevention by tea catechins. Mol Nutr Food Res. 2011;55:819–831. doi: 10.1002/mnfr.201100036. [DOI] [PubMed] [Google Scholar]
- 13.Halliwell B. Are polyphenols antioxidants or pro-oxidants? What do we learn from cell culture and in vivo studies? Arch Biochem Biophys. 2008;476:107–112. doi: 10.1016/j.abb.2008.01.028. [DOI] [PubMed] [Google Scholar]
- 14.Del Rio D, et al. Bioavailability and catabolism of green tea flavan-3-ols in humans. Nutrition. 2010;26:1110–1116. doi: 10.1016/j.nut.2009.09.021. [DOI] [PubMed] [Google Scholar]
- 15.Takagaki A, Nanjo F. Metabolism of (-)-epigallocatechin gallate by rat intestinal flora. J Agric Food Chem. 2010;58:1313–1321. doi: 10.1021/jf903375s. [DOI] [PubMed] [Google Scholar]
- 16.Lu Y, et al. A gene expression signature that can predict green tea exposure and chemopreventive efficacy of lung cancer in mice. Cancer Res. 2006;66:1956–1963. doi: 10.1158/0008-5472.CAN-05-3158. [DOI] [PubMed] [Google Scholar]
- 17.Milenkovic D, et al. Modulation of miRNA expression by dietary polyphenols in apoE deficient mice: a new mechanism of the action of polyphenols. PLoS One. 2012;7:e29837. doi: 10.1371/journal.pone.0029837. [DOI] [PMC free article] [PubMed] [Google Scholar]
- 18.Zhou H, et al. Gene regulation mediated by microRNAs in response to green tea polyphenol EGCG in mouse lung cancer. BMC genomics. 2014;15(Suppl 11):S3. doi: 10.1186/1471-2164-15-S11-S3. [DOI] [PMC free article] [PubMed] [Google Scholar]
- 19.Milenkovic D, Jude B, Morand C. miRNA as molecular target of polyphenols underlying their biological effects. Free Radic Biol Med. 2013;64:40–51. doi: 10.1016/j.freeradbiomed.2013.05.046. [DOI] [PubMed] [Google Scholar]
- 20.Lochhead P, et al. Etiologic field effect: reappraisal of the field effect concept in cancer predisposition and progression. Mod Pathol. 2015;28:14–29. doi: 10.1038/modpathol.2014.81. [DOI] [PMC free article] [PubMed] [Google Scholar]
- 21.Brody JS. Transcriptome alterations induced by cigarette smoke. Int J Cancer. 2012;131:2754–2762. doi: 10.1002/ijc.27829. [DOI] [PubMed] [Google Scholar]
- 22.Cao C, et al. Bioinformatics Analysis of the Effects of Tobacco Smoke on Gene Expression. PLoS One. 2015;10:e0143377. doi: 10.1371/journal.pone.0143377. [DOI] [PMC free article] [PubMed] [Google Scholar]
- 23.Spira A, et al. Effects of cigarette smoke on the human airway epithelial cell transcriptome. Proc Natl Acad Sci USA. 2004;101:10143–10148. doi: 10.1073/pnas.0401422101. [DOI] [PMC free article] [PubMed] [Google Scholar]
- 24.Choi SW, Yeung VT, Collins AR, Benzie IF. Redox-linked effects of green tea on DNA damage and repair, and influence of microsatellite polymorphism in HMOX-1: results of a human intervention trial. Mutagenesis. 2015;30:129–137. doi: 10.1093/mutage/geu022. [DOI] [PubMed] [Google Scholar]
- 25.Hakim IA, Chow HH, Harris RB. Green tea consumption is associated with decreased DNA damage among GSTM1-positive smokers regardless of their hOGG1 genotype. J Nutr. 2008;138:1567S–1571S. doi: 10.1093/jn/138.8.1567S. [DOI] [PubMed] [Google Scholar]
- 26.Ho CK, Choi SW, Siu PM, Benzie IF. Effects of single dose and regular intake of green tea (Camellia sinensis) on DNA damage, DNA repair, and heme oxygenase-1 expression in a randomized controlled human supplementation study. Mol Nutr Food Res. 2014;58:1379–1383. doi: 10.1002/mnfr.201300751. [DOI] [PubMed] [Google Scholar]
- 27.Vermeer IT, Moonen EJ, Dallinga JW, Kleinjans JC, van Maanen JM. Effect of ascorbic acid and green tea on endogenous formation of N-nitrosodimethylamine and N-nitrosopiperidine in humans. Mutat Res. 1999;428:353–361. doi: 10.1016/S1383-5742(99)00061-7. [DOI] [PubMed] [Google Scholar]
- 28.Schwartz JL, Baker V, Larios E, Chung FL. Molecular and cellular effects of green tea on oral cells of smokers: a pilot study. Mol Nutr Food Res. 2005;49:43–51. doi: 10.1002/mnfr.200400031. [DOI] [PubMed] [Google Scholar]
- 29.Narotzki B, Reznick AZ, Aizenbud D, Levy Y. Green tea: a promising natural product in oral health. Arch Oral Biol. 2012;57:429–435. doi: 10.1016/j.archoralbio.2011.11.017. [DOI] [PubMed] [Google Scholar]
- 30.Ramesh A, Varghese SS, Doraiswamy JN, Malaiappan S. Herbs as an antioxidant arsenal for periodontal diseases. J Intercult Ethnopharmacol. 2016;5:92–96. doi: 10.5455/jice.20160122065556. [DOI] [PMC free article] [PubMed] [Google Scholar]
- 31.Scannapieco FA, Cantos A. Oral inflammation and infection, and chronic medical diseases: implications for the elderly. Periodontol. 2016;2000(72):153–175. doi: 10.1111/prd.12129. [DOI] [PubMed] [Google Scholar]
- 32.Reygaert WC. The antimicrobial possibilities of green tea. Front Microbiol. 2014;5:434. doi: 10.3389/fmicb.2014.00434. [DOI] [PMC free article] [PubMed] [Google Scholar]
- 33.Steinmann J, Buer J, Pietschmann T, Steinmann E. Anti-infective properties of epigallocatechin-3-gallate (EGCG), a component of green tea. Br J Pharmacol. 2013;168:1059–1073. doi: 10.1111/bph.12009. [DOI] [PMC free article] [PubMed] [Google Scholar]
- 34.Anita P, Sivasamy S, Madan Kumar PD, Balan IN, Ethiraj S. In vitro antibacterial activity of Camellia sinensis extract against cariogenic microorganisms. J Basic Clin Pharm. 2014;6:35–39. doi: 10.4103/0976-0105.145777. [DOI] [PMC free article] [PubMed] [Google Scholar]
- 35.Araghizadeh A, Kohanteb J, Fani MM. Inhibitory activity of green tea (Camellia sinensis) extract on some clinically isolated cariogenic and periodontopathic bacteria. Med Princ Pract. 2013;22:368–372. doi: 10.1159/000348299. [DOI] [PMC free article] [PubMed] [Google Scholar]
- 36.Lee HC, Jenner AM, Low CS, Lee YK. Effect of tea phenolics and their aromatic fecal bacterial metabolites on intestinal microbiota. Res Microbiol. 2006;157:876–884. doi: 10.1016/j.resmic.2006.07.004. [DOI] [PubMed] [Google Scholar]
- 37.Hara Y. Influence of tea catechins on the digestive tract. J Cell Biochem Suppl. 1997;27:52–58. doi: 10.1002/(SICI)1097-4644(1997)27+<52::AID-JCB10>3.0.CO;2-N. [DOI] [PubMed] [Google Scholar]
- 38.Unno T, Sakuma M, Mitsuhashi S. Effect of dietary supplementation of (-)-epigallocatechin gallate on gut microbiota and biomarkers of colonic fermentation in rats. J Nutr Sci Vitaminol (Tokyo) 2014;60:213–219. doi: 10.3177/jnsv.60.213. [DOI] [PubMed] [Google Scholar]
- 39.Ishihara N, Chu D-C, Akachi S, Juneja K. Improvement of intestinal microflora balance and prevention of digestive and respiratory organ diseases in calves by green tea extracts. Livestock Production Science. 2001;68:217–229. doi: 10.1016/S0301-6226(00)00233-5. [DOI] [Google Scholar]
- 40.Okubo T, et al. In Vivo Effects of Tea Polyphenol Intake on Human Intestinal Microflora and Metabolism. Biosci Biotechnol Biochem. 1992;56:588–591. doi: 10.1271/bbb.56.588. [DOI] [PubMed] [Google Scholar]
- 41.Jin JS, Touyama M, Hisada T, Benno Y. Effects of green tea consumption on human fecal microbiota with special reference to Bifidobacterium species. Microbiol Immunol. 2012;56:729–739. doi: 10.1111/j.1348-0421.2012.00502.x. [DOI] [PubMed] [Google Scholar]
- 42.Draijer R, Duchateau GS. Capsule Formats May Hamper Green Tea Catechin Bioavailability. J Nutr. 2015;145:2797–2798. doi: 10.3945/jn.115.217265. [DOI] [PubMed] [Google Scholar]
- 43.Janssens PL, et al. Long-Term Green Tea Supplementation Does Not Change the Human Gut Microbiota. PLoS One. 2016;11:e0153134. doi: 10.1371/journal.pone.0153134. [DOI] [PMC free article] [PubMed] [Google Scholar]
- 44.Kolokythas A, Zhou Y, Schwartz JL, Adami GR. Similar Squamous Cell Carcinoma Epithelium microRNA Expression in Never Smokers and Ever Smokers. PLoS One. 2015;10:e0141695. doi: 10.1371/journal.pone.0141695. [DOI] [PMC free article] [PubMed] [Google Scholar]
- 45.Sridhar S, et al. Smoking-induced gene expression changes in the bronchial airway are reflected in nasal and buccal epithelium. BMC genomics. 2008;9:259. doi: 10.1186/1471-2164-9-259. [DOI] [PMC free article] [PubMed] [Google Scholar]
- 46.Wang G, et al. Persistence of smoking-induced dysregulation of miRNA expression in the small airway epithelium despite smoking cessation. PLoS One. 2015;10:e0120824. doi: 10.1371/journal.pone.0120824. [DOI] [PMC free article] [PubMed] [Google Scholar]
- 47.McShane LM, et al. Methods for assessing reproducibility of clustering patterns observed in analyses of microarray data. Bioinformatics. 2002;18:1462–1469. doi: 10.1093/bioinformatics/18.11.1462. [DOI] [PubMed] [Google Scholar]
- 48.Karagkouni, D. et al. DIANA-TarBase v8: a decade-long collection of experimentally supported miRNA-gene interactions. Nucleic Acids Res, 10.1093/nar/gkx1141 (2017). [DOI] [PMC free article] [PubMed]
- 49.Vlachos IS, et al. DIANA-miRPath v3.0: deciphering microRNA function with experimental support. Nucleic Acids Res. 2015;43:W460–466. doi: 10.1093/nar/gkv403. [DOI] [PMC free article] [PubMed] [Google Scholar]
- 50.Storey JD, Tibshirani R. Statistical significance for genomewide studies. Proc Natl Acad Sci USA. 2003;100:9440–9445. doi: 10.1073/pnas.1530509100. [DOI] [PMC free article] [PubMed] [Google Scholar]
- 51.White JR, Nagarajan N, Pop M. Statistical methods for detecting differentially abundant features in clinical metagenomic samples. PLoS Comput Biol. 2009;5:e1000352. doi: 10.1371/journal.pcbi.1000352. [DOI] [PMC free article] [PubMed] [Google Scholar]
- 52.Segata N, et al. Metagenomic biomarker discovery and explanation. Genome Biol. 2011;12:R60. doi: 10.1186/gb-2011-12-6-r60. [DOI] [PMC free article] [PubMed] [Google Scholar]
- 53.Simon R, et al. Analysis of gene expression data using BRB-ArrayTools. Cancer Inform. 2007;3:11–17. doi: 10.1177/117693510700300022. [DOI] [PMC free article] [PubMed] [Google Scholar]
- 54.Breitling R, Armengaud P, Amtmann A, Herzyk P. Rank products: a simple, yet powerful, new method to detect differentially regulated genes in replicated microarray experiments. FEBS Lett. 2004;573:83–92. doi: 10.1016/j.febslet.2004.07.055. [DOI] [PubMed] [Google Scholar]
- 55.De Amicis F, et al. In vitro mechanism for downregulation of ER-alpha expression by epigallocatechin gallate in ER+/PR+ human breast cancer cells. Mol Nutr Food Res. 2013;57:840–853. doi: 10.1002/mnfr.201200560. [DOI] [PMC free article] [PubMed] [Google Scholar]
- 56.Hashim D, et al. Hormone factors play a favorable role in female head and neck cancer risk. Cancer Med. 2017;6:1998–2007. doi: 10.1002/cam4.1136. [DOI] [PMC free article] [PubMed] [Google Scholar]
- 57.Katiyar, S. K. Emerging Phytochemicals for the Prevention and Treatment of Head and Neck Cancer. Molecules21, 10.3390/molecules21121610 (2016). [DOI] [PMC free article] [PubMed]
- 58.Gao F, et al. Epigallocatechin gallate inhibits human tongue carcinoma cells via HK2mediated glycolysis. Oncology reports. 2015;33:1533–1539. doi: 10.3892/or.2015.3727. [DOI] [PubMed] [Google Scholar]
- 59.Lee SH, Nam HJ, Kang HJ, Kwon HW, Lim YC. Epigallocatechin-3-gallate attenuates head and neck cancer stem cell traits through suppression of Notch pathway. Eur J Cancer. 2013;49:3210–3218. doi: 10.1016/j.ejca.2013.06.025. [DOI] [PubMed] [Google Scholar]
- 60.Segata N, et al. Composition of the adult digestive tract bacterial microbiome based on seven mouth surfaces, tonsils, throat and stool samples. Genome Biol. 2012;13:R42. doi: 10.1186/gb-2012-13-6-r42. [DOI] [PMC free article] [PubMed] [Google Scholar]
- 61.Guerrero-Preston R, et al. 16S rRNA amplicon sequencing identifies microbiota associated with oral cancer, human papilloma virus infection and surgical treatment. Oncotarget. 2016;7:51320–51334. doi: 10.18632/oncotarget.9710. [DOI] [PMC free article] [PubMed] [Google Scholar]
- 62.Wu J, et al. Cigarette smoking and the oral microbiome in a large study of American adults. ISME J. 2016;10:2435–2446. doi: 10.1038/ismej.2016.37. [DOI] [PMC free article] [PubMed] [Google Scholar]
- 63.Brook I. The impact of smoking on oral and nasopharyngeal bacterial flora. J Dent Res. 2011;90:704–710. doi: 10.1177/0022034510391794. [DOI] [PubMed] [Google Scholar]
- 64.Kanwar J, et al. Recent advances on tea polyphenols. Front Biosci (Elite Ed) 2012;4:111–131. doi: 10.2741/e363. [DOI] [PMC free article] [PubMed] [Google Scholar]
- 65.Kenney EB, Saxe SR, Bowles RD. The effect of cigarette smoking on anaerobiosis in the oral cavity. J Periodontol. 1975;46:82–85. doi: 10.1902/jop.1975.46.2.82. [DOI] [PubMed] [Google Scholar]
- 66.Sopori M. Effects of cigarette smoke on the immune system. Nat Rev Immunol. 2002;2:372–377. doi: 10.1038/nri803. [DOI] [PubMed] [Google Scholar]
- 67.Schmidt BL, et al. Changes in abundance of oral microbiota associated with oral cancer. PLoS One. 2014;9:e98741. doi: 10.1371/journal.pone.0098741. [DOI] [PMC free article] [PubMed] [Google Scholar]
- 68.Zhao H, et al. Variations in oral microbiota associated with oral cancer. Sci Rep. 2017;7:11773. doi: 10.1038/s41598-017-11779-9. [DOI] [PMC free article] [PubMed] [Google Scholar]
- 69.Castellarin M, et al. Fusobacterium nucleatum infection is prevalent in human colorectal carcinoma. Genome Res. 2012;22:299–306. doi: 10.1101/gr.126516.111. [DOI] [PMC free article] [PubMed] [Google Scholar]
- 70.Kostic AD, et al. Genomic analysis identifies association of Fusobacterium with colorectal carcinoma. Genome Res. 2012;22:292–298. doi: 10.1101/gr.126573.111. [DOI] [PMC free article] [PubMed] [Google Scholar]
- 71.Ben Lagha A, Haas B, Grenier D. Tea polyphenols inhibit the growth and virulence properties of Fusobacterium nucleatum. Sci Rep. 2017;7:44815. doi: 10.1038/srep44815. [DOI] [PMC free article] [PubMed] [Google Scholar]
- 72.Halliwell B, Rafter J, Jenner A. Health promotion by flavonoids, tocopherols, tocotrienols, and other phenols: direct or indirect effects? Antioxidant or not? Am J Clin Nutr. 2005;81:268S–276S. doi: 10.1093/ajcn/81.1.268S. [DOI] [PubMed] [Google Scholar]
- 73.Ozdal T, et al. The Reciprocal Interactions between Polyphenols and Gut Microbiota and Effects on Bioaccessibility. Nutrients. 2016;8:78. doi: 10.3390/nu8020078. [DOI] [PMC free article] [PubMed] [Google Scholar]
- 74.Sang S, Lambert JD, Ho CT, Yang CS. The chemistry and biotransformation of tea constituents. Pharmacol Res. 2011;64:87–99. doi: 10.1016/j.phrs.2011.02.007. [DOI] [PubMed] [Google Scholar]
- 75.Li C, et al. Structural identification of two metabolites of catechins and their kinetics in human urine and blood after tea ingestion. Chem Res Toxicol. 2000;13:177–184. doi: 10.1021/tx9901837. [DOI] [PubMed] [Google Scholar]
- 76.Yang CS, Lee MJ, Chen L. Human salivary tea catechin levels and catechin esterase activities: implication in human cancer prevention studies. Cancer Epidemiol Biomarkers Prev. 1999;8:83–89. [PubMed] [Google Scholar]
- 77.Fung ST, Ho CK, Choi SW, Chung WY, Benzie IF. Comparison of catechin profiles in human plasma and urine after single dosing and regular intake of green tea (Camellia sinensis) Br J Nutr. 2013;109:2199–2207. doi: 10.1017/S0007114512004370. [DOI] [PubMed] [Google Scholar]
- 78.Barber-Chamoux N, et al. Substantial Variability Across Individuals in the Vascular and Nutrigenomic Response to an Acute Intake of Curcumin: A Randomised Controlled Trial. Mol Nutr Food Res. 2017 doi: 10.1002/mnfr.201700418. [DOI] [PubMed] [Google Scholar]
- 79.Kristal AR, et al. Evaluation of web-based, self-administered, graphical food frequency questionnaire. J Acad Nutr Diet. 2014;114:613–621. doi: 10.1016/j.jand.2013.11.017. [DOI] [PMC free article] [PubMed] [Google Scholar]
- 80.Mata-Bilbao Mde L, et al. A new LC/MS/MS rapid and sensitive method for the determination of green tea catechins and their metabolites in biological samples. J Agric Food Chem. 2007;55:8857–8863. doi: 10.1021/jf0713962. [DOI] [PubMed] [Google Scholar]
- 81.Johnson WE, Li C, Rabinovic A. Adjusting batch effects in microarray expression data using empirical Bayes methods. Biostatistics. 2007;8:118–127. doi: 10.1093/biostatistics/kxj037. [DOI] [PubMed] [Google Scholar]
- 82.Nadkarni MA, Martin FE, Jacques NA, Hunter N. Determination of bacterial load by real-time PCR using a broad-range (universal) probe and primers set. Microbiology. 2002;148:257–266. doi: 10.1099/00221287-148-1-257. [DOI] [PubMed] [Google Scholar]
- 83.Yildirim S, et al. Characterization of the fecal microbiome from non-human wild primates reveals species specific microbial communities. PLoS One. 2010;5:e13963. doi: 10.1371/journal.pone.0013963. [DOI] [PMC free article] [PubMed] [Google Scholar]
- 84.Bybee SM, et al. Targeted amplicon sequencing (TAS): a scalable next-gen approach to multilocus, multitaxa phylogenetics. Genome Biol Evol. 2011;3:1312–1323. doi: 10.1093/gbe/evr106. [DOI] [PMC free article] [PubMed] [Google Scholar]
- 85.Green SJ, Venkatramanan R, Naqib A. Deconstructing the polymerase chain reaction: understanding and correcting bias associated with primer degeneracies and primer-template mismatches. PLoS One. 2015;10:e0128122. doi: 10.1371/journal.pone.0128122. [DOI] [PMC free article] [PubMed] [Google Scholar]
- 86.Moonsamy PV, et al. High throughput HLA genotyping using 454 sequencing and the Fluidigm Access Array System for simplified amplicon library preparation. Tissue Antigens. 2013;81:141–149. doi: 10.1111/tan.12071. [DOI] [PubMed] [Google Scholar]
- 87.Zhang J, Kobert K, Flouri T, Stamatakis A. PEAR: a fast and accurate Illumina Paired-End reAd mergeR. Bioinformatics. 2014;30:614–620. doi: 10.1093/bioinformatics/btt593. [DOI] [PMC free article] [PubMed] [Google Scholar]
- 88.Caporaso JG, et al. QIIME allows analysis of high-throughput community sequencing data. Nat Methods. 2010;7:335–336. doi: 10.1038/nmeth.f.303. [DOI] [PMC free article] [PubMed] [Google Scholar]
- 89.Edgar RC. Search and clustering orders of magnitude faster than BLAST. Bioinformatics. 2010;26:2460–2461. doi: 10.1093/bioinformatics/btq461. [DOI] [PubMed] [Google Scholar]
- 90.Zaykin DV. Optimally weighted Z-test is a powerful method for combining probabilities in meta-analysis. J Evol Biol. 2011;24:1836–1841. doi: 10.1111/j.1420-9101.2011.02297.x. [DOI] [PMC free article] [PubMed] [Google Scholar]
- 91.Whitlock MC. Combining probability from independent tests: the weighted Z-method is superior to Fisher’s approach. J Evol Biol. 2005;18:1368–1373. doi: 10.1111/j.1420-9101.2005.00917.x. [DOI] [PubMed] [Google Scholar]
- 92.Reczko M, Maragkakis M, Alexiou P, Grosse I, Hatzigeorgiou AG. Functional microRNA targets in protein coding sequences. Bioinformatics. 2012;28:771–776. doi: 10.1093/bioinformatics/bts043. [DOI] [PubMed] [Google Scholar]
- 93.Godard P, van Eyll J. Pathway analysis from lists of microRNAs: common pitfalls and alternative strategy. Nucleic Acids Res. 2015;43:3490–3497. doi: 10.1093/nar/gkv249. [DOI] [PMC free article] [PubMed] [Google Scholar]
- 94.Zhou Y, Kolokythas A, Schwartz JL, Epstein JB, Adami G. R. microRNA from brush biopsy to characterize oral squamous cell carcinoma epithelium. Cancer Med. 2017;6:67–78. doi: 10.1002/cam4.951. [DOI] [PMC free article] [PubMed] [Google Scholar]
- 95.Magurran, A. E. Ecological diversity and its measurement. 34-41 (Princeton University Press, 1988).
- 96.Parks DH, Tyson GW, Hugenholtz P, Beiko RG. STAMP: statistical analysis of taxonomic and functional profiles. Bioinformatics. 2014;30:3123–3124. doi: 10.1093/bioinformatics/btu494. [DOI] [PMC free article] [PubMed] [Google Scholar]
- 97.Guenther PM, et al. The Healthy Eating Index-2010 is a valid and reliable measure of diet quality according to the 2010 Dietary Guidelines for Americans. J Nutr. 2014;144:399–407. doi: 10.3945/jn.113.183079. [DOI] [PMC free article] [PubMed] [Google Scholar]
Associated Data
This section collects any data citations, data availability statements, or supplementary materials included in this article.
Supplementary Materials
Data Availability Statement
The sequencing data from this study is deposited as SRP136940 in the Sequence Read Archive at the NCBI.