

ABSTRACT
This study reports novel findings that link E-cadherin (also known as CDH1)-mediated force-transduction signaling to vinculin targeting to intercellular junctions via epidermal growth factor receptor (EGFR) and integrins. These results build on previous findings that demonstrated that mechanically perturbed E-cadherin receptors activate phosphoinositide 3-kinase and downstream integrins in an EGFR-dependent manner. Results of this study show that this EGFR-mediated kinase cascade controls the force-dependent recruitment of vinculin to stressed E-cadherin complexes – a key early signature of cadherin-based mechanotransduction. Vinculin targeting requires its phosphorylation at tyrosine 822 by Abl family kinases (hereafter Abl), but the origin of force-dependent Abl activation had not been identified. We now present evidence that integrin activation, which is downstream of EGFR signaling, controls Abl activation, thus linking E-cadherin to Abl through a mechanosensitive signaling network. These findings place EGFR and integrins at the center of a positive-feedback loop, through which force-activated E-cadherin signals regulate vinculin recruitment to cadherin complexes in response to increased intercellular tension.
This article has an associated First Person interview with the first author of the paper.
KEY WORDS: Cadherin, Epidermal growth factor receptor, Force transduction, Magnetic twisting cytometry, Vinculin, Integrin
Summary: E-cadherin force transduction activates a kinase cascade via epidermal growth factor receptor and integrins that regulates force-dependent recruitment of VCL to stressed cadherin adhesions.
INTRODUCTION
Cells sense mechanical forces through a variety of mechanisms that involve classes of proteins that undergo force-dependent conformation changes that effect changes in cell biochemistry (Bershadsky et al., 2003; Schwartz, 2010; Schwartz and DeSimone, 2008; Vogel and Sheetz, 2006). Such force transduction processes impact a wide range of physiological functions, such as vascular leakage (Califano and Reinhart-King, 2010; Huynh et al., 2011; Krishnan et al., 2011), inflammation (Orr et al., 2006b), morphogenesis (Kasza and Zallen, 2011; Weber et al., 2012), differentiation (Engler et al., 2006) and tumor progression (Butcher et al., 2009; Kumar and Weaver, 2009; Lu et al., 2012; Paszek et al., 2005). Determining the mechanisms underlying mechanotransduction is central to understanding how forces influence development and disease, as well as regulate homeostasis.
In multicellular organisms, adhesion proteins mechanically couple adjacent cells and act as a logical molecule through which force transduction can occur. Integrins sense tissue rigidity through mechanical linkages to extracellular matrix (ECM) proteins (Bershadsky et al., 2003). The ability of integrins to sense ECM rigidity controls cell adhesion and spreading, regulates cell contractility, and activates signaling cascades that guide stem cell differentiation and regulate tumor progression (Bershadsky et al., 2003; Butcher et al., 2009; Elosegui-Artola et al., 2014, 2016; Engler et al., 2006; Katsumi et al., 2004; Kumar and Weaver, 2009; Levental et al., 2009; Schwartz, 2010; Wang et al., 2015).
In tissues, cells are mechanically connected to adjacent cells through cell–cell adhesion proteins. Cadherins are essential adhesion proteins that mediate intercellular cohesion in all tissues (Gumbiner, 2005; Takeichi, 1995; Takeichi and Nakagawa, 2001). In this protein family, classical cadherins are transmembrane proteins that bind identical cadherins on adjacent cells to form cohesive intercellular junctions. They are also mechanically linked to the actin cytoskeleton through catenins (Nagafuchi et al., 1991, 1994; Shapiro and Weis, 2009). Specifically, β-catenin simultaneously binds to the cadherin cytoplasmic domain and the actin-binding protein α-catenin to form a mechanical chain between cadherin bonds and the actin cytoskeleton. However, cadherins are also signaling proteins that activate cytoskeletal regulatory proteins including GTPases and Src family kinases (Fukata and Kaibuchi, 2001; Niessen et al., 2011; Ouyang et al., 2013). E-cadherin (also known as CDH1) also regulates contact-inhibited proliferation in epithelial tissues (Huttenlocher et al., 1998; McClatchey and Yap, 2012; Perrais et al., 2007). E-cadherin crosstalk with the epidermal growth factor receptor (EGFR) inhibits growth factor-dependent proliferation (Curto et al., 2007; Gumbiner and Kim, 2014).
Cadherin complexes are also force transducers (Ladoux et al., 2010; le Duc et al., 2010; Lecuit, 2010; Liu et al., 2010; Yonemura et al., 2010). In a seminal study, Yonemura et al. (2010) reported that α-catenin is a force transducer in cadherin complexes and that it undergoes a conformation change in response to increased junctional tension to expose a cryptic site for the actin-binding protein vinculin (VCL). Subsequent VCL recruitment to junctions recruits Mena/VASP family proteins, which activate actin polymerization to mechanically reinforce intercellular junctions (Leerberg et al., 2014). Until recently, this was the only identified force transduction mechanism at cadherin-based adhesions. Consequently, α-catenin conformation switching, VCL recruitment and actin polymerization are hallmarks of cadherin-based force transduction at cell–cell junctions.
This model of cadherin-mediated force transduction has been demonstrated for several different cadherins in several cell types through biophysical measurements at both the single-molecule and cell levels, and complementary biochemical and imaging approaches (Barry et al., 2014; Buckley et al., 2014; Kim et al., 2015; Leckband and de Rooij, 2014; Thomas et al., 2013; Yao et al., 2014). One of these biophysical approaches, optical magnetic twisting cytometry (MTC), has been used to quantify force-dependent changes in cell mechanics. Fluorescence imaging in turn has been used to quantify coincident VCL and actin accumulation at force-loaded E-cadherin receptors (Barry et al., 2014, 2015; Kim et al., 2015; le Duc et al., 2010; Twiss et al., 2012). MTC measurements (Wang et al., 1993) use magnetic beads modified with E-cadherin extracellular domains to mechanically perturb E-cadherin receptors on epithelial cells (le Duc et al., 2010). A magnetic field generates a twisting torque on the beads and bound E-cadherin receptors, and induces a rapid cadherin-specific increase in the measured cell stiffness, with concomitant recruitment of VCL and actin to the beads (Barry et al., 2014, 2015; le Duc et al., 2010). Studies with a fluorescence resonance energy transfer (FRET)-based α-catenin conformation sensor have further demonstrated the spatiotemporal coordination of E-cadherin force loading, α-catenin conformation changes and force-activated cytoskeletal remodeling (Kim et al., 2015).
The α-catenin-dependent actin remodeling at perturbed E-cadherin complexes would account for the measured adaptive cell stiffening (Icard-Arcizet et al., 2008). However, other studies have identified an additional intercellular force transduction mechanism that activates intracellular signaling. In endothelial tissues, vascular endothelial cadherin (VE-cadherin; also known as CDH5), vascular endothelial growth factor receptor 2 (VEGFR2; also known as KDR) and platelet endothelial cell adhesion molecule 1 (PECAM-1) at interendothelial junctions are required for fluid shear sensing (Chen and Tzima, 2009). Mechanically perturbing PECAM-1 activates phosphoinositide 3-kinase (PI3K) and downstream integrins to increase Rho-dependent cell contractility (Collins et al., 2012). Moreover, PECAM-1-dependent endothelial alignment with flow requires VE-cadherin to associate with VEGFR2.
A recent report of E-cadherin-mediated force transduction, which used MTC studies in combination with imaging and biochemical measurements, demonstrated that force-loading E-cadherin activates a kinase cascade similar to that triggered by PECAM-1 in endothelial cells (Muhamed et al., 2016). Combined MTC and traction force measurements have demonstrated that force-loading E-cadherin receptors activates PI3K and distal integrins at the basal plane. The latter cadherin–integrin crosstalk required EGFR (Muhamed et al., 2016). Additionally, Bays et al. (2014) reported that targeting VCL to stressed E-cadherin adhesions requires VCL phosphorylation at tyrosine 822 (Y822) by members of the Abl kinase family (c-Abl and Arg, also known as Abl1 and Abl2, and hereafter referred to as Abl), thus implicating additional kinases in a key early molecular event in E-cadherin mechanotransduction. However, the functional relationships between global receptor tyrosine kinase (RTK)-dependent signaling, junctional α-catenin-conformation switching and VCL targeting to junctions had not been explored.
This study reports novel findings that now link these different, seemingly unrelated, processes associated with E-cadherin force transduction. Specifically, we present new findings that suggest that E-cadherin-mediated signals regulate VCL recruitment to mechanically perturbed E-cadherin junctions. Building on a previous report of force-activated E-cadherin-mediated signaling (Muhamed et al., 2016), these results show that force-loading E-cadherin complexes activates an EGFR-mediated kinase cascade whose downstream effectors activate Abl, which is required for VCL targeting to stressed intercellular contacts. Here, we demonstrate that integrins, which we have previously shown are activated downstream of E-cadherin force transduction (Muhamed et al., 2016), are required for Abl activation and VCL accumulation at cadherin adhesions. Our results thus place EGFR and integrins at the center of a positive mechanotransduction feedback loop through which force-activated E-cadherin signals feedback to initiate cytoskeletal remodeling at perturbed intercellular junctions.
RESULTS
EGFR is required for E-cadherin-mediated adaptive cell stiffening
Prior studies have demonstrated that EGFR inhibition with the pharmacological inhibitor gefitinib or use of EGF-neutralizing antibody blocked E-cadherin-dependent cell stiffening during MTC measurements performed as shown in Fig. 1A. Here, we tested the specific EGFR requirement by knocking down EGFR with siRNA. Western blots (Fig. 1B) demonstrated that treatment of A431D cells expressing EGFP-tagged E-cadherin (A431DECad-GFP cells) with EGFR siRNA resulted in a ∼80% knockdown in EGFR expression relative to that in the siRNA control.
Fig. 1.

E-cadherin-mediated adaptive stiffening in A431DECad-GFP cells. (A) Schematic of the experimental MTC setup and time sequence of measurements. E-cadherin-coated ferromagnetic beads adhere to the apical surface of epithelial cells. Magnetized beads with a magnetic moment (M), are subjected to an oscillating orthogonal magnetic field (H), which generates a torque (T) that displaces beads. Bead displacements are proportional to the cell stiffness. Upon application of a constant twisting torque, changes in the bead displacement reflect changes in the cell stiffness. In the absence of a force-activated cell response, as when using beads coated with DECMA-1, the bead displacement amplitude does not change with the twisting time. By contrast, force transduction responses increase cell stiffness, resulting in a decrease in bead displacement amplitude, as observed with E-cadherin-coated beads. (B) Western blots of EGFR in A431DECad-GFP cells treated with EGFR siRNA (siRNA) and scrambled control (Cntrl) siRNA. Representative blots for EGFR and actin (control) are shown from two experiments. (C) Percentage stiffness change for A431DECad-GFP cells probed with E-cad-modified beads when subjected to the indicated reagents. Gray circles indicate data obtained with untreated cells. Cells were treated with EGFR siRNA (black triangles) and scrambled siRNA control (black diamond); and with gefitinib (gray diamond) and DMSO vehicle control (white triangles). An additional, E-cadherin control used beads coated with the cadherin blocking antibody DECMA-1 (black circles). (D) Bar graph of the percentage stiffness change after 110 s of force-loading magnetic beads, for cells treated with anti-EGF antibody (mEGF), STI571 (imatinib), and the conditions described in C. The data shown are the mean±s.e.m. nbeads>100, Nexp=2. *P<0.05, ***P<0.001 (Student's t-test).
Force-loading beads conjugated to E-cadherin (E-cad beads) bound to A431DECad-GFP cells triggered a 22±4% (mean±s.e.m.) increase in cell stiffening, whereas in the negative control with beads modified with E-cadherin-blocking antibody DECMA-1 cell stiffening was reduced by 10±3% (Fig. 1C,D). Cells treated with control, scrambled siRNA exhibited a 21±3% increase in stiffness, but treatment with EGFR siRNA reduced the increase in cell stiffening to 9±3% (siRNA versus scrambled control: P=0.016, n=220). Blocking EGFR function with an EGF-neutralizing antibody (mEGF) reduced the increase in cell stiffening to 9±2%, which was significantly lower than that in untreated controls (P=0.002, n=280) (Fig. 1D). With cells treated with the EGFR inhibitor gefitinib, the measured cell stiffness increased by only 4±3% relative to the 20±5% increase with cells treated with DMSO (vehicle control). Fig. 1D compares the percentage change in A431DECad-GFP stiffness at the 110 s time point, under the different conditions indicated in Fig. 1C. In additional studies with primary small airway epithelial cells (SAECs), force-loading E-cad beads on SAECs triggered an increase in cell stiffening compared with that seen in control measurements that used DECMA-coated beads (Fig. S1A,B). The stiffening is lower than in A431DECad-GFP cells, but there are differences between all of the epithelial cells we have studied thus far (Barry et al., 2014; le Duc et al., 2010; Muhamed et al., 2016). Suppressing EGFR function with mEGF blocked the E-cadherin-specific stiffening response (Fig. S1A,B). These results support the view that EGFR function is required for E-cadherin-mediated cell stiffening.
We have previously shown that mechanically perturbing E-cadherin receptors on MCF7 and on MDCK cells triggers the activation of PI3K and downstream integrins in an EGFR-dependent manner (Muhamed et al., 2016). Here, we further tested the EGFR requirement for PI3K activation, with cells treated with EGFR siRNA. Akt kinase family proteins (hereafter denoted Akt) are activated downstream of PI3K, so we used a GFP-tagged pleckstrin homology (PH) domain of Akt (PH-Akt–GFP) as a reporter for PI3K activation (Collins et al., 2012; Muhamed et al., 2016). In A431D cells expressing mCherry-tagged E-cadherin (A431DECad-mCherry cells) transiently transfected with PH-Akt–GFP and EGFR siRNA, there was no accumulation of PH-Akt–GFP in regions of interest (ROIs) around mechanically perturbed E-cad beads (Fig. 2A). By contrast, in cells treated with control scrambled siRNA, there was a 39±19% accumulation (mean±s.e.m.) of PH-Akt–GFP at the beads, relative to that in unperturbed controls (Fig. 2A,B). The difference in PH-Akt–GFP accumulation in EGFR-knockdown versus control cells is statistically significant (P=0.008, n=105), and confirmed that EGFR is required for the force-activated E-cadherin-mediated signaling.
Fig. 2.

Force-mediated activation of PI3K is downstream of EGFR. (A) DIC images of beads on cells (right) and (left) confocal fluorescence images of PH-Akt–GFP accumulation in ROIs around E-cad beads on A431DECad-mcherry cells. Panels show PH-Akt–GFP accumulation around beads after loading (Load) and without loading (No Load). White arrows indicate the positions of the beads shown in the DIC images. Cells were treated with scrambled control (Ctrl) siRNA (top two panels) and with EGFR siRNA (bottom two panels). (B) Bar graph of the mean PH-Akt–GFP fluorescence intensity (MFI) normalized to the MFI measured under the ‘no load’ conditions in EGFR knockdown (EGFR siRNA) and control (Ctrl siRNA) cells. nbeads>80, Nexp=2. *P<0.05, **P<0.01 (Student's t-test). Scale bar: 10 µm.
Blocking EGFR function ablates VCL recruitment to mechanically perturbed E-cadherin receptors
VCL recruitment to force-activated α-catenin at perturbed E-cadherin complexes is a hallmark of intercellular force transduction. To determine whether shutting down the EGFR-dependent kinase cascade affected VCL recruitment, confocal immunofluorescence imaging was used to quantify the force-dependent accumulation of VCL at perturbed E-cad beads on both MCF7 and A431DECad-GFP cells. Fig. 3A and Fig. S4A show immunofluorescence images of VCL around E-cad beads on A431DECad-GFP cells, with and without force loading. The quantitative comparisons of background-subtracted VCL intensities are shown for ROIs around beads on MCF7 (Fig. 3B) and on A431DECad-GFP cells (Fig. 3C). Negative controls used DECMA-1-coated beads. With MCF7 cells, inhibiting EGFR function with either the anti-EGF antibody (mEGF) or gefitinib ablated VCL recruitment to perturbed E-cad beads (Fig. 3B); VCL levels were similar to those in negative controls with DECMA-1-coated beads (P=0.36, n=81). Studies with A431DECad-GFP cells gave similar results (Fig. 3C). In primary SAECs, mEGF also inhibited VCL recruitment to force-loaded E-cad beads (Fig. S1C,D).
Fig. 3.

Vinculin recruitment to mechanically perturbed E-cadherin receptors requires EGFR and Abl. (A) DIC (right) images of beads on cells and confocal immunofluorescence images (left) of VCL accumulation around E-cad beads on A431DECad-GFP cells after force loading (Load) or without load (No Load). White arrows indicate the positions of the beads shown in the DIC images. Panels show VCL accumulation at E-cad beads on control cells (Untreated), and at beads on cells treated with gefitinib. Scale bar: 10 µm. (B) Bar graphs of the mean fluorescence intensity (MFI) of VCL in ROIs around E-cad beads on MCF7 cells, under conditions as described in A. Data are also shown for cells with DECMA-1-coated beads or treated with EGF-neutralizing antibody (mEGF), STI571 or DMSO vehicle control. Data obtained after 5 min of force loading (Load) are normalized to the MFI determined under the ‘no load’ condition. nbeads>80, Nexp=2. (C) Bar graph of the MFI of VCL in ROIs around beads bound to A431DECad-GFP cells, normalized to the MFI measured under the ‘no load’ condition. Data are shown for cells perturbed with E-cad beads without any treatments (Untreated) or treated with the EGFR inhibitor gefitinib and DMSO control, and with the Abl inhibitor STI571. Data are also shown for measurements with DECMA-1-coated beads. nbeads>80, Nexp=2. *P<0.05, **P<0.01, ***P<0.001 (Student's t-test).
The formation of new integrin adhesions is required for force-dependent VCL recruitment to E-cadherin receptors
VCL recruitment to mechanically perturbed E-cadherin complexes requires VCL phosphorylation by Abl (Bays et al., 2014). Abl is transiently activated downstream from receptor tyrosine kinases by Src family kinases (SFKs) (Plattner et al., 1999), and by integrin-activated signals during cell adhesion and spreading (Lewis et al., 1996; Pendergast, 2002). We previously showed that force-loading E-cad receptors activates integrins at the basal plane, as demonstrated by increases in integrin-mediated traction forces with corresponding increases in focal adhesion area and size (Muhamed et al., 2016). We further demonstrated that cell stiffening requires the formation of new integrin adhesions. If integrin signaling in turn activated Abl, then blocking E-cad-activated EGFR signaling might in turn inhibit VCL recruitment. However, other EGFR targets such as Src kinases may also activate Abl independently of integrins (Plattner et al., 1999). To address this point, we quantified the activation of SFKs at recovering junctions (see later for further explanation on the rational of these experiments) between MCF7 cells that expressed the KRas-Src FRET sensor, and found that the FRET signal increased 37±3% after adding Ca2+ (Fig. S2A,B). In addition, gefitinib abolished the sensor signal, during junction recovery (Fig. S2A), and these results place target Src kinase(s) downstream from EGFR.
Studies confirmed that blocking EGFR function ablated E-cad-dependent integrin activation. In order to detect integrin activation, we used recombinant GST-tagged fibronectin domains 9–11 (FnIII9-11–GST), which specifically binds activated α5β1 integrin (Orr et al., 2006a; Tzima et al., 2001). The increase in immunofluorescence intensity at the basal plane of cells, after 5 min of force loading E-cad receptors, confirmed α5β1 integrin activation. However, mEGF treatment blocked the response (Fig. S3A,B). The focal adhesions at the basal plane, as visualized by paxillin staining (Fig. S3C) are enriched at the cell periphery, which is similar to the distribution of FnIII9-11–GST as determined by imaging after force loading E-cad beads. The greater immunostaining at the periphery is also consistent with the increase in number and size of focal adhesions (FAs) at the cell periphery, following E-cadherin perturbations in MCF7 cells (Muhamed et al., 2016).
We then tested whether integrin activation is required for VCL recruitment to force-loaded E-cad beads. Treating cells with integrin-function-blocking antibodies 16G3 and AIIB2 decreased VCL and actin accumulation significantly at force-loaded E-cad beads for both MCF7 and A431DECad-GFP cells, relative to treatment with the non-blocking 13G12 control antibody (Fig. 4). We previously showed that a similar antibody treatment also did not alter the EGFR-dependent activation of PI3K, which we demonstrated to be upstream of integrins (Muhamed et al., 2016). Fig. 4A,B and Fig. S4B show that the antibody treatment ablated VCL accumulation at force-loaded E-cad beads in both A431DECad-GFP and MCF7 cells. With cells treated with control 13G12 antibody, there was significant VCL accumulation at force-loaded E-cad beads, relative to no-load controls (Fig. 4A,B). Importantly, antibody pretreatment also ablated force-dependent actin accumulation, compared with the 82±17% increase observed with cells treated with control 13G12 antibody (Fig. 4C; Fig. S4C). Treatment with either the anti-fibronectin 16G3 or anti-β1-integrin AIIB2 antibody alone partially blocked VCL and actin recruitment, but both antibodies together completely ablated VCL accumulation at force-loaded E-cad beads, relative to what was seen with control 13G12 antibody (Fig. 4B). Thus, the formation of new integrin adhesions appears to regulate VCL targeting to and actin remodeling at force-loaded E-cad complexes. The result suggests that integrin activation, downstream from EGFR signaling plays a central role in VCL accumulation at perturbed E-cadherin adhesions. The findings also suggest the involvement of multiple integrin subtypes.
Fig. 4.

Integrins are required for VCL recruitment to mechanically perturbed E-cadherin receptors. (A) Shown are DIC images of beads on cells (right panels) and immunofluorescence images of VCL around E-cad beads on A431DECad-GFP cells. Images of VCL accumulation at beads with (Load) and without bead twisting (No Load) are shown. White arrows indicate the positions of the beads shown in the DIC images. Cells were treated with integrin-function-blocking antibodies 16G3 and AIIB2, or with the integrin non-blocking control antibody 13G12. Arrows indicate bead locations. Scale bar: 10 μm. (B) Bar graph of the mean VCL intensity in ROIs around E-cad beads, normalized to the mean intensity determined under the ‘no load’ condition. Data shown are for both MCF7 and A431DECad-GFP cells treated with control and integrin function-blocking antibodies AIIB2 and 16G3 alone or together. nbeads>190, Nexp=2. (C) Bar graph of the mean actin intensity in regions of interest around E-cad beads on A431DECad-GFP cells, normalized to the mean intensity determined under the ‘no load’ condition. Data shown are for cells treated with control 13G12 and integrin function-blocking antibodies 16G3 and AIIB2 described in A, as well as for untreated controls and cells treated with STI571. nbeads>85, Nexp=2. ***P<0.001 (Student's t-test).
Force-dependent Abl activation requires EGFR and integrins
To test whether Abl are possible EGFR effector(s) in E-cadherin mechanotransduction, we monitored the phosphorylation of Crk-like protein (CrkL) in bead-twisting experiments. CrkL is a well-known target of Abl, and is commonly used as an Abl reporter (Bays et al., 2014; Plattner et al., 1999). Western blotting showed that there was an increase in the phosphorylated (p)CrkL levels after mechanically perturbing E-cadherin receptors on A431DECad-GFP cells, relative to no-load controls (Fig. 5).
Fig. 5.

Levels of phosphorylated CrkL after mechanically perturbing E-cadherin receptors. (A) Representative western blots for pCrkl (pY207), conducted after mechanically stimulating E-cad beads (+ Load) or not (− Load) bound to serum-starved A431DECad-GFP cells. Lamin B was used as a loading control. Cells were treated with gefitinib and DMSO, mEGF, with integrin-blocking antibodies 16G3 and AIIB2, and with the non-blocking 13G12 control. Data are also shown for positive controls (untreated) and an E-cadherin-negative control (DECMA-1 beads). The panels on the far right were measured in Ca2+ switch assays. (B) Bar graph of the percentage relative change as determined from densitometry analyses of the blots. The blot intensities for pCrkL were all normalized to Lamin B. The percentage changes in the normalized pCrkL levels were calculated relative to the normalized intensity for the ‘no load' condition. The bar on the far right indicates data from Ca2+ switch assays. Nexp=2.
Fig. 5B shows the relative force-dependent change of normalized pCrkL levels for experiments as in Fig. 5A. E-cadherin force loading increased pCrkL levels by 45±5% (mean±s.e.m.), relative to the no-load control. Use of beads coated with anti-E-cadherin antibody DECMA-1 reduced the relative pCrkL levels by 58±3%. Treatment with gefitinib decreased pCrkL levels by 31±7%, relative to no-load controls. In addition, mEGF treatment diminished this relative pCrkL change, as a decrease of 6±12% was observed. By contrast, pCrkL levels increased 39±18% in DMSO-treated control cells. Gefitinib or anti-integrin antibody treatment alone did not affect pCrkL levels significantly (Fig. S5A,B).
In MTC experiments, blocking the formation of new integrin adhesions with integrin-function-blocking 16G3 and AIIB2 antibodies decreased CrkL phosphorylation in A431DECad-GFP cells by 48±13%, relative to unloaded controls. However, pCrkL levels increased 35±12%, in cells treated with the non-blocking 13G12 control antibody (blocking versus non-blocking antibody: P=0.01, n=3) (Fig. 5B). Prior results have shown that the 16G3 and AIIB2 antibodies do not affect force-activated (EGFR-dependent) PI3K signaling upstream of integrins (Muhamed et al., 2016). To test whether integrins could also activate Abl, we treated cells with Mn2+, which is known to activate integrins (Bershadsky et al., 2003). We found that Mn2+ treatment, triggered a significant increase in the FRET-based Abl sensor signal (Fig. S7C). These results suggest that Abl activation is downstream of integrins in the E-cadherin force transduction pathway.
To investigate a potential link between adaptive stiffening, Abl activity, VCL accumulation and actin remodeling, we inhibited Abl with the inhibitor Imatinib (STI571). Treating MCF7 and A431DECad-GFP cells with this inhibitor prior to force loading E-cad beads abolished VCL recruitment, relative to untreated controls (Fig. 3B,C; Fig. S4A) (P=1×10⁻⁴, n=192). Fig. 4C and Fig. S4C also demonstrate that Abl inhibition suppresses actin accumulation at mechanically perturbed E-cad beads in A431DECad-GFP cells. Without the inhibitor, the actin density at beads increased by 92±11% after 2 min of force loading, relative to the no-load control (P=2×10⁻²¹; n=158). The inhibitor reduced adaptive cell stiffening to 6±2% (Fig. 1D), as expected if the stiffening reflects actin remodeling at the junctions (Icard-Arcizet et al., 2008). In primary SAECs, STI571 treatment similarly reduced adaptive cell stiffening and VCL recruitment (Fig. S1A,C). Taken together, these results support a model in which force-activated E-cadherin-mediated signaling activates Abl via integrins, and thus regulates VCL targeting to mechanically perturbed E-cadherin complexes (see Fig. 8).
Fig. 8.
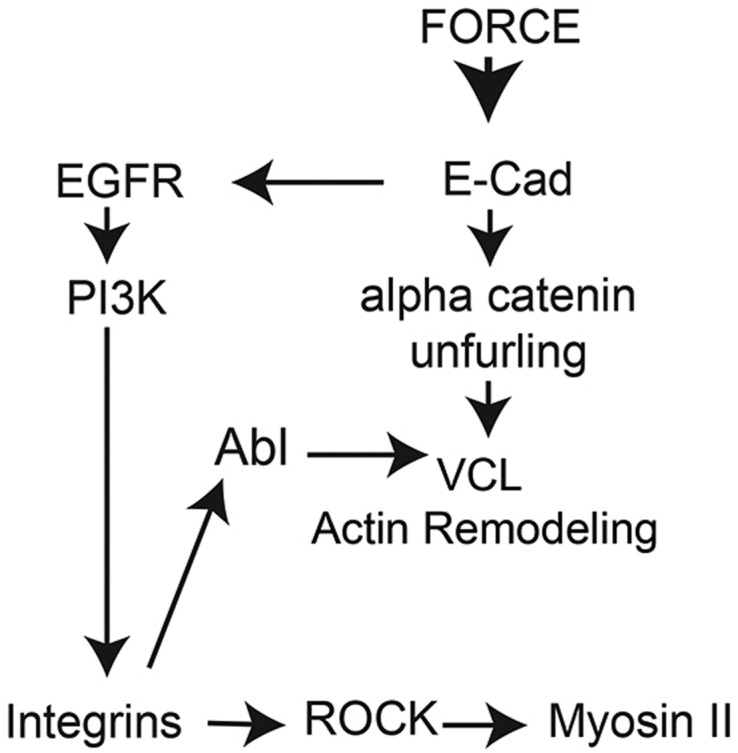
Proposed model for EGFR-dependent kinase cascade and feedback loop during E-cadherin force transduction. Force-loading E-cadherin bonds results in the EGFR-dependent activation of PI3K and downstream activation of integrins at the basal plane (Muhamed et al., 2016), as well as α-catenin unfurling. Results in this study suggest that integrin activation downstream from perturbed E-cadherin receptors, in turn, triggers the activation of Abl, which is required for VCL targeting to unfurled α-catenin at stressed E-cadherin junctions. This mechanosensitive pathway thus couples force-activated E-cadherin-mediated signaling to rapid and early VCL targeting to cadherin junctions. This positive-feedback loop, which reinforces stressed E-cadherin adhesions, requires EGFR kinase activity and integrin activation.
EGFR controls downstream Abl activation and VCL targeting to recovering E-cadherin junctions
One strategy used to alter the tension on cell–cell junctions is to remove Ca2+, which is required for the E-cadherin adhesive function. The subsequent re-addition of Ca2+ re-activates E-cadherin, and triggers an increase in tension at the recovering E-cadherin junctions. Recovering E-cadherin junctions are under increased tension. After such a Ca2+ switch, VCL accumulates at the reannealing junctions, and α-catenin undergoes force-activated conformation switching (Kim et al., 2015). To investigate whether EGFR and integrin activation also regulate Abl activity and VCL recruitment to recovering junctions, we monitored VCL and Abl activation, following the Ca2+ switch. Abl activation was monitored with a FRET-based Abl sensor. Phosphorylation of the Crk sequence in the sensor induces a conformational change that brings the YFP and ECFP fluorophores into close proximity, and increases the intramolecular FRET. Thus, an increase in the FRET to ECFP ratio (FRET:ECFP) indirectly reports increased Abl activity, by reporting the phosphorylation of its target Crk (Fig. 6A) (Ting et al., 2001). VCL accumulation was monitored by quantitative confocal immunofluorescence imaging of ROIs at intercellular junctions.
Fig. 6.

Abl is activated at reannealing intercellular junctions. (A) Schematic of the FRET-based Abl sensor its underlying mechanism of activation. Phosphorylation of the Crk substrate sequence by Abl brings the fluorophores CFP and YFP closer, and increases the ratio of the FRET signal to the ECFP signal (FRET:ECFP ratio). (B) Representative FRET:ECFP ratio images of individual Crk FRET-sensor transfected MCF7 cells within a monolayer, without (No Switch) and following the activation of junction recovery with a Ca2+ switch. The line around the cell indicates the cell perimeter and defines the analyzed ROI. Scale bar: 10 µm. (C) FRET:ECFP ratios versus time following the activation of junction recovery between MCF7 cells transiently transfected with the FRET-based Abl sensor. Data were obtained with cell clusters pretreated with EGTA (black circles, ‘Ca2+ Switch’) or with PBS with Ca2+ (white circles, ‘No Switch’) prior to exchanging the medium for cell culture medium with Ca2+, to activate junction recovery. In controls with single cells, the cells were similarly pretreated with EGTA, before adding Ca2+ containing culture medium (white triangles, ‘Single Cell Control’). Data are also shown for cells treated with gefitinib (white boxes) and DMSO (vehicle control, black boxes) prior to the Ca2+ switch. (D) FRET:ECFP ratio versus time following the activation of junction recovery between MCF7 cells transiently transfected with the FRET-based Abl sensor. Data are shown for cells pretreated with integrin function-blocking antibodies 16G3 and AIIB2 (white squares) or with non-blocking control 13G12 (black squares), prior to the Ca2+ switch. In ‘No Switch’ controls, cells were treated with 16G3 and AIIB2 (white circles) or with 13G12 (white triangles). ncells>5, Nexp=2.
Fig. 6B and Fig. S6 show the fluorescence images of MCF7 cells transiently transfected with the Abl reporter, after Ca2+ addition. The control cells were treated with 2 mM Ca2+-containing PBS, instead of EGTA (‘No Switch’ control). Fig. 6C shows the time-evolution of the Abl FRET:ECFP ratio in the cytosol of cells subjected to different treatments. After the Ca2+ switch, there was an initial increase in the Abl FRET:ECFP signal (‘Ca2+ Switch’ versus ‘No Switch’ control, P=0.0065, n=8, at t=4 min). The signal peaks ∼8–10 min after Ca2+ addition. Although there is a slight decrease after 10 min, the signal did not decay to baseline levels within 20 min. The latter behavior is most likely due to the convolution of Abl kinetics with additional dynamic processes underlying junction recovery. By contrast, in ‘No Switch’ controls, the Abl FRET:ECFP ratio did not increase significantly over the same time period. Additional western blots of pCrkL levels in A431DECad-GFP cells measured after the Ca2+ switch (see Fig. 5A,B) confirmed the results, by similarly showing a 19±2% (n=2) increase in pCrkL relative to ‘No Switch’ controls (Fig. 5A,B). Taken together, these results confirm that signals generated during junction recovery activate Abl.
Studies further tested whether increased tension at recovering junctions might regulate Crk phosphorylation, through signals downstream from EGFR, as in the bead-twisting studies. In support of this prediction, pre-treating cells with gefitinib completely ablated the increase in FRET from the following the Ca2+ switch relative to DMSO controls (Fig. 6C). In controls with single cells that do not form junctions, the absence of a FRET change after Ca2+ addition showed that the response was not due to Ca2+ changes, but rather to cadherin adhesion and junction reannealing (Fig. 6C).
Studies monitoring the Abl FRET sensor during the spreading of single MCF7 cells on fibronectin or on control, poly-L-lysine (PLL)-coated dishes verified that gefitinib does not directly affect integrin-dependent Abl activation (Fig. S7A; Lewis et al., 1996). The FRET ratios were normalized to the baseline FRET:ECFP ratio that was determined with adherent cells before trypsinization. The maximum 7±1% increase in the FRET:ECFP ratio was seen in cells during cell spreading on fibronectin, relative to the PLL control, and occurred 30 min after seeding cells (fibronectin versus PLL; P=0.014, n=11). Representative images of the FRET:ECFP ratios are shown in Fig. S7B. Gefitinib treatment did not affect the change in the Abl FRET:ECFP ratio, which increased 6±1% during single-cell spreading on fibronectin. These results indicate that, in both the junction recovery and bead-twisting measurements, gefitinib does not directly affect integrin-mediated Abl activation.
To determine whether Abl activation requires integrin activation or other kinases activated during junction recovery, cells expressing the Abl FRET sensor were pretreated with integrin function-blocking antibodies 16G3 and AIIB2, or with the 13G12 non-blocking control, prior to Ca2+ addition. In cells exposed to the non-blocking antibody, the increase in the Abl FRET:ECFP ratio after Ca2+ addition indicated Abl activation (‘no switch’ versus ‘Ca2+ switch’; P=0.0007, n=11, at t=4 min). By contrast, the integrin function-blocking antibodies 16G3 and AIIB2 abolished Abl activation, and the FRET:ECFP ratios were similar to those in ‘no switch’ controls (P=0.9, n=7, at t=4 min) (Fig. 6D). In control cells pretreated with PBS containing 2 mM Ca2+, instead of EGTA, junctions were not disrupted, and the antibody treatments had no effect on the FRET signal after the buffer change (Fig. 6D). This latter finding verified that the antibodies alone did not affect the fluorescence change. These findings suggest that integrin activation during intercellular junction recovery in turn regulates Abl activation. The data further suggest that the activation of Abl following E-cadherin force loading requires EGFR activity (Fig. 6D); namely, blocking EGFR function blocks E-cadherin-stimulated integrin activation, CrkL phosphorylation, Abl activation and recruitment of VCL to mechanically perturbed E-cadherin receptors.
EGFR activity is required for VCL recruitment, but not for α-catenin conformation switching, during junction reannealing
We next tested whether inhibiting EGFR function blocks force-activated VCL recruitment to reannealing junctions, as in the bead-twisting studies. At junctions between MCF7 cells at 20 min after the Ca2+ switch, VCL accumulation increased by 51±13% (mean±s.e.m.; P=10−7, n=61) (Fig. 7A,B). Compared with the 40±9% increase in DMSO-treated control cells, gefitinib treatment significantly diminished the increase in VCL accumulation to 8±7% (gefitinib versus DMSO; P=0.008, n=51). This result is consistent with the finding that EGFR inhibition also blocked Abl activation in this assay.
Fig. 7.

EGFR inhibition eliminates VCL recruitment to reannealing E-cadherin junctions. (A) Representative confocal immunofluorescence images of VCL accumulation at junctions between MCF7 cells, immediately before (0 min) and after (20 min) a Ca2+ switch. Cells were treated with DMSO (top panels) or with gefitinib (bottom panels). Scale bar: 10 µm. (B) Bar graphs of the mean relative VCL intensity at intercellular junctions 20 min after the Ca2+ switch. Data show results with untreated cells, and with cells pretreated with gefitinib or DMSO. Measurements at 20 min were normalized to the t=0 values. njunctions>50, Nexp=2. ***P<0.001 (Student's t-test).
To verify that EGFR inhibition does not affect any kinases that might phosphorylate α-catenin (Escobar et al., 2015) and alter the conformation switching required for VCL recruitment, we tested whether EGFR inhibition altered the α-catenin conformation. To do this we used a FRET-based α-catenin conformation sensor, which undergoes a change in the FRET signal upon α-catenin activation (Kim et al., 2015). At 15 min after the Ca2+ switch (Fig. S8A,B), the α-catenin FRET:ECFP ratio decreased by 3±2% in gefitinib-treated cells, which is comparable to the change in DMSO-treated control cells (P=0.997, n=10), indicating that the α-catenin conformation change is not affected by EGFR or its downstream kinases.
DISCUSSION
This study reports new findings that link force-activated E-cadherin-mediated signaling via EGFR to VCL phosphorylation and its targeting to α-catenin in force-loaded cadherin complexes. α-catenin conformation switching and VCL recruitment to intercellular junctions are hallmarks of cadherin-based force transduction (Huveneers et al., 2012; Kim et al., 2015; le Duc et al., 2010; Leckband and de Rooij, 2014; Leerberg et al., 2014; Leerberg and Yap, 2012; Thomas et al., 2013; Twiss et al., 2012). By recruiting Mena/VASP family proteins, VCL facilitates actin remodeling and the further mechanical reinforcement of stressed cell–cell junctions (Leerberg et al., 2014). VCL is primarily associated with focal adhesions, and Abl controls its recruitment to stressed cadherin complexes at intercellular junctions (Bays et al., 2014).
These new results support a model in which force fluctuations on E-cadherin complexes activate EGFR signaling and downstream integrins, to form a positive-feedback loop that couples E-cadherin force transduction to the Abl-dependent recruitment of VCL to intercellular junctions (Fig. 8). We previously showed that, in addition to activating α-catenin conformation switching, perturbing E-cadherin receptors also triggered an EGFR-dependent kinase cascade that increased cell contractility, by activating integrins and Rho/ROCK-dependent myosin contractility (Muhamed et al., 2016). Herein, we confirmed the prior results that were obtained via siRNA-mediated EGFR knockdown, but further demonstrated that the force-activated kinase cascade links E-cadherin force transduction to VCL recruitment. We demonstrated this mechanism both in idealized bead-twisting experiments and at recovering junctions in epithelial monolayers.
Surprisingly, blocking EGFR function abolished both adaptive cell stiffening and VCL recruitment to perturbed E-cadherin adhesions. The absence of VCL was not due to impaired α-catenin conformation switching, which is not under EGFR control. Instead, studies with integrin-function-blocking antibodies showed that integrin activation downstream from EGFR is required to activate Abl, which was shown to phosphorylate VCL and target it to junctions (Fig. 8) (Bays et al., 2014). Studies with a FRET-based Abl sensor and western blots confirmed that acute E-cadherin force loading, both in bead-twisting assays and at recovering intercellular junctions, results in Abl activation.
Several factors activate Abl. These proteins are substrates of Src family kinases (Pendergast, 2002), and are reportedly directly activated by β1-integrins (Simpson et al., 2015). Abl is also activated by receptor tyrosine kinases and by PI3K (Lewis et al., 1996; Plattner et al., 1999, 2003), which we previously demonstrated are both activated following E-cadherin force loading (Muhamed et al., 2016). Our FRET measurements demonstrated that SFKs are activated downstream from EGFR at re-annealing cadherin junctions. This could result from direct Src activation by EGFR or other mechanisms (McLachlan et al., 2007; Truffi et al., 2014). However, results obtained with integrin-function-blocking antibodies demonstrated that Abl activity and VCL targeting to E-cadherin adhesions appear to be under integrin control. Although the mechanism governing selective VCL targeting to cadherin adhesions has yet to be established, results from this study link cadherin-mediated force transduction signals to the regulation of VCL recruitment to mechanically perturbed junctions.
Our findings revealed links between EGFR, cadherin, integrins, Abl activity and cell stiffening, but we cannot rule out the possibility that other mechanisms also regulate Abl. The pCrkL levels decreased after force loading E-cadherin with DECMA-1-beads as well as in mechanically perturbed cells after treating with integrin function-blocking antibodies or gefitinib. We do not yet know the reason for these decreases, but they hint at the existence of additional force-sensitive mechanisms of Abl regulation.
The discovery of receptor tyrosine kinase (RTK) involvement in intercellular force transduction is relatively recent. In the vascular endothelium, PECAM-1-dependent flow sensing requires VE-cadherin and VEGFR2 or VEGFR3 (Chen and Tzima, 2009; Conway et al., 2013; Coon et al., 2015). In particular, PECAM-1 force loading activates VE-cadherin-associated VEGFR2 and downstream integrins, very similar to the mechanism described in this study (Collins et al., 2012). VE-cadherin association with VEGF receptors determines the fluid shear stress at which endothelial cells align with flow (Coon et al., 2015). Furthermore, in endothelial monolayers subjected to pathological levels of cyclic stretch, VEGFR2 dissociates from VE-cadherin, resulting in VEGFR2 activation and VE-cadherin internalization (Tian et al., 2016). Although we do not see any E-cadherin internalization on the timescales of our measurements, the above-mentioned studies linked increased tension on intercellular junctions to RTK activation, as we report here.
There is circumstantial evidence linking EGFR activation to E-cadherin force transduction. E-cadherin association with EGFR suppresses EGF-dependent cell proliferation (Gumbiner and Kim, 2014; McClatchey and Yap, 2012). However, epithelial cells cultured on stiff substrates are sensitive to lower EGF concentrations than cells on softer matrices (Kim and Asthagiri, 2011; Kim et al., 2009). Substrate stiffness increases tension at cell–cell contacts (Liu et al., 2010; Maruthamuthu et al., 2011). Consequently, the correlations between substrate rigidity and EGF sensitivity could reflect similar tension-dependent E-cadherin-mediated activation of EGFR. Investigations of collective cell migration also suggested a possible link between interepithelial tension, mechanotransduction and the tumor suppressor merlin (also known as NF2), which simultaneously binds E-cadherin complexes and EGFR (Curto et al., 2007; Gladden et al., 2010). Merlin at cell–cell contacts reportedly acts as a force transducer to coordinate collective cell migration (Das et al., 2015). Whether the latter observation is linked to EGFR signaling remains to be established.
These results do not contradict the previous model of α-catenin-based force transduction (Yonemura et al., 2010). α-catenin is essential, as it links cadherin to the cytoskeleton and enables force transmission, and docks VCL at cadherin junctions to facilitate actin remodeling. The present findings show that force-dependent EGFR signaling coordinates with α-catenin-mediated force transduction to control integrin-mediated cell contractility and Abl-dependent VCL targeting to mechanically stimulated cadherin junctions. EGFR and α-catenin thus serve complimentary and integrated roles in cadherin mechanotransduction.
Beyond force-activated RTK-dependent signaling cascades, these results have broader implications. Namely, E-cadherin-activated signals increase cell contractility and also feedback to regulate the early VCL recruitment that controls cytoskeletal reinforcement at stressed intercellular junctions. This further demonstrates that the early events in cadherin-mediated force transduction do not occur solely at cell–cell junctions, but require additional signaling cascades. The major findings of this study support a model in which EGFR is a key component in the E-cadherin force transduction machinery (Fig. 8). Given the similarities with other classical cadherins (Baeyens et al., 2015; Barry et al., 2014, 2015; Coon et al., 2015; Tabdili et al., 2012), we speculate that similar mechanisms govern force transduction by other classical cadherin subtypes in different tissues.
MATERIALS AND METHODS
Cell lines and reagents
Michigan Cancer Foundation-7 (MCF7) human epithelial breast carcinoma cells were from the ATCC. Human small airway epithelial cells (SAECs) were from Lonza. A431D epidermoid carcinoma cells, which do not express endogenous E-cadherin, were from Dr Keith Johnson (University of Nebraska, Lincoln, NE) (Kim et al., 2000). A431D cells are known to express high levels of EGFR. A full-length human E-cadherin–GFP plasmid (Addgene plasmid #28009, deposited by Jennifer Stow; Miranda et al., 2001) was used to generate a stable E-cadherin–GFP-expressing A431D cell line, A431DECad-GFP (Shashikanth et al., 2016). An A431DECad-mCherry cell line was constructed similarly with a plasmid expressing E-cadherin–mCherry. The cells were selected for populations with similar median GFP or mCherry intensity, indicating similar cadherin expression, by fluorescence activated cell sorting (FACS) (FACS ARIA II sorter, Edward R. Madigan Laboratory, IL). The MCF7 and A431D cells were cultured in Dulbecco's modified Eagle's medium (DMEM, 4.5 g/l glucose) supplemented with 10% (v/v) fetal bovine serum (FBS), 1 mM sodium pyruvate and 1% (v/v) penicillin–streptomycin (Corning Cell Grow, Manassas, VA), and maintained in a 5% CO2 atmosphere at 37°C. The stable A431DECad-GFP and A431DEcad-mCherry cells were cultured in medium supplemented with geneticin sulfate (400 μg/ml). SEACs were cultured in SEAC growth medium (SAGM, Lonza).
The soluble, recombinant E-cadherin extracellular fragment tagged with the C-terminal Fc domain of human IgG (E-cad-Fc) was purified from human embryonic kidney cells (HEK293T) engineered to stably express and secrete E-cad-Fc. The protein was purified by affinity chromatography, followed by gel filtration, as described previously (Prakasam et al., 2006).
Antibodies and inhibitors
Integrin function was blocked with two different antibodies. The anti-β1-integrin antibody AIIB2 (1:20 dilution) was produced by a hybridoma provided by Johan de Rooij (Hubrecht Institute, The Netherlands). The anti-fibronectin antibody 16G3 (20 µg/ml) and control antibody 13G12 (3.6 µg/ml), which does not inhibit integrin binding to fibronectin, were from Kenneth Yamada (NIH, Bethesda, MD) (Nagai et al., 1991). The EGF-neutralizing human monoclonal anti-EGF antibody (5 µg/ml) was from R&D Systems (Minneapolis, MN: mouse IgG1, clone #10825) (Sakaguchi et al., 2008). The non-competitive EGFR-specific inhibitor gefitinib (IRESSA) and the Abl inhibitor Imatinib Mesylate (STI571) were from Selleckchem (Houston, TX).
EGFR knockdown and inhibition
A431DECad-GFP cells were transfected with either EGFR siRNA (Santa Cruz Biotechnology, CA, sc29301) to knockdown EGFR expression or with control siRNA (Santa Cruz Biotechnology, CA, sc37007). We used A431D cells because of their high EGFR expression levels, which enable western blot analyses. Following the manufacturer's protocol, siRNA diluted in transfection medium (Santa Cruz Biotechnology, CA, sc36868) was incubated for 45 min with the transfection reagent (Santa Cruz Biotechnology, CA, sc29528), also diluted in transfection medium. After the cells were washed with siRNA transfection medium, they were incubated with the mixture for 5 h. The cells were then used for both western blotting, to verify EGFR knockdown, and MTC measurements at 48 h following the addition of growth medium. The siRNA transfection protocol was followed when co-transfecting cells with both EGFR siRNA and the PH-Akt–GFP plasmid.
In MTC measurements and in Ca2+ switch junction recovery assays, EGFR was inhibited by treatment with the noncompetitive inhibitor gefitinib at 15 µM for 2 h prior to either bead twisting or to the disruption of junctions with EGTA. Abl was inhibited by STI571 treatment at 10 μM for 40 min (Bays et al., 2014) prior to bead-twisting measurements. In MTC measurements, EGFR function was also blocked by treatment with the EGF-neutralizing antibody at 5 µg/ml for 30 min, prior to initiating bead twisting (Muhamed et al., 2016). The EGF-neutralizing antibody was not used in junction recovery measurements due to the amount of antibody required.
Blocking integrin function
To block the formation of new integrin adhesions in both bead twisting experiments and junction recovery assays, cells were briefly treated (20 min) with anti-β1 integrin antibody AIIB2 (1:20 dilution) and with the anti-fibronectin antibody 16G3 (20 µg/ml), or with control antibody 13G12 (3.6 µg/ml). In prior studies, the brief antibody treatment did not disrupt mature focal adhesions (Muhamed et al., 2016). In MTC measurements, cells were treated with both AIIB2 (1:20 dilution) and 16G3 (20 µg/ml) for 20 min prior to initiating bead twisting. In junction recovery experiments, the cells were pre-treated with the antibodies 20 min prior to the addition of EGTA, which disrupts E-cadherin junctions.
Magnetic twisting cytometry
Magnetic twisting cytometry (MTC) was used to mechanically perturb E-cadherin receptors, and has been described previously (le Duc et al., 2010; Wang and Ingber, 1995). Carboxyl ferromagnetic beads (4.5 µm diameter, Spherotech, Lake Forest, IL) were covalently modified with human E-cadherin-Fc (E-cad-beads). The carboxyl-functionalized beads were activated by treatment with 1-ethyl-3-(3-dimethylaminopropyl)-carbodiimide hydrochloride (EDC, Sigma-Aldrich, St Louis, MO) and N-hydroxysuccinimide (NHS, Thermo Scientific, Rockford, IL), centrifuged at 12,000 rpm for 5 min with an Eppendorf 5415C benchtop centrifuge, and then suspended in buffer, as described previously (Barry et al., 2015). The activated beads were treated with 10 μg of E-cad-Fc, and agitated for 2 h at 4°C on an orbital rocker. After protein immobilization, the beads were again rinsed to remove unbound E-cad-Fc. Control beads were similarly modified with the blocking anti-E-cadherin antibody DECMA-1 (Sigma-Aldrich, U3254).
The E-cad-Fc-modified ferromagnetic beads (E-cad beads) were incubated with confluent cell monolayers for 40 min at 37°C under an atmosphere of 5% CO2. Beads adhere randomly on the surface of the cells. After magnetizing the beads with an initial, brief magnetic pulse parallel to the cell plane, an orthogonal twisting torque was applied to the magnetized beads using an oscillating field of 60 Gauss at a frequency of 0.33 Hz. The twisting torque (T) generated a shear stress (force/area) of ∼7.4 Pa on the membrane-bound cadherin receptors. To record the stiffening response, the bead displacements (D) were imaged with an inverted microscope (Leica) equipped with a 20×/0.6 NA objective. We determine the viscous and elastic moduli of the bead–cell junctions, although changes primarily reflect differences in the elastic moduli, and hence the junction stiffness.
The twisting torque was applied for 2 or 5 min, which previous studies showed causes a significant increase in stiffness (Barry et al., 2014; le Duc et al., 2010; Muhamed et al., 2016). In all cases, the bead coatings were optimized to both bind cells and undergo displacements sufficient to measure the viscoelastic moduli of bead–cell junctions (Barry et al., 2014, 2015; le Duc et al., 2010; Tabdili et al., 2012; Twiss et al., 2012).
The stiffening changes were quantified in cells loaded with single beads, although cells with two beads were included infrequently. Some images in this article show cells with multiple bound beads, but only cells with single attached beads were considered for analyses. The specific modulus follows a lognormal distribution, from which we obtained the mean and s.e.m. (le Duc et al., 2010; Wang et al., 1993). Typically, we analyzed bead displacements on ∼150 cells to obtain sufficient statistics. The junction stiffness is reported as the mean±s.e.m. in the text.
Confocal imaging
The force-activated recruitment of VCL and/or actin at perturbed E-cad beads was quantified by confocal immunofluorescence imaging. MCF7 cells, A431DECad-GFP cells and SAECs on collagen-coated glass dishes were serum starved [0.2% (v/v) serum] for 12 h before MTC measurements. Immediately after 5 min of force loading E-cad beads, cells were washed with PBS and fixed with 4% (v/v) paraformaldehyde (Sigma) in PBS at room temperature for 15 min. After PBS washes, the samples were permeabilized with 0.1% Triton X-100 in PBS for 6 min. The cells were blocked with 1% (w/v) bovine serum albumin (BSA) for 30 min at room temperature, and washed with PBS. Next, to stain VCL, cells were incubated for 1 h at room temperature with a mouse anti-VCL antibody (1:200, Sigma, V9131) in PBS containing 1% BSA. The goat anti-mouse-IgG conjugated to Alexa Fluor 647 (1:200, Invitrogen, A21236) in PBS containing 1% BSA, was incubated with the fixed cells for 1 h at room temperature, and then washed three times with PBS. Actin was visualized with Rhodamine–phalloidin (1:250, Invitrogen, R415). Cells were mounted with ProLong Gold Anti-Fade (Invitrogen). For quantifying VCL accumulation at cell junctions after a Ca2+ switch, cells were fixed immediately after junction disruption with 4 mm EGTA in DMEM (t=0), and 20 min after Ca2+-containing medium was added back. The fixed cells were stained for VCL and imaged. Confocal images were acquired with a Zeiss LSM 700 confocal microscope with a 40×/1.3 NA oil immersion objective. The images obtained were processed with ImageJ, with background subtracted from a rectangular region inside the cell cytosol, the mean fluorescence intensity (MFI) of VCL was analyzed in a circular ROI between the bead periphery and a ring 1 µm away, as previously described (Barry et al., 2015). Control cells were not subjected to bead twisting (no load), but all conditions were otherwise identical. Presented results are normalized to the no-load condition. At least 80 cells were analyzed for each condition for statistical significance.
For FnIII9-11–GST staining, immediately after force loading, cells were incubated with FnIII9-11–GST for 30 min, and then fixed with 4% paraformaldehyde. GST was stained with mouse anti-GST antibody (1:200, ThermoScientific, MA4-004) and goat anti-mouse-IgG conjugated to Alexa Fluor 647 secondary antibody for 1 h at room temperature. Images were analyzed by quantifying the mean fluorescence intensity over the entire cell.
The activation of phosphoinositide 3-kinase (PI3K) at mechanically perturbed beads was monitored with the GFP-tagged pleckstrin homology (PH) domain of Akt (PH-Akt–GFP) (Collins et al., 2012; Muhamed et al., 2016). Cells were transiently transfected with the plasmid encoding PH-Akt–GFP (gift from Dr Yingxiao Wang, UCSD, San Diego, CA) and seeded onto collagen-coated glass-bottom dishes. The accumulation of PH-Akt–GFP to ROIs at beads was quantified in cells, with and without 5 min of force-loading as described previously (Muhamed et al., 2016). After subtracting background measured in a region within the cytosol, mean fluorescence intensities were normalized to the control no-load condition. To assess the impact of EGFR on the force activation of PI3K, cells were transiently co-transfected with the PH-Akt–GFP plasmid and either EGFR siRNA or control scrambled siRNA. Cells were used 48 h later.
Junction recovery assays
These studies investigated molecular events during junction recovery after a Ca2+ switch. Cells were grown to confluence, and then serum starved [0.2% (v/v) serum] for 12 h. They were then treated with 3 mM EGTA in PBS for 2 min, to inactivate cadherins and disrupt the junctions. Next, the cells were washed with Ca2+-free PBS to remove EGTA, and then junction reannealing was initiated (t=0 min), by adding serum-free medium with 2 mM Ca2+, which reactivates cadherins and initiates junction recovery. In control ‘no switch’ measurements, Ca2+-containing PBS was added instead of the EGTA solution. Otherwise the time sequence of solution changes was the same.
FRET measurements during junction recovery
Crk activation at reannealing E-cadherin junctions
We imaged Crk activation during the recovery of E-cad junctions between MCF7 cells, following the Ca2+ switch. Crk activation was monitored in real time with a fluorescence resonance energy transfer (FRET)-based Crk sensor (Ting et al., 2001), which is illustrated in Fig. 6A.
The plasmid encoding the sensor was a gift from Roger Tsien, and consisted of the complete chicken c-CrkII gene incorporated between the sequences for enhanced yellow fluorescence protein (EYFP) and enhanced cyan fluorescent protein (ECFP) (Ting et al., 2001). MCF7 cells were transiently transfected with the Crk sensor by using Lipofectamine 2000 (Invitrogen, Carlsbad, CA), following the manufacturer's instructions, and were used 48 h later.
During the junction recovery assay, the cells were imaged 2 min prior to Ca2+ addition (t=–2 min). Then after Ca2+ addition (t=0 min), images were recorded every 2 min for 18 min with a Zeiss Axiovert 200 M microscope equipped with a Photometrics 512 Evolve EMCCD camera (Beckmann Institute, University of Illinois, IL). The obtained images were analyzed by using the customized MATLAB program Fluocell (Lu et al., 2008, 2011). The region of interest (ROI) in the cytosol of the desired cell was manually selected, and the Fluocell program tracked the ROI automatically during junction recovery. The FRET:ECFP ratio was obtained after subtracting background from a cell-free region in both donor and acceptor fluorescent channels. The average FRET:ECFP ratio for all time points were normalized to the average FRET:ECFP ratio obtained prior to junction recovery, and then plotted against the time before and after Ca2+ addition.
To determine the impact of EGFR on Crk activation at reannealing junctions, cells were pretreated with 15 µM gefitinib or DMSO (vehicle control) 2 h before disrupting junctions with EGTA. To test the role of integrins in Crk activation during junction recovery, cells were pretreated with the integrin function-blocking antibodies AIIB2 and 16G3, or with the non-blocking 13G12 control antibody, for 20 min before junction disruption with EGTA.
α-Catenin conformation switching and Src kinase activation
To investigate α-catenin and the activation of Src family kinases during junction recovery measurements, we used MCF7 cells transiently transfected with either a FRET-based α-catenin conformation sensor (Kim et al., 2015) or a FRET-based Src sensor (Wang et al., 2005). A monolayer of MCF7 cells transfected with either the α-catenin or the Src FRET sensor was incubated with 4 mM EGTA in DMEM for 15 to 20 min, until junction disruption was apparent in differential interference contrast (DIC) images. Cells transfected with the KRas-Src-FRET sensor were imaged using a wide-field Zeiss Axiovert 200 M microscope, and cell junctions were analyzed from images with the customized MATLAB program Fluocell. Fluorescence images were collected immediately prior to Ca2+ addition at t=0 min. The medium was then exchanged for DMEM containing 0.2% (v/v) FBS and 2 mM Ca2+, which restored the adhesive function of E-cadherin. The FRET:ECFP ratios for the Src FRET sensor were determined at 15 and 30 min after Ca2+ addition, because prior results indicated that the signal intensity peaks at ∼30 min.
The FRET:ECFP ratio for the α-catenin FRET sensor was determined during junction recovery, using the same conditions as described for the Src-FRET measurements above. Fluorescence images were obtained with a Zeiss Axiovert 200 inverted microscope (Beckmann Institute, University of Illinois, IL), and regions of interest at intercellular junctions were analyzed with MetaFluor 6.2 imaging software, in order to quantify changes in the α-catenin conformation at cell junctions during junction recovery. The FRET:ECFP ratio for the α-catenin FRET sensor was measured at 15 min after Ca2+ addition, because prior studies showed that the conformation change during junction recovery was complete within this time period.
Integrin dependence of Abl activation
FRET-based Abl sensor
To assess the role of integrins in Abl activation, Abl activity was monitored in individual cells during spreading on fibronectin-coated substrates, following published procedures (Lewis et al., 1996). Glass-bottom dishes were coated with 25 µg/ml fibronectin (FN, EMD Millipore, FC010), or poly-L-lysine control (PLL, Sigma) in PBS for 1 h at 37°C, and then blocked with 10 mg/ml of heat-denatured BSA in PBS (pH 7.4) for 1 h at 37°C. MCF7 cells transiently transfected with the Crk-FRET sensor were briefly trypsinized, washed and plated on FN- or PLL-coated dishes in DMEM. After incubation at 37°C for 30 min, single cells were imaged using a widefield Zeiss Axiovert 200 M microscope, and images were analyzed with the customized MATLAB program Fluocell (Lu et al., 2008, 2011).
Western blot analyses
Western blot analyses were used to verify the phosphorylation of Crk-like protein, CrkL during E-cadherin force transduction, and to verify the siRNA-mediated knockdown of EGFR expression. To assess CrkL phosphorylation in MTC experiments, cells were serum starved [0.2% (v/v) serum] for 12 h before force-loading E-cadherin receptors. Cells were rinsed with PBS and lysed, and lysate was mixed with sample buffer containing 50 mM Tris-HCl pH 6.8, 5% 2-mercaptoethanol, 2% SDS, 0.01% Bromophenol Blue and 10% glycerol. The sample was boiled for 5 min and the supernatant was clarified by centrifugation at 12,000 rpm for 5 min with an Eppendorf 5415C benchtop centrifuge. The proteins were then separated by SDS-PAGE, and transferred onto a PVDF membrane (15 V, 45 min). Subsequently the membrane was blocked with 5% (w/v) BSA in TBST (10 mM Tris-HCl pH 7.4, 150 mM NaCl, 0.05% Tween-20) for 1 h at room temperature. The membrane was incubated at 4°C overnight with mouse anti-pCrkL (pY207) antibody (1:1000, R&D Systems, MAB6910-SP) or with rabbit anti-EGFR antibody (1:1000, Cell Signaling Technology, 2232S) in TBST containing 1% BSA. For the loading control, the samples were incubated at room temperature for 1 h with mouse anti-Lamin B antibody (1:3000, Abcam, ab20396) or with a mouse anti-actin antibody (1:5000, BD Transduction, 612656) in TBST containing 1% BSA. After incubation, the membrane was washed three times with TBST, incubated with horseradish peroxidase (HRP)-conjugated anti-rabbit IgG (1:5000, Sigma) or anti-mouse IgG (1:3000, Promega) antibody for 1 h, and then quantified with an enhanced chemiluminescence system (Amersham, Arlington Heights, IL). ImageJ was used to quantify changes in protein levels from densitometry scans.
We further assessed CrkL phosphorylation during the recovery of junctions between A431DECad-GFP cells. Cells were serum starved [0.2% (v/v) serum] for 12 h before treating them with 3 mM EGTA to disrupt junctions. Junction recovery was activated immediately after junction disruption by adding serum-free DMEM containing 2 mM Ca2+. The cells were lysed after 5 min and CrkL phosphorylation levels were assessed by western blotting. The phosphorylation was compared to that in control cells that were treated with Ca2+ containing PBS, instead of the EGTA solution (‘no switch’ control).
Statistical analysis
P-values were calculated from two-tailed Student's t-tests to compare the means of data from two different experimental groups in Microsoft Excel. In this study, P<0.05 was taken as being statistically significant. The s.e.m. determined for a set of replicate experiments were calculated from the pooled standard deviations of normalized data for each experiment. The number, n, of different bead–cell pairs analyzed in MTC studies to assess adaptive stiffening or protein recruitment beads required for statistical significance were based on prior studies (Barry et al., 2014, 2015; le Duc et al., 2010; Muhamed et al., 2016; Tabdili et al., 2012). Averages reflect data from at least two independent experiments (Nexp), as specified in the figures.
Supplementary Material
Acknowledgements
We thank Saiko Rosenburger for technical assistance.
Footnotes
Competing interests
The authors declare no competing or financial interests.
Author contributions
Conceptualization: J.W., D.L.; Methodology: P.S., X.K., J.W., R.S., X.T., D.L.; Software: R.S., X.T.; Validation: D.L.; Formal analysis: P.S., X.K.; Investigation: J.W.; Resources: D.L.; Data curation: P.S., X.K.; Writing - original draft: P.S., X.K.; Writing - review & editing: D.L.; Supervision: P.S., D.L.; Project administration: D.L.; Funding acquisition: D.L.
Funding
This work was supported by the National Institutes of Health (NIH) (GM RO1 097443) and the National Science Foundation (NSF) (CMMI 14-62739). Deposited in PMC for release after 12 months.
Supplementary information
Supplementary information available online at http://jcs.biologists.org/lookup/doi/10.1242/jcs.206656.supplemental
References
- Baeyens N., Nicoli S., Coon B. G., Ross T. D., Van den Dries K., Han J., Lauridsen H. M., Mejean C. O., Eichmann A., Thomas J. L., et al. (2015). Vascular remodeling is governed by a VEGFR3-dependent fluid shear stress set point. Elife 4, e04645 10.7554/eLife.04645 [DOI] [PMC free article] [PubMed] [Google Scholar]
- Barry A. K., Tabdili H., Muhamed I., Wu J., Shashikanth N., Gomez G. A., Yap A. S., Gottardi C. J., de Rooij J., Wang N. et al. (2014). alpha-Catenin cytomechanics: role in cadherin-dependent adhesion and mechanotransduction. J. Cell Sci. 127, 1779-1791. 10.1242/jcs.139014 [DOI] [PMC free article] [PubMed] [Google Scholar]
- Barry A. K., Wang N. and Leckband D. E. (2015). Local VE-cadherin mechanotransduction triggers long-ranged remodeling of endothelial monolayers. J. Cell Sci. 128, 1341-1351. 10.1242/jcs.159954 [DOI] [PMC free article] [PubMed] [Google Scholar]
- Bays J. L., Peng X., Tolbert C. E., Guilluy C., Angell A. E., Pan Y., Superfine R., Burridge K. and DeMali K. A. (2014). Vinculin phosphorylation differentially regulates mechanotransduction at cell-cell and cell-matrix adhesions. J. Cell Biol. 205, 251-263. 10.1083/jcb.201309092 [DOI] [PMC free article] [PubMed] [Google Scholar]
- Bershadsky A. D., Balaban N. Q. and Geiger B. (2003). Adhesion-dependent cell mechanosensitivity. Annu. Rev. Cell Dev. Biol. 19, 677-695. 10.1146/annurev.cellbio.19.111301.153011 [DOI] [PubMed] [Google Scholar]
- Buckley C. D., Tan J., Anderson K. L., Hanein D., Volkmann N., Weis W. I., Nelson W. J. and Dunn A. R. (2014). Cell adhesion. The minimal cadherin-catenin complex binds to actin filaments under force. Science 346, 1254211 10.1126/science.1254211 [DOI] [PMC free article] [PubMed] [Google Scholar]
- Butcher D. T., Alliston T. and Weaver V. M. (2009). A tense situation: forcing tumour progression. Nat. Rev. Cancer 9, 108-122. 10.1038/nrc2544 [DOI] [PMC free article] [PubMed] [Google Scholar]
- Califano J. P. and Reinhart-King C. A. (2010). Exogenous and endogenous force regulation of endothelial cell behavior. J. Biomech. 43, 79-86. 10.1016/j.jbiomech.2009.09.012 [DOI] [PubMed] [Google Scholar]
- Chen Z. and Tzima E. (2009). PECAM-1 is necessary for flow-induced vascular remodeling. Arterioscler. Thromb. Vasc. Biol. 29, 1067-1073. 10.1161/ATVBAHA.109.186692 [DOI] [PMC free article] [PubMed] [Google Scholar]
- Collins C., Guilluy C., Welch C., O'Brien E. T., Hahn K., Superfine R., Burridge K. and Tzima E. (2012). Localized tensional forces on PECAM-1 elicit a global mechanotransduction response via the integrin-RhoA pathway. Curr. Biol. 22, 2087-2094. 10.1016/j.cub.2012.08.051 [DOI] [PMC free article] [PubMed] [Google Scholar]
- Conway D. E., Breckenridge M. T., Hinde E., Gratton E., Chen C. S. and Schwartz M. A. (2013). Fluid shear stress on endothelial cells modulates mechanical tension across VE-cadherin and PECAM-1. Curr. Biol. 23, 1024-1030. 10.1016/j.cub.2013.04.049 [DOI] [PMC free article] [PubMed] [Google Scholar]
- Coon B. G., Baeyens N., Han J., Budatha M., Ross T. D., Fang J. S., Yun S., Thomas J. L. and Schwartz M. A. (2015). Intramembrane binding of VE-cadherin to VEGFR2 and VEGFR3 assembles the endothelial mechanosensory complex. J. Cell Biol. 208, 975-986. 10.1083/jcb.201408103 [DOI] [PMC free article] [PubMed] [Google Scholar]
- Curto M., Cole B. K., Lallemand D., Liu C.-H. and McClatchey A. I. (2007). Contact-dependent inhibition of EGFR signaling by Nf2/Merlin. J. Cell Biol. 177, 893-903. 10.1083/jcb.200703010 [DOI] [PMC free article] [PubMed] [Google Scholar]
- Das T., Safferling K., Rausch S., Grabe N., Boehm H. and Spatz J. P. (2015). A molecular mechanotransduction pathway regulates collective migration of epithelial cells. Nat. Cell Biol. 17, 276-287. 10.1038/ncb3115 [DOI] [PubMed] [Google Scholar]
- Elosegui-Artola A., Bazellières E., Allen M. D., Andreu I., Oria R., Sunyer R., Gomm J. J., Marshall J. F., Jones J. L., Trepat X. et al. (2014). Rigidity sensing and adaptation through regulation of integrin types. Nat. Mater. 13, 631-637. 10.1038/nmat3960 [DOI] [PMC free article] [PubMed] [Google Scholar]
- Elosegui-Artola A., Oria R., Chen Y., Kosmalska A., Pérez-González C., Castro N., Zhu C., Trepat X. and Roca-Cusachs P. (2016). Mechanical regulation of a molecular clutch defines force transmission and transduction in response to matrix rigidity. Nat. Cell Biol. 18, 540-548. 10.1038/ncb3336 [DOI] [PubMed] [Google Scholar]
- Engler A. J., Sen S., Sweeney H. L. and Discher D. E. (2006). Matrix elasticity directs stem cell lineage specification. Cell 126, 677-689. 10.1016/j.cell.2006.06.044 [DOI] [PubMed] [Google Scholar]
- Escobar D. J., Desai R., Ishiyama N., Folmsbee S. S., Novak M. N., Flozak A. S., Daugherty R. L., Mo R., Nanavati D., Sarpal R. et al. (2015). alpha-Catenin phosphorylation promotes intercellular adhesion through a dual-kinase mechanism. J. Cell Sci. 128, 1150-1165. 10.1242/jcs.163824 [DOI] [PMC free article] [PubMed] [Google Scholar]
- Fukata M. and Kaibuchi K. (2001). Rho-family GTPases in cadherin-mediated cell-cell adhesion. Nat. Rev. Mol. Cell Biol. 2, 887-897. 10.1038/35103068 [DOI] [PubMed] [Google Scholar]
- Gladden A. B., Hebert A. M., Schneeberger E. E. and McClatchey A. I. (2010). The NF2 tumor suppressor, Merlin, regulates epidermal development through the establishment of a junctional polarity complex. Dev. Cell 19, 727-739. 10.1016/j.devcel.2010.10.008 [DOI] [PMC free article] [PubMed] [Google Scholar]
- Gumbiner B. M. (2005). Regulation of cadherin-mediated adhesion in morphogenesis. Nat. Rev. Mol. Cell Biol. 6, 622-634. 10.1038/nrm1699 [DOI] [PubMed] [Google Scholar]
- Gumbiner B. M. and Kim N.-G. (2014). The Hippo-YAP signaling pathway and contact inhibition of growth. J. Cell Sci. 127, 709-717. 10.1242/jcs.140103 [DOI] [PMC free article] [PubMed] [Google Scholar]
- Huttenlocher A., Lakonishok M., Kinder M., Wu S., Truong T., Knudsen K. A. and Horwitz A. F. (1998). Integrin and cadherin synergy regulates contact inhibition of migration and motile activity. J. Cell Biol. 141, 515-526. 10.1083/jcb.141.2.515 [DOI] [PMC free article] [PubMed] [Google Scholar]
- Huveneers S., Oldenburg J., Spanjaard E., van der Krogt G., Grigoriev I., Akhmanova A., Rehmann H. and de Rooij J. (2012). Vinculin associates with endothelial VE-cadherin junctions to control force-dependent remodeling. J. Cell Biol. 196, 641-652. 10.1083/jcb.201108120 [DOI] [PMC free article] [PubMed] [Google Scholar]
- Huynh J., Nishimura N., Rana K., Peloquin J. M., Califano J. P., Montague C. R., King M. R., Schaffer C. B. and Reinhart-King C. A (2011). Age-related intimal stiffening enhances endothelial permeability and leukocyte transmigration. Sci. Transl. Med. 3, 112ra122 10.1126/scitranslmed.3002761 [DOI] [PMC free article] [PubMed] [Google Scholar]
- Icard-Arcizet D., Cardoso O., Richert A. and Hénon S. (2008). Cell stiffening in response to external stres is correlated to actin recruitment. Biophys. J. 94, 2906-2913. 10.1529/biophysj.107.118265 [DOI] [PMC free article] [PubMed] [Google Scholar]
- Kasza K. E. and Zallen J. A. (2011). Dynamics and regulation of contractile actin-myosin networks in morphogenesis. Curr. Opin. Cell. Biol. 23, 30-38. 10.1016/j.ceb.2010.10.014 [DOI] [PMC free article] [PubMed] [Google Scholar]
- Katsumi A., Orr A. W., Tzima E. and Schwartz M. A. (2004). Integrins in mechanotransduction. J. Biol. Chem. 279, 12001-12004. 10.1074/jbc.R300038200 [DOI] [PubMed] [Google Scholar]
- Kim J.-H. and Asthagiri A. R. (2011). Matrix stiffening sensitizes epithelial cells to EGF and enables the loss of contact inhibition of proliferation. J. Cell Sci. 124, 1280-1287. 10.1242/jcs.078394 [DOI] [PMC free article] [PubMed] [Google Scholar]
- Kim J.-B., Islam S., Kim Y. J., Prudoff R. S., Sass K. M., Wheelock M. J. and Johnson K. R. (2000). N-Cadherin extracellular repeat 4 mediates epithelial to mesenchymal transition and increased motility. J. Cell Biol. 151, 1193-1206. 10.1083/jcb.151.6.1193 [DOI] [PMC free article] [PubMed] [Google Scholar]
- Kim J.-H., Kushiro K., Graham N. A. and Asthagiri A. R. (2009). Tunable interplay between epidermal growth factor and cell-cell contact governs the spatial dynamics of epithelial growth. Proc. Natl. Acad. Sci. USA 106, 11149-11153. 10.1073/pnas.0812651106 [DOI] [PMC free article] [PubMed] [Google Scholar]
- Kim T.-J., Zheng S., Sun J., Muhamed I., Wu J., Lei L., Kong X., Leckband D. E. and Wang Y. (2015). Dynamic visualization of alpha-catenin reveals rapid, reversible conformation switching between tension states. Curr. Biol. 25, 218-224. 10.1016/j.cub.2014.11.017 [DOI] [PMC free article] [PubMed] [Google Scholar]
- Krishnan R., Klumpers D. D., Park C. Y., Rajendran K., Trepat X., van Bezu J., van Hinsbergh V. W., Carman C. V., Brain J. D., Fredberg J. J. et al. (2011). Substrate stiffening promotes endothelial monolayer disruption through enhanced physical forces. Am. J. Physiol. Cell Physiol. 300, C146-C154. 10.1152/ajpcell.00195.2010 [DOI] [PMC free article] [PubMed] [Google Scholar]
- Kumar S. and Weaver V. M. (2009). Mechanics, malignancy, and metastasis: The force journey of a tumor cell. Cancer Metastasis Rev. 28, 113-127. 10.1007/s10555-008-9173-4 [DOI] [PMC free article] [PubMed] [Google Scholar]
- Ladoux B., Anon E., Lambert M., Rabodzey A., Hersen P., Buguin A., Silberzan P. and Mege R. M. (2010). Strength dependence of cadherin-mediated adhesions. Biophys. J. 98, 534-542. 10.1016/j.bpj.2009.10.044 [DOI] [PMC free article] [PubMed] [Google Scholar]
- le Duc Q., Shi Q., Blonk I., Sonnenberg A., Wang N., Leckband D. and de Rooij J. (2010). Vinculin potentiates E-cadherin mechanosensing and is recruited to actin-anchored sites within adherens junctions in a MyosinII dependent manner. J. Cell Biol. 189:1107-1115. 10.1083/jcb.201001149 [DOI] [PMC free article] [PubMed] [Google Scholar]
- Leckband D. E. and de Rooij J. (2014). Cadherin adhesion and mechanotransduction. Annu. Rev. Cell Dev. Biol. 30:291-315. 10.1146/annurev-cellbio-100913-013212 [DOI] [PubMed] [Google Scholar]
- Lecuit T. (2010). alpha-catenin mechanosensing for adherens junctions. Nat. Cell Biol. 12, 522-524. 10.1038/ncb2066 [DOI] [PubMed] [Google Scholar]
- Leerberg J. M. and Yap A. S. (2012). Vinculin, cadherin mechanotransduction and homeostasis of cell-cell junctions. Protoplasma 250, 817-829. 10.1007/s00709-012-0475-6 [DOI] [PubMed] [Google Scholar]
- Leerberg J. M., Gomez G. A., Verma S., Moussa E. J., Wu S. K., Priya R., Hoffman B. D., Grashoff C., Schwartz M. A. and Yap A. S. (2014). Tension-sensitive actin assembly supports contractility at the epithelial zonula adherens. Curr. Biol. 24, 1689-1699. 10.1016/j.cub.2014.06.028 [DOI] [PMC free article] [PubMed] [Google Scholar]
- Levental K. R., Yu H., Kass L., Lakins J. N., Egeblad M., Erler J. T., Fong S. F., Csiszar K., Giaccia A., Weninger W. et al. (2009). Matrix crosslinking forces tumor progression by enhancing integrin signaling. Cell 139, 891-906. 10.1016/j.cell.2009.10.027 [DOI] [PMC free article] [PubMed] [Google Scholar]
- Lewis J. M., Baskaran R., Taagepera S., Schwartz M. A. and Wang J. Y. (1996). Integrin regulation of c-Abl tyrosine kinase activity and cytoplasmic-nuclear transport. Proc. Natl. Acad. Sci. USA 93, 15174-15179. 10.1073/pnas.93.26.15174 [DOI] [PMC free article] [PubMed] [Google Scholar]
- Liu Z., Tan J. L., Cohen D. M., Yang M. T., Sniadecki N. J., Ruiz S. A., Nelson C. M. and Chen C. S. (2010). Mechanical tugging force regulates the size of cell-cell junctions. Proc. Natl. Acad. Sci. USA 107, 9944-9949. 10.1073/pnas.0914547107 [DOI] [PMC free article] [PubMed] [Google Scholar]
- Lu S., Ouyang M., Seong J., Zhang J., Chien S. and Wang Y. (2008). The spatiotemporal pattern of Src activation at lipid rafts revealed by diffusion-corrected FRET imaging. PLoS Comput. Biol. 4, e1000127 10.1371/journal.pcbi.1000127 [DOI] [PMC free article] [PubMed] [Google Scholar]
- Lu S., Kim T. J., Chen C.-E., Ouyang M., Seong J., Liao X. and Wang Y. (2011). Computational analysis of the spatiotemporal coordination of polarized PI3K and Rac1 activities in micro-patterned live cells. PloS One 6, e21293 10.1371/journal.pone.0021293 [DOI] [PMC free article] [PubMed] [Google Scholar]
- Lu P., Weaver V. M. and Werb Z. (2012). The extracellular matrix: a dynamic niche in cancer progression. J. Cell Biol. 196, 395-406. 10.1083/jcb.201102147 [DOI] [PMC free article] [PubMed] [Google Scholar]
- Maruthamuthu V., Sabass B., Schwarz U. S. and Gardel M. L. (2011). Cell-ECM traction force modulates endogenous tension at cell-cell contacts. Proc. Natl. Acad. Sci. USA 108, 4708-4713. 10.1073/pnas.1011123108 [DOI] [PMC free article] [PubMed] [Google Scholar]
- McClatchey A. I. and Yap A. S. (2012). Contact inhibition (of proliferation) redux. Curr. Opin. Cell Biol. 24, 685-694. 10.1016/j.ceb.2012.06.009 [DOI] [PubMed] [Google Scholar]
- McLachlan R. W., Kraemer A., Helwani F. M., Kovacs E. M. and Yap A. S. (2007). E-cadherin adhesion activates c-Src signaling at cell-cell contacts. Mol. Biol. Cell 18, 3214-3223. 10.1091/mbc.E06-12-1154 [DOI] [PMC free article] [PubMed] [Google Scholar]
- Miranda KC, Khromykh T, Christy P, Le TL, Gottardi CJ, Yap AS, Stow JL, Teasdale RD (2001). A dileucine motif targets E-cadherin to the basolateral cell surface in Madin-Darby canine kidney and LLC-PK1 epithelial cells. J Biol Chem. 276, 22565-22672. 10.1074/jbc.M101907200 [DOI] [PubMed] [Google Scholar]
- Muhamed I., Wu J., Sehgal P., Kong X., Tajik A., Wang N. and Leckband D. E. (2016). E-cadherin-mediated force transduction signals regulate global cell mechanics. J. Cell Sci. 129, 1843-1854. 10.1242/jcs.185447 [DOI] [PMC free article] [PubMed] [Google Scholar]
- Nagai T., Yamakawa N., Aota S., Yamada S. S., Akiyama S. K., Olden K. and Yamada K. M. (1991). Monoclonal antibody characterization of two distant sites required for function of the central cell-binding domain of fibronectin in cell adhesion, cell migration, and matrix assembly. J. Cell Biol. 114, 1295-1305. 10.1083/jcb.114.6.1295 [DOI] [PMC free article] [PubMed] [Google Scholar]
- Nagafuchi A., Takeichi M. and Tsukita S. (1991). The 102 kd cadherin-associated protein: similarity to vinculin and posttranscriptional regulation of expression. Cell 65, 849-857. 10.1016/0092-8674(91)90392-C [DOI] [PubMed] [Google Scholar]
- Nagafuchi A., Ishihara S. and Tsukita S. (1994). The roles of catenins in the cadherin-mediated cell adhesion: functional analysis of E-cadherin-alpha catenin fusion molecules. J. Cell Biol. 127, 235-245. 10.1083/jcb.127.1.235 [DOI] [PMC free article] [PubMed] [Google Scholar]
- Niessen C. M., Leckband D. and Yap A. S. (2011). Tissue organization by cadherin adhesion molecules: dynamic molecular and cellular mechanisms of morphogenetic regulation. Physiol. Rev. 91, 691-731. 10.1152/physrev.00004.2010 [DOI] [PMC free article] [PubMed] [Google Scholar]
- Orr A. W., Ginsberg M. H., Shattil S. J., Deckmyn H. and Schwartz M. A. (2006a). Matrix-specific suppression of integrin activation in shear stress signaling. Mol. Biol. Cell 17, 4686-4697. 10.1091/mbc.E06-04-0289 [DOI] [PMC free article] [PubMed] [Google Scholar]
- Orr A. W., Helmke B. P., Blackman B. R. and Schwartz M. A. (2006b). Mechanisms of mechanotransduction. Dev. Cell 10, 11-20. 10.1016/j.devcel.2005.12.006 [DOI] [PubMed] [Google Scholar]
- Ouyang M., Lu S., Kim T., Chen C.-E., Seong J., Leckband D. E., Wang F., Reynolds A. B., Schwartz M. A. and Wang Y. (2013). N-cadherin regulates spatially polarized signals through distinct p120ctn and beta-catenin-dependent signalling pathways. Nat. Commun. 4, 1589 10.1038/ncomms2560 [DOI] [PMC free article] [PubMed] [Google Scholar]
- Prakasam A., Chien Y. H., Maruthamuthu V., and Leckband D. E. (2006) Calcium site mutations in cadherin: impact on adhesion and evidence of cooperativity. Biochemistry 45, 6930-6939. 10.1021/bi060213m [DOI] [PubMed] [Google Scholar]
- Paszek M. J., Zahir N., Johnson K. R., Lakins J. N., Rozenberg G. I., Gefen A., Reinhart-King C. A., Margulies S. S., Dembo M., Boettiger D. et al. (2005). Tensional homeostasis and the malignant phenotype. Cancer Cell 8, 241-254. 10.1016/j.ccr.2005.08.010 [DOI] [PubMed] [Google Scholar]
- Pendergast A. M. (2002). The Abl family kinases: mechanisms of regulation and signaling. Adv. Cancer Res. 85, 51-100. 10.1016/S0065-230X(02)85003-5 [DOI] [PubMed] [Google Scholar]
- Perrais M., Chen X., Perez-Moreno M. and Gumbiner B. M. (2007). E-cadherin homophilic ligation inhibits cell growth and epidermal growth factor receptor signaling independent of other cell interactions. Mol. Biol. Cell 18, 2013-2025. 10.1091/mbc.E06-04-0348 [DOI] [PMC free article] [PubMed] [Google Scholar]
- Plattner R., Kadlec L., DeMali K. A., Kazlauskas A. and Pendergast A. M. (1999). c-Abl is activated by growth factors and Src family kinases and has a role in the cellular response to PDGF. Genes Dev. 13, 2400-2411. 10.1101/gad.13.18.2400 [DOI] [PMC free article] [PubMed] [Google Scholar]
- Plattner R., Irvin B. J., Guo S., Blackburn K., Kazlauskas A., Abraham R. T., York J. D. and Pendergast A. M. (2003). A new link between the c-Abl tyrosine kinase and phosphoinositide signalling through PLC-gamma1. Nat. Cell Biol. 5, 309-319. 10.1038/ncb949 [DOI] [PubMed] [Google Scholar]
- Sakaguchi M., Sonegawa H., Murata H., Kitazoe M., Futami J.-I., Kataoka K., Yamada H. and Huh N.-H. (2008). S100A11, an dual mediator for growth regulation of human keratinocytes. Mol. Biol. Cell 19, 78-85. 10.1091/mbc.E07-07-0682 [DOI] [PMC free article] [PubMed] [Google Scholar]
- Schwartz M. A. (2010). Integrins and extracellular matrix in mechanotransduction. Cold Spring Harbor Perspect. Biol. 2, a005066 10.1101/cshperspect.a005066 [DOI] [PMC free article] [PubMed] [Google Scholar]
- Schwartz M. A. and DeSimone D. W. (2008). Cell adhesion receptors in mechanotransduction. Curr. Opin. Cell Biol. 20, 551-556. 10.1016/j.ceb.2008.05.005 [DOI] [PMC free article] [PubMed] [Google Scholar]
- Shapiro L. and Weis W. I. (2009). Structure and biochemistry of cadherins and catenins. Cold Spring Harbor Perspect. Biol. 1, a003053 10.1101/cshperspect.a003053 [DOI] [PMC free article] [PubMed] [Google Scholar]
- Shashikanth N., Kisting M. A. and Leckband D. E. (2016). Kinetic measurements reveal enhanced protein-protein interactions at intercellular junctions. Sci. Rep. 6, 23623 10.1038/srep23623 [DOI] [PMC free article] [PubMed] [Google Scholar]
- Simpson M. A., Bradley W. D., Harburger D., Parsons M., Calderwood D. A. and Koleske A. J. (2015). Direct interactions with the integrin beta1 cytoplasmic tail activate the Abl2/Arg kinase. J. Biol. Chem. 290, 8360-8372. 10.1074/jbc.M115.638874 [DOI] [PMC free article] [PubMed] [Google Scholar]
- Tabdili H., Langer M., Shi Q., Poh Y.-C., Wang N. and Leckband D. (2012). Cadherin-dependent mechanotransduction depends on ligand identity but not affinity. J. Cell Sci. 125, 4362-4371. 10.1242/jcs.105775 [DOI] [PMC free article] [PubMed] [Google Scholar]
- Takeichi M. (1995). Morphogenetic roles of classic cadherins. Curr. Opin. Cell Biol. 7, 619-627. 10.1016/0955-0674(95)80102-2 [DOI] [PubMed] [Google Scholar]
- Takeichi M., and Nakagawa S. (2001). Cadherin-dependent cell-cell adhesion. Curr. Protoc. Cell Biol. Chapter 9, Unit 9.3 10.1002/0471143030.cb0903s00. [DOI] [PubMed] [Google Scholar]
- Thomas W. A., Boscher C., Chu Y.-S., Cuvelier D., Martinez-Rico C., Seddiki R., Heysch J., Ladoux B., Thiery J. P., Mege R. M. et al. (2013). alpha-catenin and vinculin cooperate to promote high E-cadherin-based adhesion strength. J. Biol. Chem. 288, 4957-4969. 10.1074/jbc.M112.403774 [DOI] [PMC free article] [PubMed] [Google Scholar]
- Tian Y., Gawlak G., O'Donnell J. J. III, Birukova A. A. and Birukov K. G (2016). Activation of vascular endothelial growth factor (VEGF) receptor 2 mediates endothelial permeability caused by cyclic stretch. J. Biol. Chem. 291:10032-10045. 10.1074/jbc.M115.690487 [DOI] [PMC free article] [PubMed] [Google Scholar]
- Ting A. Y., Kain K. H., Klemke R. L. and Tsien R. Y. (2001). Genetically encoded fluorescent reporters of protein tyrosine kinase activities in living cells. Proc. Natl. Acad. Sci. USA 98, 15003-15008. 10.1073/pnas.211564598 [DOI] [PMC free article] [PubMed] [Google Scholar]
- Truffi M., Dubreuil V., Liang X., Vacaresse N., Nigon F., Han S. P., Yap A. S., Gomez G. A. and Sap J. (2014). RPTPalpha controls epithelial adherens junctions, linking E-cadherin engagement to c-Src-mediated phosphorylation of cortactin. J. Cell Sci. 127, 2420-2432. 10.1242/jcs.134379 [DOI] [PubMed] [Google Scholar]
- Twiss F., Le Duc Q., Van Der Horst S., Tabdili H., Van Der Krogt G., Wang N., Rehmann H., Huveneers S., Leckband D. E. and De Rooij J. (2012). Vinculin-dependent Cadherin mechanosensing regulates efficient epithelial barrier formation. Biol Open 1, 1128-1140. 10.1242/bio.20122428 [DOI] [PMC free article] [PubMed] [Google Scholar]
- Tzima E., del Pozo M. A., Shattil S. J., Chien S. and Schwartz M. A (2001). Activation of integrins in endothelial cells by fluid shear stress mediates Rho-dependent cytoskeletal alignment. EMBO J. 20:4639-4647. 10.1093/emboj/20.17.4639 [DOI] [PMC free article] [PubMed] [Google Scholar]
- Vogel V. and Sheetz M. (2006). Local force and geometry sensing regulate cell functions. Nat. Rev. Mol. Cell Biol. 7, 265-275. 10.1038/nrm1890 [DOI] [PubMed] [Google Scholar]
- Wang N. and Ingber D. E. (1995). Probing transmembrane mechanical coupling and cytomechanics using magnetic twisting cytometry. Biochem. Cell Biol. 73, 327-335. 10.1139/o95-041 [DOI] [PubMed] [Google Scholar]
- Wang N., Butler J. P. and Ingber D. E. (1993). Mechanotransduction across the cell surface and through the cytoskeleton. Science 260, 1124-1127. 10.1126/science.7684161 [DOI] [PubMed] [Google Scholar]
- Wang Y., Boltvinick E. L., Zhao Y., Berns M. W., Usami S., Tsien R. Y. and Chien S. (2005). Visualizing the mechanical activation of Src. Nature 434, 1040-1045. 10.1038/nature03469 [DOI] [PubMed] [Google Scholar]
- Wang X., Sun J., Xu Q., Chowdhury F., Roein-Peikar M., Wang Y. and Ha T. (2015). Integrin molecular tension within motile focal adhesions. Biophys. J. 109, 2259-2267. 10.1016/j.bpj.2015.10.029 [DOI] [PMC free article] [PubMed] [Google Scholar]
- Weber G. F., Bjerke M. A. and DeSimone D. W. (2012). A mechanoresponsive cadherin-keratin complex directs polarized protrusive behavior and collective cell migration. Dev. Cell 22, 104-115. 10.1016/j.devcel.2011.10.013 [DOI] [PMC free article] [PubMed] [Google Scholar]
- Yao M., Qiu W., Liu R., Efremov A. K., Cong P., Seddiki R., Payre M., Lim C. T., Ladoux B., Mege R. M. et al. (2014). Force-dependent conformational switch of alpha-catenin controls vinculin binding. Nat. Commun. 5, 4525 10.1038/ncomms5525 [DOI] [PubMed] [Google Scholar]
- Yonemura S., Wada Y., Watanabe T., Nagafuchi A. and Shibata M. (2010). alpha-Catenin as a tension transducer that induces adherens junction development. Nat. Cell Biol. 12, 533-542. 10.1038/ncb2055 [DOI] [PubMed] [Google Scholar]
Associated Data
This section collects any data citations, data availability statements, or supplementary materials included in this article.