

Abstract
Spt5 is a highly conserved RNA polymerase II (Pol II)‐associated pausing and elongation factor. However, its impact on global elongation and Pol II processivity in mammalian cells has not been clarified. Here, we show that depleting Spt5 in mouse embryonic fibroblasts (MEFs) does not cause global elongation defects or decreased elongation rates. Instead, in Spt5‐depleted cells, a fraction of Pol II molecules are dislodged during elongation, thus decreasing the number of Pol II complexes that complete the transcription cycle. Most strikingly, this decrease is restricted to a narrow window between 15 and 20 kb from the promoter, a distance which coincides with the stage where accelerating Pol II attains maximum elongation speed. Consequently, long genes show a greater dependency on Spt5 for optimal elongation efficiency and overall gene expression than short genes. We propose that an important role of Spt5 in mammalian elongation is to promote the processivity of those Pol II complexes that are transitioning toward maximum elongation speed 15–20 kb from the promoter.
Keywords: Pol II processivity, RNA polymerase II, Spt5, transcription elongation
Subject Categories: Chromatin, Epigenetics, Genomics & Functional Genomics; Transcription
Introduction
RNA polymerase II (Pol II)‐mediated transcription critically underlies gene regulation. A plethora of factors associate with Pol II complexes to coordinate and regulate transcription at multiple stages of the transcription cycle. Of all known Pol II‐associated factors, suppressor of Ty5 homolog (Spt5) is the most highly conserved (Werner, 2012; Hartzog & Fu, 2013). In eukaryotes, Spt5 forms a heterodimer with Spt4 called DSIF (5,6‐dichloro‐1‐β‐D‐ribofuranosylbenzimidazole sensitivity‐inducing factor; Wada et al, 1998; Yamaguchi et al, 1999a), which promotes promoter‐proximal pausing of Pol II via its interaction with negative elongation factor (NELF; Yamaguchi et al, 1999b). In mammalian cells, Spt5 appears to have several additional roles during the transcription cycle. Spt5 can function as an adapter by associating with various co‐transcriptional factors and enzymatic activities, thereby recruiting them to Pol II complexes (Wen & Shatkin, 1999; Pei & Shuman, 2002; Lindstrom et al, 2003; Pavri et al, 2010; Diamant et al, 2012; Mayer et al, 2012). In addition, Spt5 was recently shown to promote the activation of a subset of inflammatory response genes by regulating the loading of the general transcription factor, TFIID, suggesting an unanticipated role in early transcription initiation (Diamant et al, 2016).
Pol II is recruited to promoters via the general transcription factors leading to the assembly of the pre‐initiation complex (PIC) followed by transcription initiation (Orphanides et al, 1996; Roeder, 1996; Hahn, 2004; Luse, 2014). In the course of initiation and promoter clearance, Spt5 and NELF are recruited to enforce pausing of Pol II complexes ~50–100 nt downstream of the transcription start site (TSS; Adelman & Lis, 2012). Next, the kinases P‐TEFb (Marshall & Price, 1995; Marshall et al, 1996; Chao & Price, 2001; Peterlin & Price, 2006) and Cdk12 (Bartkowiak et al, 2010; Liang et al, 2015) are recruited, which phosphorylate Pol II at serine 2 of its C‐terminal domain, Spt5 and NELF (Jonkers & Lis, 2015). This triggers NELF dissociation and the release of paused Pol II into productive elongation. P‐TEFb inhibition leads to a genome‐wide accumulation of Pol II in the promoter‐proximal region, suggesting that the transition of Pol II into productive elongation is a regulated step at nearly all genes (Jonkers et al, 2014). Importantly, Spt5 remains associated with Pol II until termination (Pavri et al, 2010; Rahl et al, 2010) and is believed to enhance Pol II processivity by clamping Pol II onto the template DNA (Hirtreiter et al, 2010; Klein et al, 2011; Martinez‐Rucobo et al, 2011; Werner, 2012). Indeed, depletion of Spt5 in yeast led to a genome‐wide defect during early elongation of sense and antisense transcripts (Shetty et al, 2017). In contrast, mammalian cells depleted of Spt5 show changes in Pol II distribution but do not appear to suffer from dramatic transcription defects (Pavri et al, 2010; Rahl et al, 2010; Diamant et al, 2012; Stanlie et al, 2012), suggesting that mammalian systems may be less sensitive to lowered Spt5 levels than yeast.
Several factors are involved in ensuring normal elongation of Pol II in gene bodies. These include nucleosome remodelers like the FACT complex (Orphanides et al, 1998; Belotserkovskaya et al, 2003), elongation factors like the PAF complex (Shi et al, 1996; Krogan et al, 2002; Mueller & Jaehning, 2002), and Spt6 (Endoh et al, 2004), factors that resolve transcriptional stress, such as RECQL5 (Saponaro et al, 2014), and factors regulating Pol II processivity, such as Spt5. Indeed, Spt5 has been shown to associate with the PAF complex, FACT, and Spt6 (Krogan et al, 2002; Squazzo et al, 2002; Lindstrom et al, 2003; Liu et al, 2009), suggesting that Spt5 may contribute to the assembly and maintenance of elongation‐competent Pol II complexes. Importantly, genome‐wide kinetic studies of Pol II elongation rate in multiple mammalian cell types have shown that elongation is not a uniform process along the gene body. Upon release into productive elongation, Pol II accelerates into the gene body in a slow but systematic manner and reaches its maximum speed after ~15 kb of elongation. Beyond this point, the elongation rate is maintained until termination (Danko et al, 2013; Jonkers et al, 2014). It remains unknown, however, whether Pol II acceleration and transition to maximal elongation rate are subject to regulation.
Most studies on Spt5 in mammalian cells have focused on a limited set of genes. As a result, the role of Spt5 in elongation and Pol II processivity on a genome‐wide scale in mammalian cells remains poorly understood. To address these issues, we depleted Spt5 in mouse embryonic fibroblasts (MEFs) and investigated the impact on Pol II occupancy and transcription genome‐wide. Our results suggest that the absence of Spt5 decreases the number of transcriptionally engaged Pol II complexes that can complete the transcription cycle. We show that Spt5 does regulate Pol II processivity but that this regulation is restricted to a region ~15–20 kb from promoters. As a result, longer genes show reduced mRNA expression relative to shorter genes. Our findings thus help clarify the role of Spt5 in mammalian Pol II elongation.
Results
Generation and characterization of Spt5‐depleted mouse embryonic fibroblasts
Spt5 is expected to be essential for viability in mammalian cells. Hence, we chose to conditionally ablate Spt5 in mice. We obtained transgenic mouse embryonic stem (ES) cells wherein exons 14–16 of the Spt5‐encoding Supt5h gene were flanked by loxP sequences (Supt5h Fl). Cre recombinase‐mediated deletion of the floxed region generates a premature stop codon resulting in a truncated protein lacking Pol II‐binding and transcription activity (Yamaguchi et al, 1999a; Ivanov et al, 2000; Fig EV1A and Materials and Methods). We crossed Supt5h Fl/− mouse lines (generated as described in Materials and Methods) with mice expressing Cre‐ERT2 constitutively from the Rosa26 locus (Ventura et al, 2007) to generate Supt5h Fl/− Rosa26 Cre‐ERT2/+ mice (Fig EV1A). Cre‐ERT2 is retained in the cytoplasm but translocates to the nucleus upon addition of 4‐hydroxytamoxifen (4‐HT), leading to deletion of the floxed gene segment.
Figure EV1. Generation of Spt5‐depleted (Spt5dep) mice and characterization of Spt5dep mouse embryonic fibroblasts (MEFs).
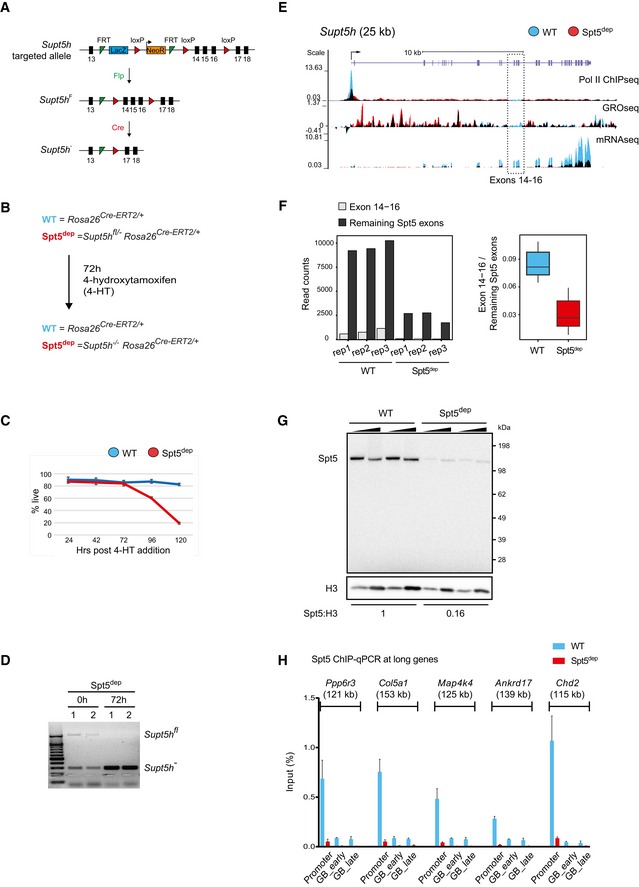
- Diagram of the targeting vector obtained from the Sanger Consortium. Exons 14–16 of the Supt5h gene are flanked by loxP sites. Additionally, the intron between exons 13 and 14 has a selection cassette comprising of a FLP recombination target (FRT) site, a splice acceptor (SA) and a β‐galactosidase cassette (shown for simplicity as LacZ), followed by a phosphoglycerate kinase (Pgk) promoter‐driven neomycin resistance (NeoR) cassette, a SV40 poly‐adenylation (pA) site (not shown) and a second FRT site. Following germline transmission, the entire region between the two FRT sites was deleted by crossing with mice expressing Flpe recombinase to generate Supt5h Fl/+ mice which were then used to generate homozygous Supt5h Fl/Fl mice. Heterozygous Supt5h −/+ mice were generated by crossing Supt5h Fl/+ mice with EIIA‐cre mice wherein Cre recombinase is active in the germline. Supt5h −/+ mice were bred with Rosa26 Cre‐ERT2 mice, which express the Cre recombinase fused to the tamoxifen‐inducible estrogen receptor domain constitutively from the Rosa26 locus. Finally, Supt5h Fl/Fl mice were crossed with Supt5h −/+ Rosa26 Cre‐ERT2/Cre‐ERT2 mice to give the final genotype, Supt5h Fl/− Rosa26 Cre‐ERT2/+, used in this study to generate Spt5‐depleted (Spt5dep) primary MEFs.
- Overview of the experimental scheme to generate WT (Rosa26 Cre‐ERT2/+) and Spt5dep (Supt5h Fl/− Rosa26 Cre‐ERT2/+) primary MEFs. MEFs were prepared from d13.5 embryos. After three passages, MEFs were treated with 2 μM 4‐hydroxytamoxifen (4‐HT) for 72 h and then harvested for all downstream analyses.
- Viability curve for WT and Spt5dep primary MEFs treated with 4‐HT for 72 h as described in (B). Cells were counted using the Trypan Blue dye exclusion approach at the indicated time‐points. The data represent MEFs prepared from four mice for each genotype. For each time point, the mean with standard deviation is plotted.
- Multiplex PCR‐based genotyping from genomic DNA of WT and Spt5dep primary MEFs. For each genotype, MEFs from two different mice were analyzed.
- UCSC genome browser snapshot of the Supt5h locus showing Pol II ChIPseq, GROseq, and mRNAseq profiles. The floxed segment comprising exons 14–16 is boxed. WT and Spt5dep tracks are overlaid in blue and red representing WT and Spt5dep tracks, respectively, and black representing the overlap between them.
- The left panel shows the mRNAseq read counts in the floxed exons 14–16 of Supt5h mRNA and in the remaining Supt5h exons in WT and Spt5dep samples. In the right panel box plot, the ratio of the Supt5h exons 14–16 to remaining Supt5h exons is depicted for WT and Spt5dep samples.
- Western blot analysis from nuclear extracts of two independent WT and Spt5dep primary MEFs preparations treated with 4‐HT for 72 h as described in (B). Blots were probed for Spt5 and histone H3 as a loading control. A twofold titration of nuclear extract was performed for each sample.
- ChIP‐qPCR analysis for Spt5 occupancy at promoters and gene bodies of several long genes in WT and Spt5dep MEFs treated with 4‐HT for 72 h. Within gene bodies, a proximal (GB proximal; < 15 kb from the TSS) and distal (GB distal; > 50 kb from the TSS) region was chosen for this analysis. The negative control region represents a gene desert on chromosome 1 that is transcriptionally inert. The data were normalized to the input DNA in all cases and represented as percent of input. The plot represents three independent experiments with mean and standard deviations shown.
Source data are available online for this figure.
For all experiments, we ablated Spt5 in vitro by adding 4‐HT to primary Supt5h Fl/− Rosa26 Cre‐ERT2/+ mouse embryonic fibroblast (MEF) cultures (Fig EV1B and Materials and Methods). As controls, we used Rosa26 Cre‐ERT2/+ primary MEFs treated with 4‐HT (henceforth called wild‐type, WT). Supt5h Fl/− Rosa26 Cre‐ERT2/+ primary MEFs proliferated normally for over 72 h following 4‐HT treatment but displayed decreased viability after 96 h of 4‐HT, which indicates that Spt5 is essential for MEF survival (Fig EV1C). Therefore, we performed all experiments in this study with viable, primary MEFs treated with 4‐HT for 72 h. Genotyping confirmed that the floxed segment was deleted in Supt5h Fl/− Rosa26 Cre‐ERT2/+ MEFs 72 h after 4‐HT treatment (Fig EV1D), and genome‐wide transcriptome analysis (GROseq and ChIPseq, described in the next section) also showed dramatic depletion of read densities within the deleted segment 72 h after 4‐HT addition (Fig EV1E). Supt5h mRNA was down‐regulated approximately fourfold in Supt5h Fl/− Rosa26 Cre‐ERT2/+ MEFs; hence, read mapping to all exons was reduced (Fig EV1E and F, left panel). However, the ratio of exons 14–16 to the remaining exons was threefold lower in Supt5h Fl/− Rosa26 Cre‐ERT2/+ cells relative to Rosa26 Cre‐ERT2/+ cells, reflecting the loss of these exons by Cre‐mediated deletion (Fig EV1F, right panel). The difference between the depletion observed in mRNAseq compared to much more severe depletion seen in GROseq or ChIPseq is likely due to the fact that the latter techniques capture the state of the locus at the endpoint of the experiment (72 h after 4‐HT addition) whereas the residual reads mapping to exons 14–16 in Supt5h mRNA are likely derived from pre‐existing steady‐state mRNA synthesized prior to complete deletion of the floxed segment.
Importantly, 4‐HT addition for 72 h severely depleted Spt5 in nuclear extracts of Supt5h Fl/− Rosa26 Cre‐ERT2/+ MEFs by > 85% of WT levels (Fig EV1G). The absence of complete protein depletion may be due, in part, to the residual full‐length mRNA still present 72 h after 4‐HT addition (Fig EV1F). We could not detect the truncated protein by Western blotting using an antibody recognizing an epitope near the N‐terminus of Spt5, which is retained after Cre‐mediated deletion, suggesting that the truncated protein is unstable (Fig EV1G). We also confirmed with ChIP‐qPCR (chromatin immunoprecipitation followed by quantitative PCR) that Spt5 was dramatically depleted at promoters and gene bodies of all tested genes in Supt5h Fl/− Rosa26 Cre‐ERT2/+ MEFs 72 h after 4‐HT addition (Fig EV1H). Since Spt5 is severely depleted, but not completely absent, we henceforth refer to the 72 h post‐4‐HT condition as Spt5‐depleted (Spt5dep).
Spt5dep MEFs show reduced promoter‐proximal pausing and increased nascent transcription in genes
We first sought to characterize the changes in Pol II occupancy in Spt5dep MEFs using Pol II ChIPseq (chromatin immunoprecipitation followed by deep sequencing). In addition, we measured nascent transcription using GROseq (global run‐on sequencing; Core & Lis, 2008), which provides information on the location and orientation of actively engaged Pol II. Replicates were highly correlated (Spearman's correlation coefficient > 0.96 in all cases; Fig EV2A), and we recovered similar numbers of uniquely aligned reads between replicate deep sequencing runs (Table EV1). The percentage of reads mapping within genes was also similar between WT and Spt5dep samples (Table EV1).
Figure EV2. Correlation between replicate datasets and classification of the expressed gene list.
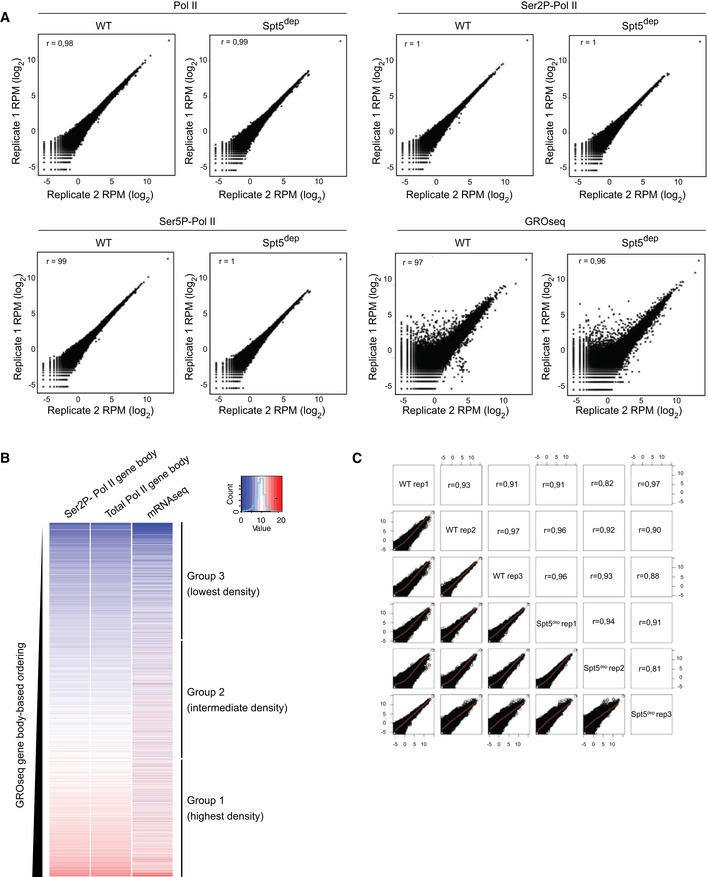
- Replicate correlation plots for GROseq and Pol II, Ser5P‐Pol II and Ser2P‐Pol II ChIPseq datasets from WT and Spt5dep MEFs used in this study. Spearman's correlation coefficient (r) is indicated within the plots.
- Classification of all expressed genes used in this study. The heatmaps show gene body (GB) densities of Pol II and Ser2P‐Pol II as well as mRNAseq from WT MEFs ordered by GROseq GB density (TSS +0.5 kb to TTS). The genes were grouped into three equal groups termed groups 1, 2, and 3, which comprise genes with highest, intermediate, and lowest GROseq GB density, respectively.
- Replicate correlation plots for the triplicate mRNAseq datasets from WT and Spt5dep MEFs used in this study. Spearman's correlation coefficient (r) is indicated.
For all analyses in this study, we used a list of 7,669 expressed genes that met the following criteria: (i) Their expression levels in WT MEFs from GROseq measurements (calculated as reads per kilobase per million sequenced reads, RPKM) were greater than 1 (RPKM > 1). (ii) They were > 2 kb in length. (iii) They did not overlap any other gene. We initially determined the changes in Pol II occupancy and nascent transcription within the promoter‐proximal region. We generated heatmaps of a 2‐kb region covering the TSS and the immediate downstream gene bodies (TSS −0.5 kb to TSS +1.5 kb; Fig 1A) as well as metagene composite plots for the same region (Fig 1B). From the heatmaps and metagene plots, we observed a clear decrease in Pol II density at the TSS region from both ChIPseq and GROseq in Spt5dep cells (Fig 1A and B). The decrease in Pol II density at the TSS in Spt5dep cells was followed by increased Pol II density and nascent transcription (GROseq) in the immediate 5′ gene bodies. This is clearly discernable in both GROseq and Pol II analyses (Fig 1B; arrows indicate the region where the WT and Spt5dep tracks intersect). The example of the Wnt9a gene, shown in Fig 1C, illustrates this change in Pol II distribution. We note that the decrease in Pol II ChIPseq signal around TSSs is stronger than the reduction in GROseq signal. This is likely due to the technical differences between GROseq and ChIPseq and the biological effect of Spt5 depletion. Whereas GROseq measures nascent transcription, Pol II ChIPseq measures Pol II steady‐state occupancy. In Spt5dep cells, a direct correlation between changes in Pol II steady‐state occupancy in the TSS‐proximal region and changes in nascent transcription is absent because the reduced Pol II pause residence time is not accompanied by reduced Pol II nascent transcription. Rather, reduced pausing leads to increased rounds of initiation and nascent transcription (this is explained in later sections and further elaborated in the discussion), which is detected by GROseq leading to the observed discrepancy.
Figure 1. Spt5 depletion leads to increased transcription from promoters genome‐wide.
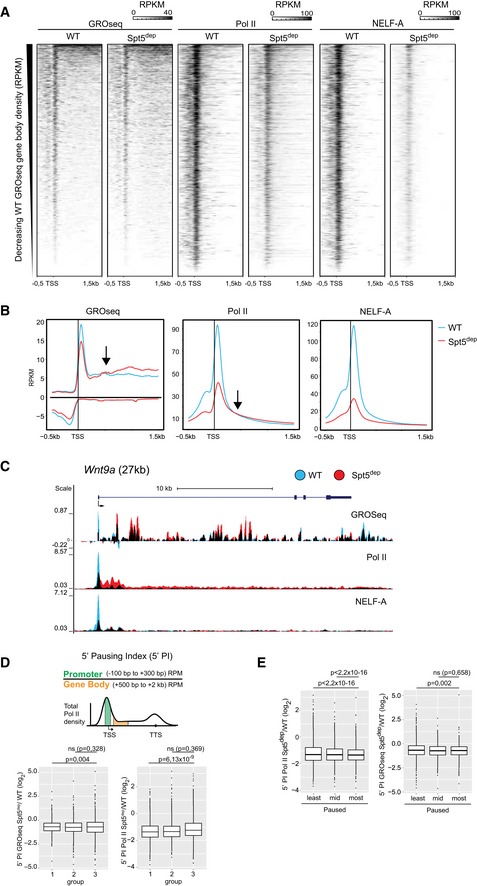
- Heatmaps showing GROseq, Pol II, Serine 5‐phosphorylated Pol II (Ser5P‐Pol II), and NELF‐A ChIPseq densities in WT‐ and Spt5‐depleted (Spt5dep) MEFs at the promoter‐proximal region (TSS −500 bp to TSS +1,500 bp) of all expressed genes (defined as having GROseq RPKM > 1). The heatmaps are ordered by increasing GROseq gene body density, and read densities are calculated as reads per kilobase per million sequenced reads (RPKM).
- Metagene composite plots showing read densities of GROseq, Pol II, Ser5P‐Pol II, and NELF‐A ChIPseq in WT and Spt5dep MEFs at the same promoter‐proximal region (TSS −500 bp to TSS +1,500 bp) as in (A). Read densities are calculated in RPKM. The arrows within the plots indicate the point at which the WT and Spt5dep tracks intersect in the TSS‐proximal gene bodies.
- GROseq, Pol II, Ser5P‐Pol II, and NELF‐A occupancy at the Wnt9a gene as visualized in the UCSC genome browser. WT and Spt5dep tracks are overlaid in blue and red representing WT and Spt5dep signal, respectively, and black representing the overlap between them.
- Upper panel: Diagram showing the calculation of the 5′ pausing index (5′ PI). RPM, reads per million. Lower panel: Box plots showing the 5′ PI fold change between Spt5dep and WT conditions (Spt5dep/WT). The 5′ PI was calculated from GROseq data (5′ PI GROseq; left plot) or Pol II ChIPseq data (5′ PI Pol II; right plot). Expressed genes were categorized into three equal groups based on WT GROseq gene body density with group 1 having highest density and group 3 having lowest density (Fig EV2). The P‐values were calculated using the unpaired t‐test.
- Box plots of the change in 5′ pausing index (5′ PI) upon Spt5 depletion calculated as the fold change of 5′ PI (Spt5dep/WT). Expressed genes are classified into three equal groups (most paused, mid‐paused and least paused) based on their WT pausing index and 5′ PI fold change is calculated from Pol II ChIPseq (left plot) and GROseq (right plot) datasets. The P‐values were calculated using the unpaired t‐test.
We also observed that the occupancy of the pausing factor, NELF, was reduced at promoters of Spt5dep cells. This is in line with in vitro studies (Yamaguchi et al, 1999b) and in vivo ChIPseq analysis following Spt5 depletion in mouse ES cells (Rahl et al, 2010), showing that NELF recruitment is Spt5‐dependent (Fig 1A–C). Altogether, these observations suggest that Spt5 depletion leads to reduced promoter‐proximal Pol II occupancy and increased Pol II density in gene bodies.
Increased nascent transcription from promoters is not correlated with gene expression levels or Pol II pausing strength
We next wanted to gain mechanistic insight into the altered Pol II and nascent transcription patterns at 5′ ends of genes in Spt5dep cells. We considered the possibility that these changes may be related to the levels of transcription. Therefore, we grouped all expressed genes based on their GROseq gene body densities (defined as TSS +0.5 kb to the transcription termination site, TTS) in WT cells. GROseq gene body and Pol II ChIPseq gene body densities correlate well with each other and moderately with mRNAseq, as shown in the heatmap ordered by WT GROseq gene body density (Fig EV2B). Based on this, we divided the gene list into three equal groups termed group 1 (highest density), group 2 (intermediate density), and group 3 (lowest density), which reflect their nascent transcription levels (Fig EV2B).
To quantify the changes in Pol II density at promoters and TSS‐proximal gene bodies between the three groups of genes (Fig EV2B), we calculated the 5′ pausing index (5′ PI), which is the ratio of Pol II density in the promoter region (defined as TSS −100 bp to TSS +300 bp) to the TSS‐proximal gene body region (defined as TSS +300 bp to TSS +2,000 bp; Fig 1D). Thus, the 5′ PI provides a measure of the change in Pol II distribution between the promoter and the immediate downstream gene body. We employed 5′ PI rather than the more conventional PI, where the averaged whole‐gene body density is used, because of the effects of Spt5 depletion on Pol II distribution further downstream in gene bodies, as discussed in later sections. The 5′ PI was calculated from Pol II ChIPseq densities (5′ PI Pol II) and GROseq densities (5′ PI GROseq). In both cases, the fold changes in 5′ PI (Spt5dep/WT) between the three gene groups were very similar (Fig 1D). We conclude that depletion of Spt5 leads to similar fold‐increases in Pol II occupancy and nascent transcription genome‐wide at 5′ ends of genes irrespective of their expression level.
We next asked whether the increased genome‐wide nascent transcription from 5′ ends in Spt5dep cells could simply be due to premature pause release that would result from reduced Spt5‐mediated Pol II pausing. If so, highly paused genes would be expected to experience the highest increase in nascent transcription upon pause release whereas the least paused genes would be less affected, as was shown upon depletion of the pause release factor, Paf1 (Chen et al, 2015). To address this, we classified our expressed gene list into three equal groups (highly paused, mid‐paused, and least paused) based on their WT GROseq pausing index (ratio of promoter density to the averaged gene body density). Similar to the analysis in Fig 1D, we compared the fold change in 5′ PI between these three pausing categories using either GROseq or Pol II ChIPseq data. As shown in Fig 1E, the fold changes in 5′ PI were comparable between the three pausing categories, suggesting that the most paused, mid‐paused, and least paused genes experience similar fold‐increases in nascent transcription and Pol II distribution in the promoter‐proximal region upon Spt5 depletion. We conclude that the increase in nascent transcription and Pol II occupancy in Spt5dep cells is independent of pausing strength and relatively uniform genome‐wide.
Spt5 depletion has differential effects on Pol II CTD phosphorylation
We next analyzed the effect of Spt5 depletion on Pol II and nascent transcript levels within gene bodies during elongation. Whole‐gene meta‐analysis of GROseq and Pol II ChIPseq data showed that within gene bodies, the WT and Spt5dep tracks intersected, after which the Spt5dep signal remained lower than the WT up to the transcription termination site (TTS; Fig 2A). This indicated that at some stage during elongation in Spt5dep cells, Pol II occupancy and nascent transcription were decreased relative to WT cells. This effect was more visible in groups 1 and 2, which represent more highly expressed genes.
Figure 2. Impact of Spt5 depletion on the phosphorylation of Pol II .
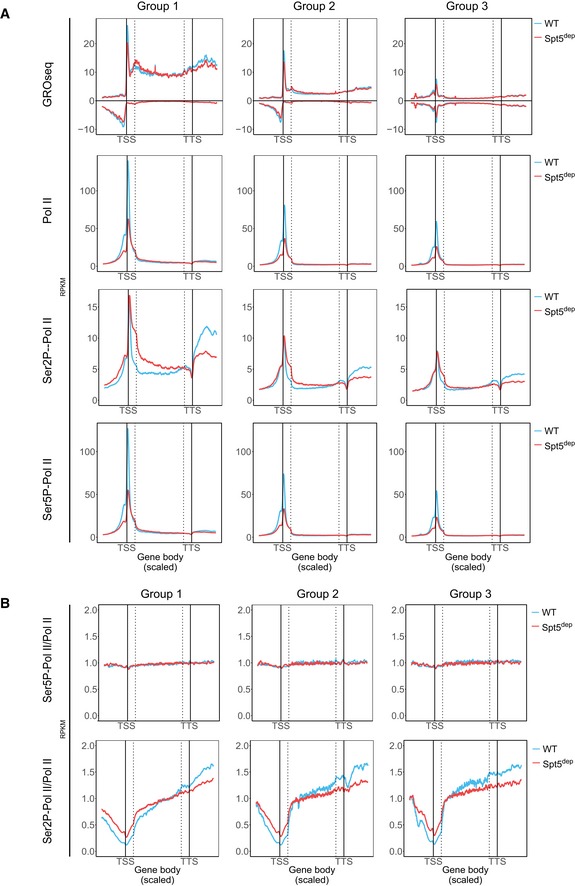
- Whole‐gene composite analysis of GROseq and total Pol II, Serine 5‐phosphorylated Pol II (Ser5P‐Pol II), and Serine 2‐phosphorylated Pol II (Ser2P‐Pol II) ChIPseq profiles in WT and Spt5dep cells. The TSS and TTS are indicated by solid lines. The dotted lines represent the TSS +500 bp and TTS −500 bp regions. For all composite plots, the region from −1,500 to +500 bp of the annotated transcription start site (TSS) is divided into 200 bins, the gene body region extending from +500 bp of the TSS to −500 bp from the annotated transcription termination site (TTS) is divided into 300 scaled bins to account for varying gene lengths, and the region from −500 bp to +1,500 bp of the TTS divided comprises 200 bins. The three gene groups, classified based on WT GROseq gene body density, are as described in Fig EV2B. Read densities are calculated in RPKM.
- Whole‐gene composite analyses based on data shown in (A) plotting the ratio of Ser5P‐Pol II and Ser2P‐Pol II densities to total Pol II density in WT and Spt5dep cells.
We next probed the phosphorylation state of Pol II at serine 5 of the Pol II C‐terminal domain (Ser5P‐Pol II), a modification that occurs upon the initiation of transcription and is hence used as an indicator of early elongating Pol II. Changes in Ser5P‐Pol II closely resembled that of total Pol II in all gene groups (Fig 2A) and analysis of the Ser5P‐Pol II to total Pol II ratio (Ser5P‐Pol II/Pol II) confirmed that this Pol II modification is not affected by the depletion of Spt5 genome‐wide (Fig 2B). We also confirmed that total protein levels of Ser5P‐Pol II were not reduced in Spt5dep cells (Fig EV3A).
Figure EV3. Western blot analysis for selected transcription initiation and elongation factors.
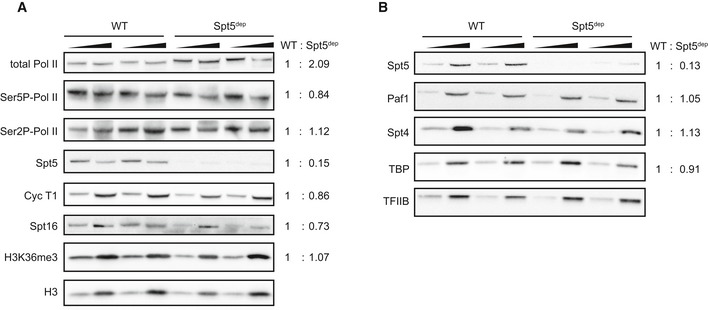
- Western blot analysis from nuclear extracts of two independent WT and Spt5dep primary MEFs preparations treated with 4‐HT for 72 h. Blots were probed for total Pol II, Ser5P phosphorylated Pol II, Ser2P phosphorylated Pol II, Spt5, cyclin T1, Spt16, H3K36me3 and histone H3 as a loading control. A twofold titration was performed for each sample. The mean of the titration was normalized to the mean of the loading control. The mean of the two H3‐normalized WT replicates was set as 1, and the ratio of the mean of both H3‐normalized Spt5dep replicates was calculated accordingly.
- Western blot analysis from extracts of two independent WT and Spt5dep primary MEFs preparations treated with 4‐HT for 72 h. Blots were probed for Spt5, Paf1, Spt4, TBP, and TFIIB as a loading control. A twofold titration of extracts was performed for each sample. Quantification was done as described in (A).
Source data are available online for this figure.
We also determined the effect of Spt5 depletion on the phosphorylation of serine 2 of the Pol II C‐terminal domain (Ser2P‐Pol II). This modification occurs promoter‐proximally via the kinases, P‐TEFb and Cdk12 during the transition from pausing to productive elongation. Therefore, it is a widely used mark of elongation‐competent Pol II. In contrast to Ser5P‐Pol II, we observed that Ser2P‐Pol II levels were increased near the 5′ ends of genes in Spt5dep cells with a decrease toward the 3′ ends (Fig 2A and B). Protein analysis confirmed that total Ser2P‐Pol II levels were not significantly changed in Spt5dep cells (Fig EV3A). These results indicate that Spt5/NELF‐mediated pausing may not be essential to recruit the Ser2 kinases, P‐TEFb and Cdk12. We conclude that Spt5‐depleted Pol II is transcriptionally engaged and elongation‐competent upon release into gene bodies.
Spt5 depletion leads to a redistribution of Pol II within gene bodies and affects the transcription of long genes
Our next goal was to determine the reason for the decrease in Pol II and nascent transcription within distal gene bodies in Spt5dep cells. We hypothesized that the elongation defect in Spt5dep cells observed in metagene composite plots could be the result of the length normalization of gene bodies inherent in the dynamic binning of gene bodies within metagene plots. Such normalization could mask a gene length‐dependent role of Spt5 in elongation as a global elongation defect. Therefore, to visualize the profiles without gene length normalization, we generated heatmaps of Spt5dep/WT ratios with static binning for genes up to 100 kb in length. As shown in Fig 3A, Spt5dep cells showed a relative decrease in Pol II and GROseq density at the TSS followed by an increase in the immediate gene bodies (note the blue region after the TSS in the heatmap indicating Spt5dep>WT; Fig 3A). However, this increase occurred up to ~15–20 kb from the TSS at most genes when the Spt5dep signal decreased relative to WT signal (note the transition from blue to orange in the heatmap in Fig 3A). This region, which we refer to as the transition zone, can be clearly visualized in examples of several individual long genes, whereas short genes (< 20 kb) show increased transcription and Pol II throughout the gene body (Figs 3B and EV4).
Figure 3. Spt5 depletion causes a redistribution of actively engaged Pol II .
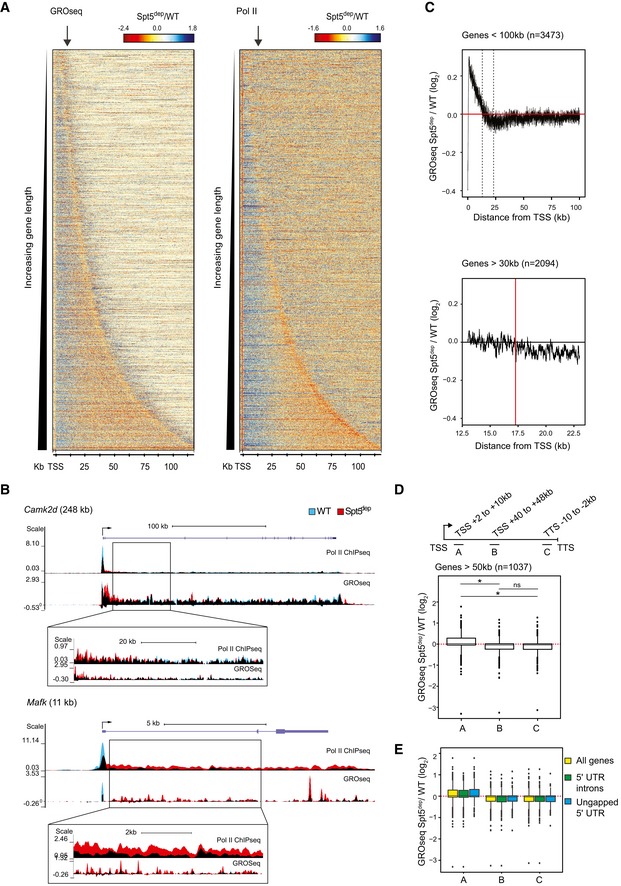
- Spt5dep/WT ratio heatmaps with static binning spanning the entire length of all expressed minus‐strand genes (n = 3,473) up to 100 kb ordered by increasing gene length. Read densities are in reads per million (RPM). The arrows within the plots indicate the point at which the WT and Spt5dep tracks intersect in the TSS‐proximal gene bodies (˜15–20 kb).
- GROseq and Pol II occupancy at a long gene (Camk2d) and a short gene (Mafk) in WT and Spt5dep cells visualized in the UCSC genome browser. WT and Spt5dep tracks are overlaid in blue and red representing WT and Spt5dep tracks, respectively, and black representing the overlap between them. The insets provide magnified views of the gene body region.
- Upper panel shows a composite metagene plot of Spt5dep/WT GROseq ratio of all expressed genes < 100 kb (n = 3,473). The dotted vertical lines demarcate the TSS +13 kb to +23 kb region magnified in the lower panel. In the lower panel, a zoom‐in view of the Spt5dep/WT GROseq ratio is shown for the TSS +13 kb to +23 kb region of all expressed genes > 30 kb (n = 2,094). The red line at TSS +17 kb highlights the transition region where the average Spt5dep GROseq signal decreases below the WT GROseq signal.
- Analysis of the Spt5dep/WT GROseq ratios at three different locations within genes for all expressed genes > 50 kb (n = 1,037). As shown in the upper panel, each region is 8 kb long and is defined as follows: front region from TSS +2 to +10 kb (A), middle region from TSS +40 to +48 kb (B) and the back region from TTS −10 to −2 kb (C). The upper panel depicts the three regions schematically and the box plot in the lower panel shows the distribution of ratios for each region. Asterisks indicate P‐value < 2.2 × 10⁻¹⁶. ns, not significant calculated using the unpaired t‐test.
- Identical analysis as in (D) above using genes > 50 kb but divided into three groups: all genes (n = 1,037), genes which have a 5′ UTR intron (n = 535) and genes without a 5′ UTR intron (n = 397). In all three gene body segments (A–C), no statistical significance was reached between the three gene categories.
Figure EV4. Examples of long and short genes showing the impact of Spt5 depletion on nascent transcription and Pol II occupancy.
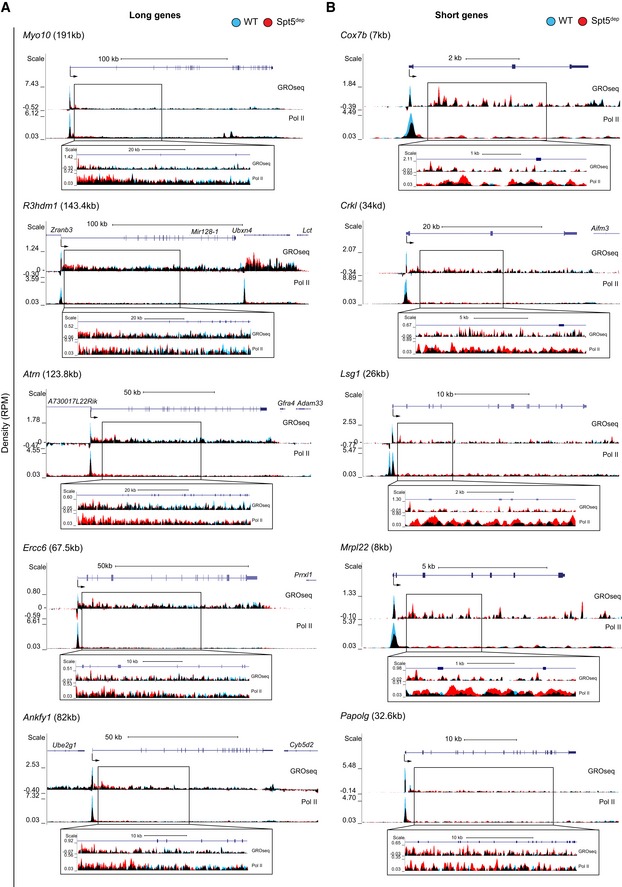
- UCSC genome browser snapshots of five long genes in WT and Spt5dep MEFs. WT and Spt5dep tracks are overlaid in blue and red representing WT and Spt5dep signal respectively, and black representing the overlap between them. The insets provide magnified views of the gene body region.
- UCSC genome browser snapshots of five short genes in WT and Spt5dep MEFs represented as in (A). The insets provide magnified views of the gene body region.
To gain further insights into the transition zone, we plotted the Spt5dep/WT ratios for genes < 100 kb (n = 3,473) along the gene body. Relative to WT cells, the average Spt5dep signal clearly decreases gradually between ~13 and 23 kb from the TSS (black dotted lines in Fig 3C, upper panel). By zooming into the TSS +13 to +23 kb region for genes > 30 kb (n = 2,094), the point where Spt5dep signal decreases below the WT signal is, on average, ~17 kb from the TSS (red line in Fig 3C, lower panel), although there is variation in the signal within this transition zone. Notably, the transition occurs in 70% of genes > 30 kb (n = 2,094), which suggests a global Spt5 dependency for optimal elongation past this point in the transcription cycle. The variation in signal in this region is likely due to the fact that the signal decreases across some distance rather than sharply at a given point and that the transition is not uniform across all genes. These features can be appreciated from various snapshots of individual genes (Figs 3B and EV4). Therefore, we conclude that the transition occurs, on average, between 15 and 20 kb from the TSS at the majority of genes.
Interestingly, the heatmap also reveals that Pol II and nascent transcript levels do not continue to decrease beyond the 15–20‐kb region but instead seem to stabilize once this decrease has occurred (in the heatmaps in Fig 3A, note the absence of a gradient in color at long genes beyond ~20 kb from the TSS up to the TTS). This feature can also be appreciated in the individual gene examples provided in Figs 3B and EV4. To address this in a more quantitative manner, we calculated Spt5dep/WT ratios for three 8‐kb regions within genes > 50 kb (n = 1,037): (i) a TSS‐proximal segment prior to the transition zone (TSS +2 to +10 kb), (ii) a gene body segment well after the transition zone (TSS +40 to +48 kb), and a region just prior to the TTS (TTS −10 to −2 kb; Fig 3D, upper panel). The results show that the Spt5dep read densities are higher than WT in the TSS +2 to +10 kb region whereas the opposite is seen in the two distal gene body segments (Fig 3D, lower panel), in line with the heatmap analysis in Fig 3A. Importantly, however, the Spt5dep/WT ratios between the TSS +40 to +48 kb and the TTS −10 to −2 kb segments are very similar (Fig 3D, lower panel), indicating that there is no further loss of Pol II complexes beyond the transition zone in Spt5dep cells. We conclude that the loss of Spt5 causes an apparent decrease in the fraction of Pol II that can extend past ~20 kb of elongation but that Spt5 depletion does not appear to alter Pol II elongation beyond this point.
To address the possibility that the altered elongation profiles in Spt5dep cells could be due to reduced expression of major elongation factors, we probed for the protein levels of subunits of the PAF elongation complex (Paf1), the FACT chromatin remodeling complex (Spt16), P‐TEFb (cyclin T), as well as the levels of histone H3 lysine 36 trimethylation, a chromatin modification associated with elongation. As shown in Fig EV3A and B, the levels of these proteins were not significantly changed upon Spt5 depletion. Spt4 levels were also relatively unchanged (Fig EV3B). Finally, levels of TBP and TFIIB, two core components of the pre‐initiation complex, were unaffected by Spt5 depletion (Fig EV3A and B).
A finer analysis of the TSS +15–20 kb transition zone did not reveal an enrichment for sequence motifs or epigenetic modifications, suggesting that the observed phenotype is not related to the nature of the DNA sequence or chromatin structure in this region. We also asked whether the elongation phenotype in Spt5dep cells was associated with genes harboring introns within their 5′ untranslated regions (5′ UTR) because such introns have been implicated in regulating multiple steps of gene expression (Furger et al, 2002; Bicknell et al, 2012; Aguilar‐Hernandez & Guzman, 2013). For this analysis, we identified genes that harbor a 5′ UTR interrupted by an intron in any of its splice isoforms, which yielded 3,773 genes out of 6,931 expressed genes (54%) in MEFs. This number is essentially similar to the percentage of all genes harboring 5′ UTR introns (8,160/15,569 genes; 52%) As shown in Fig 3E, the elongation phenotype of Spt5dep cells observed in Fig 3D was similar in genes > 50 kb with or without 5′ UTR introns.
An important concern when depleting a general transcription regulator like Spt5 is that it could lead to globally uniform changes in the transcriptome which would warrant the use of external spike‐ins to normalize deep sequencing datasets more accurately rather than using library size‐based normalization (RPM or RPKM), which relies on the assumption that there are similar amounts of protein bound to chromatin (for ChIPseq) or similar amounts of RNA (for GROseq and RNAseq) between different experimental conditions. To address this, we first performed Pol II ChIP‐qPCR at five randomly chosen long genes in MEFs. We designed primers around the TSS (promoter) as well as within the gene body 5–10 kb from the TSS (GB proximal) and beyond 50 kb from the TSS (GB distal; Fig EV5A). The ChIP‐qPCR data were normalized to the input DNA used for ChIP, which is identical in WT and Spt5dep cells and is thus an appropriate normalizer. The results showed that, relative to WT cells, Pol II occupancy in the Spt5dep cells was consistently decreased at the TSS, increased in the TSS‐proximal gene body, and decreased in the distal part of the gene body at all genes tested (Fig EV5A). Spt5 itself displayed dramatically reduced occupancy throughout the gene in Spt5dep cells, indicating that very sparse amounts of Spt5 are chromatin‐bound under these conditions (Fig EV1F and G). These results are in agreement with those from ChIPseq analysis and thus confirm that Spt5 depletion leads to increased Pol II density in proximal gene bodies but decreased Pol II densities in distal gene bodies of long genes.
Figure EV5. ChIP‐qPCR and RT–qPCR validation of Pol II occupancy, nascent transcription, and mRNA abundance between WT and Spt5dep cells.

- ChIP‐qPCR at promoters and gene bodies (GB) of five long genes in WT and Spt5dep cells. Two primer pairs probing a proximal (< 15 kb from the TSS; GB proximal) and distal (< 50 kb from the TSS, GB distal) region of the GB were used for each gene. The data were normalized to the input DNA in all cases and represented as percent of input. The plot represents three independent experiments with mean and standard deviations shown.
- RT–qPCR analysis in WT and Spt5dep cells for nascent transcript abundance using primers in intronic regions within four long and two short genes. For the long genes, the two primer pairs shown probe a proximal and distal region of the gene. Equal numbers of Drosophila S2 cells were spiked in to each sample prior to RNA extraction, and the Drosophila‐specific act5a transcript was used for normalization between WT and Spt5dep qPCR values. The plot shows the mean of three independent WT and Spt5dep samples with standard deviations.
Next, we randomly selected several long and short genes and performed RT–qPCR to measure the relative changes in pre‐mRNA levels between WT and Spt5dep cells (Fig EV5B). Although multiple technical differences preclude an absolute correlation between RT–qPCR‐based relative pre‐mRNA measurements and nascent transcription measured by GROseq, we nevertheless expected that both techniques would yield a similar trend in the abundance of pre‐mRNA between WT and Spt5dep cells. For long genes, we designed primers in proximal and distal regions within gene bodies, and for short genes, we analyzed one region within the gene body. Importantly, we spiked in the same number of Drosophila S2 cells (10% of the total) to equal numbers of WT and Spt5dep cells prior to RNA extraction, and then normalized the RT–qPCR data to the expression levels of the Drosophila‐specific housekeeping gene, act5C. We found that short genes and the proximal regions of long genes showed a small but consistent trend toward increased pre‐mRNA expression in Spt5dep cells, whereas the distal regions of long genes showed a small but clear trend toward decreased pre‐mRNA levels (Fig EV5B). Therefore, although the changes we detect are small, the trend observed at short genes, and the proximal and distal regions of long genes, are consistent with GROseq‐based observations. We conclude that Spt5 depletion results in increased Pol II density and nascent transcription in the proximal gene bodies but decreased Pol II and nascent transcripts in the distal gene bodies thus supporting the conclusions drawn from GROseq and ChIPseq. Importantly, the fact that the spike‐in‐normalized qPCR analysis of randomly selected genes recapitulates the results from ChIPseq and GROseq suggests that Spt5dep cells do not suffer from a globally uniform decrease in transcription but rather undergo a redistribution of engaged Pol II.
Changes in antisense transcription in Spt5dep cells are not correlated with changes in sense transcription
In a recent study in Schizosaccharomyces pombe, Spt5 depletion was shown to cause a global increase in antisense gene body transcripts in the TSS‐proximal region. To address the impact of Spt5 depletion on antisense transcription in MEFs, we generated ratio heatmaps (Spt5dep/WT; as described in Fig 3A) for antisense GROseq reads and compared them to the corresponding sense strand ratios. As shown in Fig EV6A, changes in gene body antisense transcripts do not show any trend toward up‐ or down‐regulation in specific regions. In particular, there was no evidence of any global change in antisense transcription in the 15–20‐kb transition zone where we detect a global decrease in Pol II occupancy and GROseq sense strand read density (Figs EV6A and B, and 3A). However, we detected differential regulation of antisense transcripts in the TSS‐proximal region (Fig EV6B). To investigate this further, we performed a k‐means clustering of the TSS −/+500 bp region based on the sense strand GROseq ratios. As shown in Fig EV6C, we observed that the TSS‐upstream antisense transcripts were globally reduced upon Spt5 depletion, in agreement with our metagene analysis in Figs 1B and 2A. However, there was no such global trend in the TSS‐downstream antisense transcripts, with both up‐ and down‐regulation being evident upon Spt5 depletion (Fig EV6C). Quantifying these trends with a box plot analysis showed that the TSS‐upstream antisense transcripts were indeed globally reduced whereas the TSS‐downstream antisense transcripts showed relatively equal distribution of up‐ and down‐regulation (Fig EV6D). We conclude that global changes in the profiles of sense transcription within gene bodies of Spt5dep cells are not correlated with changes in antisense transcription in these cells, suggesting that antisense and sense transcriptions are regulated differently with regard to their dependence on Spt5.
Figure EV6. Analysis of GROseq antisense transcripts in Spt5dep cells.
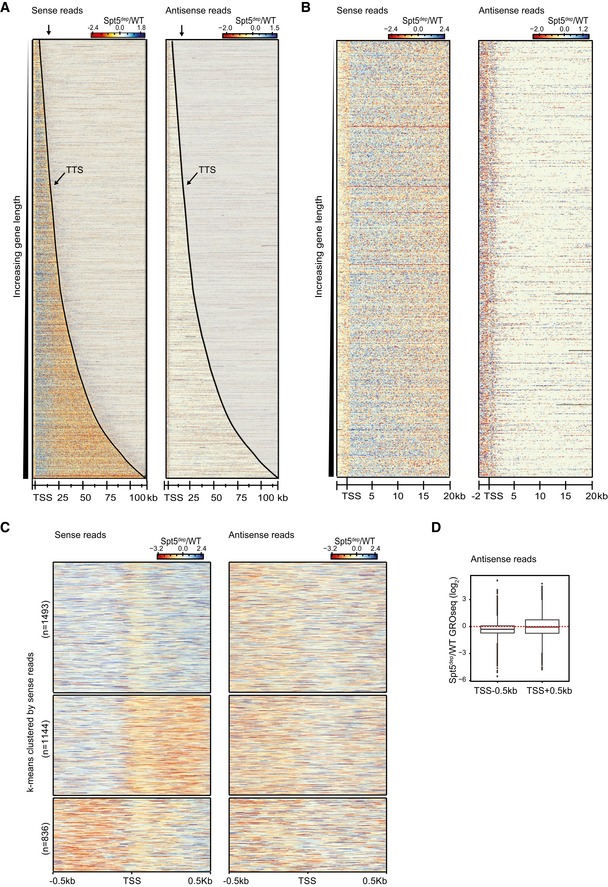
- Spt5dep/WT ratio heatmaps with static binning spanning the entire length of genes up to 100 kb long ordered by increasing gene length (n = 3,473). The sense and antisense ratio heatmaps are shown on the left and right, respectively. Read densities are in reads per million (RPM). The TTS is marked with a black line. The arrow above the plot marks the ˜17 kb region downstream of the TSS where, on average, the sense strand Spt5dep and WT signals intersect (see also Fig 3A–C).
- Ratio heatmaps in (A) focused on the TSS −2 kb to +20 kb region for genes > 25 kb (n = 1,263).
- Ratio heatmaps generated as in (A) for the TSS −/+500 bp region. The sense strand heatmap was subjected to k‐means clustering, depicted on the left, with the corresponding antisense heatmap on the right.
- Spt5dep/WT ratio box plots of GROseq antisense reads in the TSS upstream (TSS −500 bp) and TSS downstream (TSS +500 bp) regions.
Spt5‐depleted Pol II complexes are elongation‐competent up to the TTS but show delayed termination thereafter
We considered the possibility that the Pol II complexes beyond 20 kb in Spt5dep cells were elongation‐competent due to the residual Spt5 on chromatin in our system (as shown earlier in Fig EV1G and H). However, when we analyzed the extended region beyond the TTS where Pol II terminates, we observed that nascent transcription and Pol II density, especially of the elongating Ser2P‐Pol II form, was higher in Spt5dep cells. This is seen in individual gene examples (Fig 4A) and on a global scale in composite analysis of the TTS region where Spt5dep GROseq and Ser2P‐Pol II densities, and to a lesser extent, total Pol II, extend further downstream than the WT (Fig 4B). This observation clearly indicates the occurrence of delayed termination in Spt5dep cells, which is in line with similar observations made in Spt5 mutant yeast cells (Baejen et al, 2017). Importantly, this termination phenotype leads us to conclude that Pol II complexes reaching the 3′ end of genes in Spt5dep cells are indeed depleted of Spt5, suggesting that Spt5‐depleted Pol II is able to transcribe even very long genes.
Figure 4. Spt5 depletion leads to delayed transcription termination.
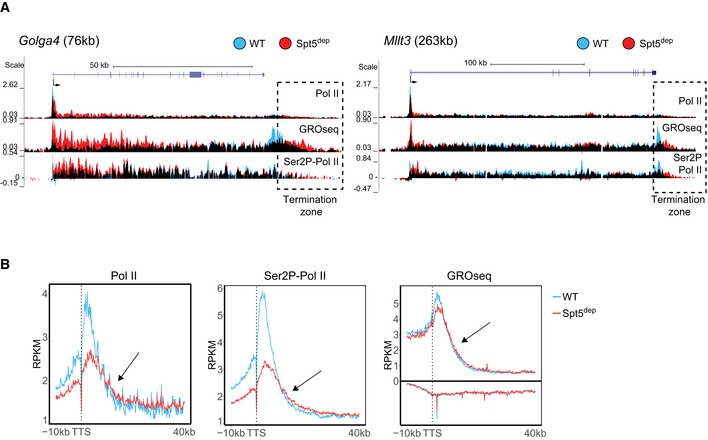
- Representative UCSC genome browser snapshots of two genes showing increased Pol II, Ser2P‐Pol II, and GROseq signal in the region beyond the transcription termination site (TTS). WT and Spt5dep tracks are overlaid in blue and red representing WT and Spt5dep signal, respectively, and black representing the overlap between them. The boxed area highlights the region (termination zone) where Pol II occupancy and nascent transcription extend further downstream in Spt5dep cells relative to WT cells.
- Composite metagene plots of GROseq, Pol II, and Ser2P‐Pol II density −10 kb to +40 kb from the TTS for all expressed genes > 50 kb (n = 1,739) in WT and Spt5dep MEFs. The arrows point to the region within the termination zone where Spt5 depletion leads to the extension of the termination zone.
Increased transcription in Spt5dep cells results from increased initiation rather than a change in elongation rate
To explain the altered distribution of Pol II in Spt5dep cells, we considered two possible scenarios. Increased nascent transcription can result from increased transcription initiation. If initiation rates are increased, then the decrease in Pol II density and nascent transcription between 15 and 20 kb of the TSS in Spt5dep cells (Fig 3A) would have to be accounted for by a decrease in Pol II processivity in this region, which, in turn, would lead to relatively decreased expression of longer genes. However, an alternative explanation for our observations is that Spt5 depletion leads to changes in the elongation rate of Pol II. For instance, the increased Pol II density and nascent transcription in proximal gene bodies could result from a decrease in elongation rate manifested by a pile‐up of slower moving Pol II. Conversely, decreased Pol II in distal gene bodies could result from an increase in elongation rate, that is, faster moving Pol II.
To address these possibilities, we performed mRNA sequencing (mRNAseq) to address the relationship between mRNA levels and nascent transcription. As described (Booth et al, 2016), this relationship can be used to infer global changes in elongation or initiation rates between experimental conditions. Essentially, if elongation rates are not significantly altered, nascent transcript levels should correlate with mRNA levels. Conversely, if elongation rates are altered, but initiation rates are unaffected, changes in nascent transcription would not be reflected in the mRNA pool (Ehrensberger et al, 2013; Booth et al, 2016). We performed mRNAseq from three WT and three Spt5dep replicates (Fig EV2C) and calculated differential gene expression using the DESeq2 package (Love et al, 2014). We considered significantly up‐ or down‐regulated genes (P < 0.05) exhibiting a fold change greater than 1.5. This analysis yielded 368 up‐regulated genes and 223 down‐regulated genes in Spt5dep cells (Fig 5A). Importantly, the differentially expressed genes did not include components of major elongation factors such as the super elongation complex (SEC; Luo et al, 2012), PAF complex (Shi et al, 1996; Kim et al, 2010), FACT complex (Orphanides et al, 1998; Pavri et al, 2006), or the histone H2B ubiquitination machinery (Pavri et al, 2006; Kim et al, 2009). This is in agreement with the protein analysis for some of these factors shown in Fig EV3 and suggests that the elongation phenotype in Spt5‐depleted cells does not result from compromised expression of important regulators of elongation. Furthermore, global splicing defects were not evident upon Spt5 depletion as determined by 5′ splice junction usage in WT and Spt5dep MEFs (Fig 5B), which argues against major changes in splicing efficiency upon Spt5 depletion.
Figure 5. Changes in nascent transcription upon Spt5 depletion correlate with mRNA abundance.
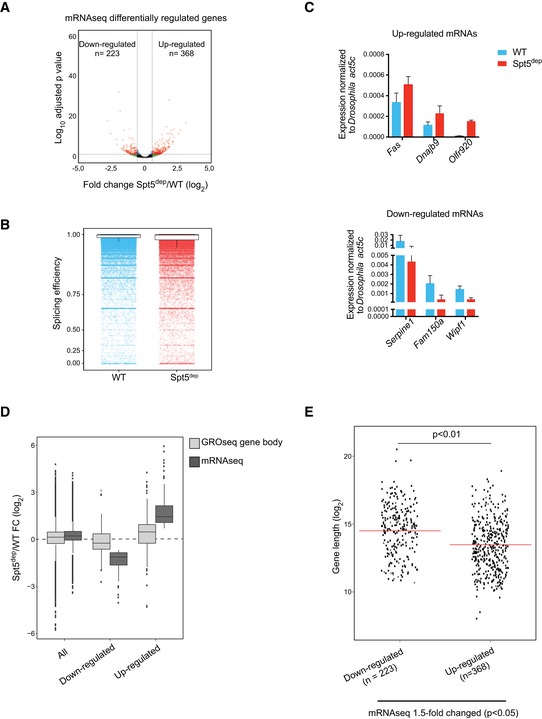
- Volcano plot of mRNAseq data, performed in triplicate, from WT and Spt5dep MEFs comparing fold change (Spt5dep/WT) versus the adjusted P‐value calculated using the DESeq2 package. The up‐ and down‐regulated genes indicated show a fold change of > 1.5 and P‐value < 0.05.
- Splicing efficiency (spliced/total reads) calculated on merged mRNAseq data from three replicates of Spt5dep and WT MEFs. A total of 185,149 splice sites were analyzed. The mean‐per‐junction splicing efficiency for all splice sites is plotted as scatter boxplots where 1 indicates complete splicing efficiency.
- RT–qPCR for mRNA abundance in WT and Spt5dep cells of three up‐regulated and three down‐regulated genes selected from mRNAseq differential gene expression analysis. Drosophila S2 cells were spiked in as in Fig 4B, and WT and Spt5dep qPCR values were normalized against the Drosophila‐specific act5a transcript. The plot shows the mean of three independent WT and Spt5dep samples with standard deviations.
- Box plots showing the fold changes (Spt5dep/WT) in GROseq gene body (TSS +500 bp to TTS) density and mRNAseq abundance upon Spt5 depletion. Fold changes are shown for all genes, genes significantly down‐regulated in Spt5dep cells by > 1.5‐fold in mRNAseq (n = 223, P < 0.05) and genes significantly up‐regulated in Spt5dep cells by > 1.5‐fold in mRNAseq (n = 368, P < 0.05). The P‐values were calculated using the unpaired t‐test.
- Scatter dot plots showing the gene length distribution of > 1.5‐fold significantly up‐ or down‐regulated genes obtained from mRNAseq analysis. The red line marks the median of the distribution. Statistical significance was calculated by the Student's t‐test.
To confirm the results from mRNAseq, we performed RT–qPCR analysis of selected up‐ and down‐regulated mRNAs in WT and Spt5dep cells. Although mRNAseq‐ and RT–qPCR‐based measurements of relative mRNA levels cannot be directly correlated in quantitative terms, we expected that RT–qPCR would recapitulate the general trend of mRNA abundance calculated from mRNAseq. We performed RT–qPCR with spiked‐in Drosophila S2 cells for normalization exactly as described in Fig EV4B using primer pairs flanking distal exon–exon junctions. In all cases, we found that the trends observed in RT–qPCR from Spt5dep cells relative to WT cells reflected the mRNAseq‐based measurements, that is, the up‐ and down‐regulated mRNAs identified from mRNAseq consistently showed increased or decreased RT–qPCR signal in Spt5dep cells, respectively (Fig 5C). Importantly, combined with the results from pre‐mRNA RT–qPCR and ChIP‐qPCR (Fig EV5), this further supports the conclusion that Spt5dep cells do not experience uniform global changes in their transcriptome relative to WT cells.
To determine whether changes in nascent transcription upon Spt5 depletion were reflected in the mRNA pool, we used GROseq gene body densities (TSS +0.5 kb to TTS) as a measure of nascent transcription activity and we calculated the fold change in nascent transcription between Spt5dep and WT cells (Spt5dep/WT; Booth et al, 2016). GROseq gene body read density was slightly increased on a global scale upon Spt5 depletion (Fig 5D). Applying the same fold change calculation to our mRNAseq datasets, we observed a similar increase in mRNA levels upon Spt5 depletion. We then performed the same analysis using only the 1.5‐fold up‐regulated (n = 368) or down‐regulated (n = 223) genes from mRNAseq analysis. Genes with up‐regulated mRNAs showed generally increased nascent transcription in their gene bodies, and conversely, genes whose mRNAs were down‐regulated showed a clear trend toward decreased nascent transcript synthesis (Fig 5D). Thus, there is a direct correlation between fold changes in mRNA abundance and nascent transcription in Spt5dep cells. This correlation further supports the notion that the elongation phenotype we observe is not a secondary effect caused by compromised expression of global elongation factors.
We note the lack of an absolute correlation between the fold changes in mRNA and gene body nascent transcripts, which could result, in part, from the fact that GROseq measures ongoing nascent transcription during a 5‐min pulse with labeled nucleotides whereas mRNAseq measures the steady‐state mRNAs accumulated over long periods and subject to multiple surveillance mechanisms.
Based on the fact that we detected higher nascent transcripts in short genes and lower nascent transcripts in the distal portion of long genes in Spt5dep cells (Figs 3A and B, and EV5B), we hypothesized that if elongation rates were unchanged upon Spt5 depletion, mRNAs from short genes would be preferentially enriched in the up‐regulated category, and conversely, that mRNAs from long genes would be enriched in the down‐regulated category in Spt5dep cells. As seen in Fig 5E, the 1.5‐fold up‐regulated genes (n = 368) are indeed generally shorter than the 1.5‐fold down‐regulated genes (n = 223), and this difference is significant (P < 0.01, Student's t‐test). Taken together, the correlation between nascent transcription and mRNA expression argues that the increased transcription from promoters in Spt5dep in cells derives from increased initiation, most likely via the reduced residence time of paused Pol II. These findings further argue that global elongation rates are not significantly affected in these cells.
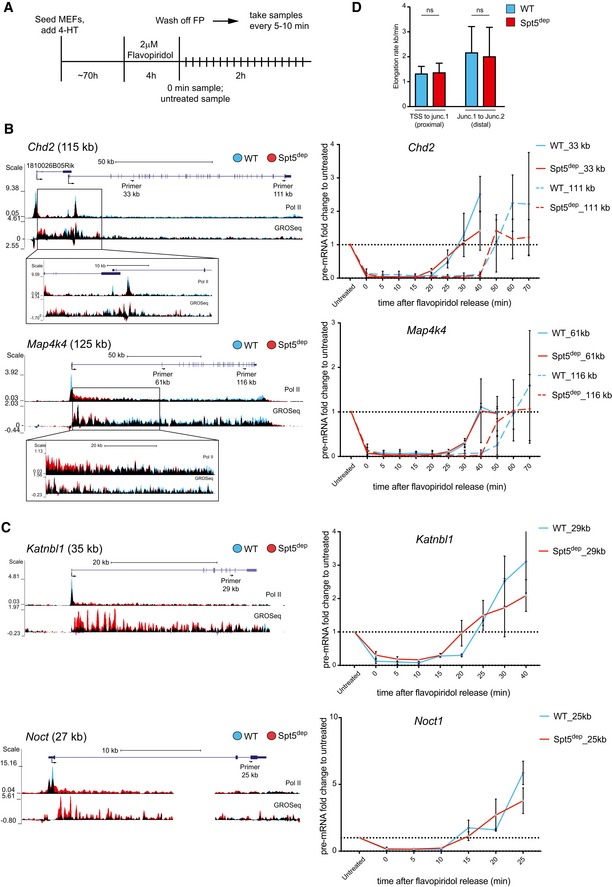
To address this directly, we measured the elongation rate of selected long and short genes using Flavopiridol (FP), a broad‐spectrum kinase inhibitor that, in the context of transcription elongation, inhibits Ser2 phosphorylation of Pol II by P‐TEFb. FP treatment blocks the transition from paused Pol II to elongating Pol II and thereby effectively synchronizes the transcription cycle at the promoter‐proximal pausing stage. Upon release into FP‐free media, we collected total RNA samples every 5 min and determined the time when the first wave of Pol II arrived at proximal and distal intron–exon junctions along the gene using pre‐mRNA RT–qPCR analysis using the untreated sample as a reference (Fig 6A and Materials and Methods). Given this temporal information and the known distance between the two analyzed junctions, the elongation rate can be estimated (Singh & Padgett, 2009). Importantly, by analyzing only the first wave of Pol II elongation at different viewpoints, the measured elongation rate is independent of the initiation rate.
Figure 6. Elongation rates are not altered upon Spt5 depletion.
-
AExperimental scheme for elongation rate measurements. Following 72 h of 4‐HT treatment, WT and Spt5dep cells were treated with 2 μM Flavopiridol for 4 h. Flavopiridol was washed off, cells were transferred to drug‐free medium and aliquots were taken immediately (0 h) and at 5–10 min intervals for up to 2 h. Samples were then processed for pre‐mRNA RT–qPCR analysis.
-
B, CElongation rate measurements for two long (B) and two short (C) genes in WT and Spt5dep cells following Flavopiridol inhibition and release into drug‐free medium. The UCSC genome browser view of each gene is shown on the left with a zoom‐in view on the transition zone in the early TSS‐proximal gene body as highlighted with the black box. The corresponding pre‐mRNA RT–qPCR analysis is shown on the right. In the browser profile, WT and Spt5dep tracks are overlaid in blue and red representing WT and Spt5dep tracks respectively, and black representing the overlap between them. The location and distance of each qPCR primer pair from the TSS is indicated. The RT–qPCR data for each time point are normalized to the value of the untreated sample (= 1). The elongation rate is calculated using the time point at which the qPCR curves reach the value of the untreated sample (shown as a dotted line). Data represent three independent replicates showing the mean and standard deviation for each sample.
-
DAnalysis of proximal elongation rate (for the region between the promoter‐proximal paused site and the first intron–exon junction analyzed by RT–qPCR) and distal elongation rate (for the region between the first and second intron–exon junctions analyzed by RT–qPCR) between WT and Spt5dep cells. For the proximal rate, the eight long genes and the two short gene genes were analyzed (n = 10). For the distal rate, only the eight long genes were analyzed (n = 8). Data were analyzed as in Fig 6B and C. ns., not significant by the Student's t‐test.
We chose eight long genes and two short genes for this analysis. For long genes, we designed primers at a proximal and distal intron–exon junction (Fig 6B). For short genes, we chose only one distal intron–exon junction as the viewpoint (Fig 6C). We observed that the qPCR curves of the proximal and distal intron–exon junctions rose at the same time point in WT and Spt5dep cells. This suggests that in both WT and Spt5dep cells, Pol II arrives at the proximal and distal junctions at approximately the same time after FP removal (Fig 6B and C). Consequently, the calculated elongation rates between WT and Spt5dep cells are similar (Fig 6D). Interestingly, the elongation rate between the early and late junctions averaged 2.5 kb/min, whereas the rate calculated for Pol II to reach the first junction after FP removal averaged 1.3 kb/min (Fig 6D). This suggests that the rate of transcription is slower near the 5′ end of genes than at the 3′ end, which agrees with genome‐wide kinetic studies in mammalian cells showing that Pol II accelerates into the gene body upon release from pausing and reaches its maximum speed after ~15 kb of elongation (Danko et al, 2013; Jonkers et al, 2014). Indeed, the early and late elongation rates calculated here are in the same range as those reported in these studies.
Collectively, these results, albeit at a limited set of genes, show that the elongation rate of Pol II is not significantly affected by Spt5 depletion. In combination with the global correlation between mRNA abundance and nascent transcription (Fig 5D), these results strongly argue that the changes in Pol II and nascent transcription in Spt5dep cells are not due to changes in elongation rate, but rather the result of increased transcription initiation. This suggests that the decrease in Pol II density and nascent transcription 15–20 kb from the TSS is due to the loss of some Pol II complexes during elongation through this zone. Thus, the region between 15 and 20 kb from the TSS appears to serve as a new and unanticipated checkpoint where Spt5 plays an important, but not essential, role in promoting the processivity of Pol II complexes. As a result, longer genes show a greater dependency on Spt5 for normal mRNA expression than shorter genes.
Discussion
In this study, we investigated the role of Spt5 in transcription at a genome‐wide level in MEFs. We find that Spt5 regulates Pol II processivity within a specific, narrow region within gene bodies, specifically, ~15–20 kb from the TSS. In addition, we find that attenuation of Spt5‐dependent pausing leads to global increases in nascent transcription from promoters, which is independent of pausing strength or expression level and therefore most likely originates from increased initiation events. Below, we discuss these results and their implications for gene regulation.
Increased transcription upon Spt5 depletion provides insights into the relationship between pausing and initiation
We observe that attenuation of Spt5‐mediated pausing caused globally increased transcription in gene bodies and that the fold‐increases were independent of the degree of nascent transcription. Several lines of evidence presented in our study suggest that increased transcription in Spt5dep cells is due to increased transcription initiation rather than decreased elongation rate. Most strikingly, the fold‐increase in nascent transcription at 5′ ends in Spt5dep cells was not correlated with pausing strength. This contrasts with what was observed upon knockdown of the pause release factor, Paf1, where the strength of pausing directly correlated with the increase in nascent transcription (Chen et al, 2015). This implies that increased pause release is not the major cause of increased transcription in Spt5dep cells. These findings lead us to conclude that reduced Spt5‐mediated pausing increases transcription initiation, suggesting that pausing normally has an inhibitory effect on initiation.
It is interesting to note that depletion of the pausing factor, NELF, in Drosophila cells led to globally decreased Pol II occupancy at promoters. This observation was explained by a model wherein paused Pol II prevents the occlusion of promoters by nucleosomes and thereby maintains an active or poised transcriptional state (Gilchrist et al, 2010; Core et al, 2012). In contrast, in murine ES cells and MEFs, pausing strength does not correlate well with nascent transcription (Min et al, 2011). Moreover, NELF depletion in ES cells shows relatively mild changes in global Pol II occupancy at active promoters (Rahl et al, 2010; Williams et al, 2015). Thus, the consequences of reduced pausing on transcriptional output seem to differ between Drosophila and mammalian cells. Strikingly, increased transcription start site‐associated nascent RNAs (Start‐RNAs) were detected at a large number of genes upon conditional ablation of the NELF‐B subunit of NELF in mouse ES cells (Williams et al, 2015). This is highly suggestive of increased transcription initiation and further supports the notion that pausing plays a role in regulating initiation frequencies in mammalian cells.
Our findings fit a model where the presence of paused Pol II restricts the rate of initiation, that is, the number of new Pol II molecules entering the PIC (Fig 7). Indeed, in silico mechanistic modeling of promoter‐proximal Pol II peaks suggested that paused Pol II could sterically hinder the binding of newly initiating Pol II (Ehrensberger et al, 2013). Empirical support for this model has recently been obtained from a study in Drosophila cells using ChIP‐nexus, which revealed that the half‐life of paused Pol II correlates inversely with the presence of initiating Pol II, and moreover, that Flavopiridol‐mediated inhibition of Pol II pause release leads to a reduction in the fraction of initiating Pol II (Shao & Zeitlinger, 2017). Another recent study used analog‐sensitive Cdk9 inhibition and a novel means of calculating initiation frequency and pause duration to reach similar conclusions regarding the control of initiation by pausing (Gressel et al, 2017). Our findings serve as a corollary to these data by showing that decreased pausing leads to increased initiation. Taken together, we conclude that the restriction of transcription initiation by Pol II pausing may serve as an important and conserved step to regulate gene expression across metazoan systems. For example, some enhancers may function by modulating the residence time of paused Pol II, which could serve as an ideal means to control developmental gene expression or the response to environmental signals.
Figure 7. Mechanistic model for the role of Spt5 and Pol II pausing in the regulation of initiation, and for the role of Spt5 during elongation.
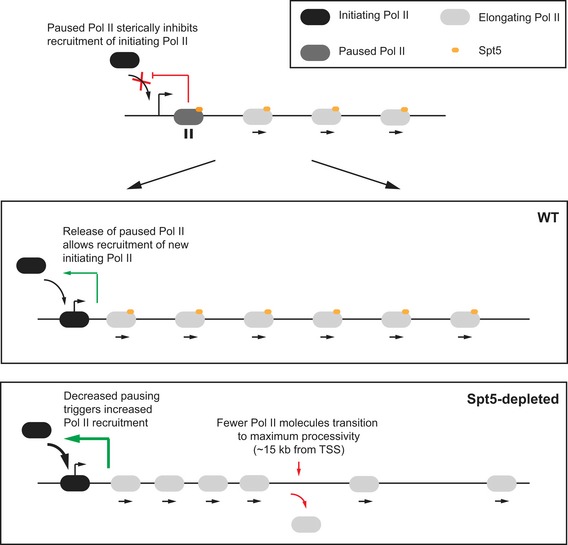
In the WT situation, promoter‐proximal paused Pol II inhibits new initiating Pol II from being recruited probably via steric hindrance if paused Pol II is located too close to the PIC or if Pol II was paused further downstream of the TSS resulting in a pile‐up of Pol II behind it. Once paused Pol II is released into productive elongation, a new initiating Pol II can be recruited into the PIC. As a consequence, if the duration of paused Pol is decreased, such as upon Spt5 depletion, the frequency of new Pol II recruitment into the PIC would increase resulting in more rounds of initiation and more Pol II release into the gene body. Furthermore, as shown in this study, Spt5 depletion also decreases the number of Pol II complexes that elongate further than 15–20 kb from the TSS. Kinetic analysis of elongating Pol II in mammalian cells has shown that Pol II accelerates into gene bodies and transitions to its maximum speed and processivity ~15 kb from the TSS (Danko et al, 2013; Jonkers et al, 2014). We propose that Spt5 facilitates, but is not essential for, this transition to maximal processivity. In effect, the presence of Spt5 maximizes the number of Pol II molecules that can successfully transition to full processivity. In its absence, fewer Pol II molecules are able to successfully navigate past this zone and reach the end of genes. Importantly, the data show that Pol II complexes that do progress past this transition stage are not dependent on Spt5 for further elongation and processivity. As a result, reduced Spt5 levels would be expected to cause gene expression changes, especially of long genes, over time.
Spt5 depletion does not dramatically affect global elongation in MEFs
An important finding in this study is that Spt5 depletion in MEFs did not lead to dramatic elongation defects, suggesting that elongation can occur despite 85–90% loss of Spt5 protein. Importantly, we find that Spt5 depletion does not alter elongation rates at all analyzed genes. The fact that mRNA abundance generally reflected the changes in nascent transcription further argues for the absence of a global defect in elongation rate. These results are consistent with a recent report in HeLa cells, where Spt5 depletion with shRNA did not lead to changes in elongation rate at all assayed genes (Diamant et al, 2016). Since, under our conditions, Spt5 protein was depleted by 85–90% relative to wild‐type levels, we think it unlikely that normal elongation rates could be maintained by residual Spt5 protein in these cells. Therefore, we conclude that other factors likely compensate for limiting Spt5 levels to ensure normal elongation kinetics in MEFs.
Changes in antisense transcription within gene bodies did not correlate with the changes in sense transcription. The most visible trend was observed in the TSS‐proximal region where TSS‐upstream antisense transcripts were globally reduced in Spt5dep cells, whereas TSS‐downstream antisense transcripts were up‐ or down‐regulated in equal measure. It is currently unclear whether or how changes in antisense transcription impact upon sense transcription. Nevertheless, these results suggest that in contrast to the global up‐regulation of antisense gene body transcription upon Spt5 depletion in S. pombe (Shetty et al, 2017), mammalian cells may regulate antisense transcription via a different mechanism.
Spt5 has been implicated in the recruitment of the mRNA capping enzyme and in mRNA processing (Wen & Shatkin, 1999; Pei & Shuman, 2002; Lindstrom et al, 2003; Mayer et al, 2012). Although we have not directly analyzed mRNA capping or stability in this study, the fact that there is good agreement between the changes in nascent transcription and mRNA levels upon Spt5 depletion suggests that mRNA processing is not significantly affected by the depletion of Spt5. This is supported by our observation that global splicing efficiency in Spt5‐depleted cells is comparable to WT cells. Finally, we also observe a relatively small number of differentially expressed mRNAs upon Spt5 depletion (591 mRNAs with a 1.5‐fold change). These data collectively suggest that, on a global scale, Spt5 depletion in MEFs does not have major effects on mRNA processing and turnover, but we cannot exclude that some mRNAs may be dependent on Spt5 for optimal processing. In line with these observations, a previous study analyzing NF‐kB‐responsive genes has shown that Spt5 depletion had only a selective impact on mRNA capping (Diamant et al, 2012).
It is interesting to note that although Spt5 is complexed with Spt4, their depletion or ablation yields different results. For instance, genetic ablation of Spt4 in yeast globally increased nascent transcription in gene bodies, which was interpreted to be the result of slower elongating Pol II (Booth et al, 2016). However, depletion of Spt5 protein in yeast led to a severe defect in transcription genome‐wide (Shetty et al, 2017). Differences between Spt4 and Spt5 were also noted with regards to their role in antisense transcription. Whereas Spt5 depletion in S. pombe led to globally increased antisense transcription (Shetty et al, 2017), Spt4 ablation in S. pombe showed decreased antisense transcription (Booth et al, 2016). In HeLa cells too, Spt4 knockdown did not lead to the transcription defects that were observed upon Spt5 knockdown (Diamant et al, 2016). Together with our observation that Spt4 protein levels are unaffected by Spt5 depletion, it seems unlikely that Spt4 compensates for the absence or reduction of Spt5. Thus, Spt5 and Spt4 may have non‐overlapping functions in transcription and different biological systems may show varying dependencies on Spt4 and Spt5.
Identification of an Spt5‐dependent regulatory step during elongation within gene bodies
A major conclusion of our study is that Spt5 increases the fraction of Pol II molecules that stay processive beyond 15–20 kb of elongation and that this impacts on the expression of long genes. This conclusion was drawn from the following observations: (i) Pol II density and nascent transcription were increased near the 5′ ends of genes in Spt5dep cells, but this increase extended only up to ~15 kb from the TSS. (ii) Between ~15 and 20 kb, Spt5dep cells exhibited a striking and rapid decrease in Pol II and nascent transcription. (iii) Following this decrease, no further loss of Pol II or nascent transcription was discernable until the TTS, even at very long genes. This suggests the presence of a novel, Spt5‐dependent regulatory step in transcription that occurs after 15 kb of elongation and is restricted to a narrow window 15–20 kb from the TSS. Since elongation rates were not decreased, the simplest mechanistic explanation is that the absence of Spt5 causes a fraction of Pol II molecules to be dislodged 15–20 kb from the TSS but that the Pol II complexes that persist are elongation‐competent and can successfully transcribe to the ends of long genes.
We are unaware of any elongation‐associated chromatin feature that correlates with the altered transcriptional landscape observed in Spt5dep cells, which could explain these results. However, our observation of a regulatory step in transcription 15 kb from the TSS is highly reminiscent of kinetic studies from ES cells, MCF‐7 breast cancer cells, and AC16 cardiomyoctes where it was shown that upon release into productive elongation, Pol II gradually accelerates into the gene body up to ~15 kb from the TSS at which point it transitions to a final state of maximum elongation speed (Danko et al, 2013; Jonkers et al, 2014). Combining these findings with our own, we propose that the major function of Spt5 in elongation is to facilitate the efficient transition of Pol II from the accelerating state to the fully processive state ~15 kb from the TSS. The decrease we observe beyond this point in Spt5‐depleted cells likely corresponds to the fewer Pol II molecules that made the transition to full processivity.
In sum, our data suggest a model, shown in Fig 7, wherein (i) Spt5 is required for Pol II processivity but only within a narrow window 15–20 kb from the TSS when Pol II transitions from the accelerating to fully processive state, and (ii) Spt5 is not essential for elongation and processivity of those Pol II complexes that do proceed past this point. Consequently, the presence of Spt5 is more important for the normal mRNA expression levels of long genes rather than short genes, as shown in this study. Taken together, we propose that the transition of elongating Pol II from the acceleration phase to full processivity comprises a new, regulated step during transcription and that Spt5 facilitates, but is not essential for, this transition.
Notably, yeast cells in which Spt5 protein was depleted by auxin degron‐mediated proteolysis revealed an Spt5‐dependent barrier to elongation ~500 bp from the TSS of most genes (Shetty et al, 2017). Moreover, analog‐sensitive inhibition of yeast Kin28 kinase, the mammalian Cdk7 homolog, also revealed a very similar early elongation checkpoint as well as a gene length‐dependent effect of Pol II elongation (Rodriguez‐Molina et al, 2016). Since Spt5 is a putative substrate of mammalian Cdk7 (Larochelle et al, 2006) and Spt5 phosphorylation was decreased upon Kin28 inhibition (Rodriguez‐Molina et al, 2016), it is likely that some measure of the elongation phenotype in Spt5dep MEFs reflects the importance of Spt5 phosphorylation in mammalian cells as well. Since yeast genes typically do not exceed a few kilobases in length (average gene length of 1.6 kb) and are therefore much shorter than mammalian genes, which average 15 kb and can extend beyond 200 kb, we could speculate that this Spt5‐dependent elongation checkpoint in yeast is equivalent to the 15‐ to 20‐kb transition zone we observe in MEFs. However, a key difference is that transcription is strongly inhibited after the 500‐bp barrier in yeast upon Spt5 depletion (Shetty et al, 2017), whereas we observe reduced, but otherwise seemingly normal, transcription beyond the 15‐ to 20‐kb region in Spt5dep MEFs. Thus, Spt5‐depleted MEFs do not suffer from severe processivity defects like in yeast, suggesting that elongation and Pol II processivity in yeast are more sensitive to reduced Spt5 levels than metazoan cells. We speculate that metazoan‐specific elongation factors like the ELL protein family (Luo et al, 2012) or the RECQL5 elongation factor (Saponaro et al, 2014) may contribute toward Pol II processivity and thereby compensate for the loss of Spt5 to some extent.
In summary, we have identified an additional regulatory step in the transcription cycle dependent on Spt5, and in the process, uncovered an additional role of Spt5 in mammalian elongation. Since Spt5 has been proposed to have various co‐transcriptional roles, the tools developed here will be useful in probing the contribution of Spt5 to these events on a genome‐wide scale and thus gain deeper insight into the role of Spt5 in mammalian biology.
Materials and Methods
Generation of Supt5h Fl/− Rosa26 Cre‐ERT2/+ mice and Spt5dep mouse embryonic fibroblasts (MEFs)
Transgenic mice were generated using a targeting vector obtained from the Sanger Consortium. This construct had exons 12–14 of Supt5h flanked by loxP sites. For selection, a splice acceptor‐β–galactosidase‐poly(A) cassette followed by a phosphoglycerate kinase (PGK) promoter‐driven neomycin resistance (Neo R) cassette were inserted, both of which were flanked by FRT sites (Fig EV1A). Flp recombinase‐expressing mice (Flpe; Farley et al, 2000) were used to delete the NeoR and β–galactosidase cassettes, thus generating Supt5h5 Fl/+ mice (Fig EV1A). Supt5h −/+ heterozygous mice were generated by breeding Supt5h Fl/+ mice to EIIa‐cre‐expressing mice (Lakso et al, 1996), which express Cre recombinase during early embryogenesis (Fig EV1A). Spt5Fl/+ mice were bred to each other to obtain homozygous Spt5Fl/Fl mice. Supt5h −/+ mice were bred with a Rosa26 Cre‐ERT2/+ line (Ventura et al, 2007) and the resulting Supt5h −/+ Rosa26 Cre‐ERT2/+ line was crossed with Spt5Fl/Fl mice to obtain the final genotype, Supt5h Fl/− Rosa26 Cre‐ERT2/+, which were used for all experiments in this study. All mice in this study were maintained in the C57BL/6 background. All animals were housed in the IMBA‐IMP animal facility in standard IVC cages with HEPA filtering. All animal experiments were conducted as per the ethical guidelines laid down by the IMBA‐IMP animal facility in compliance with all Austrian and EU law.
Primary MEFs were prepared from d13.5 Supt5h Fl/− Rosa26 Cre‐ERT2/+ and Rosa26 Cre‐ERT2/+ embryos and cultured in complete DMEM. Following three passages, primary MEFs were treated with 2 μM 4‐HT for 72 h (referred to in this study as Spt5dep) and then harvested for all downstream applications. Genotyping was performed to confirm deletion of the floxed exons (Fig EV1D). Nuclei were isolated as described (Dignam et al, 1983), and extracts were prepared by sonication and incubation in RIPA buffer.
Antibodies and primers
All antibodies and primers used in this study are listed in Tables EV2 and EV3.
Chromatin immunoprecipitation (ChIP)
ChIPseq and ChIP‐qPCR were performed as described without modifications (Pavri et al, 2010).
Global run‐on sequencing (GROseq)
Following cell membrane lysis with hypotonic buffer, nuclei were isolated via sucrose gradient density centrifugation. GROseq was performed as described (Core & Lis, 2008). Briefly, 10 million nuclei were used per reaction, and the run‐on was performed for 5 min with NTPs with a limiting concentration of P32‐dCTP and dBrdUTP followed by extraction of RNA with TRIzol reagent (Thermo Fisher, 15596026). Library preparation was performed following the protocol generously provided by Dr. John Lis (Cornell University).
mRNAseq
RNA extraction and library preparation for mRNAseq were performed using the TruSeq kit from Illumina following their instructions.
Next‐generation sequencing
All genomic libraries were sequenced on Illumina HiSeq 2000 systems by the next‐generation sequencing facility at the Vienna Biocenter Core Facilities (VBCF).
Drosophila S2 spike‐in normalized RT–qPCRs
After 72 h of 4‐HT treatment, WT and Spt5dep MEFs were harvested and counted. Drosophila S2 cells were spiked in at a ratio of 4:1 (4 × 10⁵ MEFs and 1 × 10⁵ Drosophila S2 cells). The cells were mixed and stored in TRIzol reagent (Thermo Fisher, 15596026) at −80°C. After obtaining total RNA according to the manufacturer's protocol, we treated the sample with RNase‐free DNaseI (Qiagen, 79254) in 100 ml reaction volume off the column according to the manufacturer's protocol. Following DNA removal, total RNA was again isolated with TRIzol. Next, cDNA synthesis was performed with the Superscript II RT enzyme (Thermo Fisher, 18064014) on 500 ng of DNase‐free total RNA with random hexamer primers (Roche, 11034731001) following manufacturer's instructions. RT–qPCRs were performed in triplicates in 20 μl total volume in a Bio‐Rad CFX Connect real‐time PCR detection system with GoTaq qPCR master‐mix (Promega, A6001). As a negative control to check for genomic DNA contamination, we ran samples not treated with Superscript II RT. We used the C t threshold cycle determined by the CFX Manager software in accordance with the method to analyze RT–qPCR data, with Drosophila S2 act5c gene as spike‐in normalization reference.
Elongation rate experiments
Elongation rate experiments were performed generally as described (Singh & Padgett, 2009; Saponaro et al, 2014) were grown for 72 h with 4‐HT in 6‐well plates before the addition of 2 μM Flavopiridol (Sigma, F3055) for 4 h to inhibit transcription and allow full run‐off of elongating Pol II molecules. After two consecutive PBS washes, transcription inhibition was released by the addition of fresh complete medium. Every 5 min, one well was washed with PBS and directly lysed in TRIzol reagent (Thermo Fisher, 15596026) at −80°C. Total RNA was isolated following the instructions for the TRIzol reagent. 500 ng of total RNA was used for cDNA synthesis with the Superscript II RT enzyme (Thermo Fisher, 18064014) and random hexamer primers (Roche, 11034731001) following the manufacturer's instructions. RT–qPCRs were performed in triplicates in 20 μl total volume in a Bio‐Rad CFX Connect real‐time PCR detection system with GoTaq qPCR master‐mix (Promega, A6001). We used the C t threshold cycle determined by the CFX Manager software in accordance with the method to analyze RT–qPCR data. The ratio relative to the untreated control sample is plotted.
Bioinformatics
Read mapping
mRNAseq: Adapters were trimmed from the 3′ ends of the reads with cutadapt v1.10 (Martin 2011). The trimmed reads larger than 18 nt were aligned against the rDNA of the respective organism using bowtie2 v 2.1.0 (Langmead and Salzberg, 2012; –sensitive‐local –score‐min G,30,8 ‐N 0 –ignore‐quals) to remove the rRNA reads. The rRNA cleaned reads were aligned to the genome with the TopHat splice junction mapper for RNA‐seq reads v1.4.1 (Trapnell et al, 2009).
ChIPseq: Adapters were trimmed from the 3′ ends of the reads with cutadapt v1.10. The trimmed reads larger than 18 nt were aligned to the genome (NCBI mm9) using bowtie v1.0.0 (Langmead et al, 2009; ‐v 2 –best –strata –tryhard ‐m 1).
GROseq: Adapters were trimmed from the 3′ ends of the reads with cutadapt (v 1.10), and a 5‐nt random linker was removed from the 3′ end using fastx_trimmer. Trimmed reads larger than 10 nt were aligned to the genome (NCBI mm9) using bowtie v1.0.0 (‐v 2 –best –strata –tryhard ‐m 1).
Annotation
All bioinformatics analyses were based on gene annotation from the RefSeq database (downloaded from UCSC on January 10, 2014). Genes with overlapping exons were flagged, and double entries (i.e., exactly the same gene at two different genomic locations) were renamed. Identical genes with more than one assigned gene symbol were flagged. For mRNAseq, genes with several transcripts were merged to consensus genes consisting of a union of all underlying exons using the FuGe software (I. Tamir, unpublished), which resulted in 24,725 gene models.
Differential gene expression analysis
Reads were quantified with featureCounts v1.5.0‐p1 (Liao et al, 2014). Differentially expressed genes were obtained using DESeq2 v1.10.1 (Love et al, 2014) according to its standard comparison between two experimental conditions vignette. Differentially expressed genes were filtered for a P‐adjusted value of < 0.05 and a fold change greater 1.5 in either direction.
Expressed gene list
Genes shorter than 2 kb and overlapping genes on the same strand were removed, which resulted in 18,072 genes. Of these, genes were considered as expressed if their mean RPKM (reads per kilobase per million sequenced reads) from GROseq analysis in WT or Spt5‐depleted cells was greater than 1 (RPKM > 1), which yielded 7,699 expressed genes. For pausing index, 5′ PI calculation and GROseq gene body density grouping, we excluded genes within a reciprocal distance of 1.5 kb, resulting in a set of 4,411 genes.
Composite metagene plots
All read densities and density matrices for composite metagene and ratio plots were calculated using the deepTools package v2.2.3 (Ramirez et al, 2014). Read densities were calculated using deepTools’ bamCoverage normalizing to RPKM (–normalizeUsingRPKM). All composite metagene plots in this study comprise three regions: (i) the region from −1,500 to +500 bp of the annotated transcription start site (TSS) divided into 200 bins, (ii) the gene body region extending from +500 bp of the TSS to −500 bp from the annotated transcription termination site (TTS) divided into 300 scaled bins to account for varying gene lengths, and (iii) the region from −500 bp to +1,500 bp of the TTS divided into 200 bins. Density matrices for those regions were calculated using deepTools’ computeMatrix. TSS‐centered composite plots were calculated for the static region of TSS −0.5 kb to TSS +1.5 kb using 200 bins. TTS‐centered composite plots were calculated for the static region of TTS −10 kb to TTS +40 kb using 500 bins based on a subset of 1,739 genes longer than 50 kb.
Heatmaps
Transcription start site‐centered heatmaps were calculated and plotted using deepTools’ computeMatrix and plotHeatmap for the static region of TSS −0.5 kb to TSS +1.5 kb, sorting for GROseq WT signal. Ratios for ratio heatmaps were calculated using deepTools’ bamCompare. Corresponding heatmaps were calculated on the length ordered list of expressed genes < 100 kb for a static region ranging from TSS −2 kb to TSS +100.5 kb. For GROseq, ratio heatmaps were plotted separately for plus‐ and minus‐strand genes (only minus‐strand genes shown). Ratio profile plots for the same regions were calculated using deepTools’ plotProfile command. The zoomed ratio profile plot at TSS +13 kb to TSS +23 kb was calculated based only on genes > 30 kb (n = 2,094). K‐means clustering of Spt5dep/WT sense ratio signal was calculated using deepTools’ plotHeatmap command using k = 3. Technique‐correlation heatmaps were based on RPKM values for GROseq and Ser2P‐Pol II and total Pol II and collapsed rlogs for mRNAseq replicates.
Computational analysis of intron retention levels
We followed the procedure proposed by Shetty et al (2017) to calculate the intron retention levels for 185,149 splice sites. Combining replicates, we plot the mean‐per‐junction splicing efficiency for all splice sites as scatter boxplots.
Spt5 exon usage
We counted the number of reads for all Spt5 exons for all replicates. Next, we calculated the ratio of exons 14–16 versus the remaining Spt5 exons for each replicate separately, which does not require normalization for creating boxplots. For comparing WT to Spt5dep ratios in exons 14–16 and the remaining Spt5 exons, we library‐normalized read counts to reads per million.
5′ UTR introns
The RefSeq list of annotated 5′ UTRs was obtained from the UCSC table browser (December 1, 2017). Transcripts were separated into 5′ UTR intron‐containing transcripts and ungapped 5′ UTR transcripts. Genes with a least one transcript containing a 5′ UTR intron were considered as 5′ UTR intron‐containing genes, all remaining genes as ungapped 5′ UTR genes.
Correlations
Correlations were calculated using deepTools multiBamSummary plotting coverage for consecutive non‐overlapping bins of 10 kb of size.
Pausing index and 5′ PI
Pausing index was calculated based on a TSS +/−500 bp promoter region and a TSS +500 bp to TTS gene body region. Reads were quantified using featureCounts v1.5.0‐p1 and normalized to RPM for the promoter region and RPKM for the gene body region. 5′ PI was calculated on a TSS −300 bp to TSS +100 bp promoter region and a TSS +500 bp to TSS +2 kb gene body region. Reads were quantified using featureCounts v1.5.0‐p1 and normalized to RPM for both regions.
Box plots
All boxplot representations follow the following parameters: The horizontal line shows the median, the box limits represent the inter‐quartile range (IQR) (distance between the first and third quartiles) and the length of the whiskers is 1.5 times the IQR.
Data accessibility
All raw NGS data (GROseq, ChIPseq and mRNAseq) have been deposited in GEO under accession number GSE106313.
Author contributions
JF designed and performed experiments. TN performed all bioinformatics analysis. RP conceived the project, designed and performed experiments, and wrote the manuscript.
Conflict of interest
The authors declare that they have no conflict of interest.
Supporting information
Expanded View Figures PDF
Table EV1
Table EV2
Table EV3
Source Data for Expanded View
Review Process File
Acknowledgements
We are grateful to the Vienna Biocenter Core Facilities (VBCF) and the IMP/IMBA core facilities especially the animal house, next‐generation sequencing, and molecular biology services. This work was funded by Boehringer Ingelheim and The Austrian Industrial Research Promotion Agency (Headquarter Grant FFG‐834223).
The EMBO Journal (2018) 37: e97965
References
- Adelman K, Lis JT (2012) Promoter‐proximal pausing of RNA polymerase II: emerging roles in metazoans. Nat Rev Genet 13: 720–731 [DOI] [PMC free article] [PubMed] [Google Scholar]
- Aguilar‐Hernandez V, Guzman P (2013) Spliceosomal introns in the 5′ untranslated region of plant BTL RING‐H2 ubiquitin ligases are evolutionary conserved and required for gene expression. BMC Plant Biol 13: 179 [DOI] [PMC free article] [PubMed] [Google Scholar]
- Baejen C, Andreani J, Torkler P, Battaglia S, Schwalb B, Lidschreiber M, Maier KC, Boltendahl A, Rus P, Esslinger S, Soding J, Cramer P (2017) Genome‐wide analysis of RNA polymerase II termination at protein‐coding genes. Mol Cell 66: 38–49.e6 [DOI] [PubMed] [Google Scholar]
- Bartkowiak B, Liu P, Phatnani HP, Fuda NJ, Cooper JJ, Price DH, Adelman K, Lis JT, Greenleaf AL (2010) CDK12 is a transcription elongation‐associated CTD kinase, the metazoan ortholog of yeast Ctk1. Genes Dev 24: 2303–2316 [DOI] [PMC free article] [PubMed] [Google Scholar]
- Belotserkovskaya R, Oh S, Bondarenko VA, Orphanides G, Studitsky VM, Reinberg D (2003) FACT facilitates transcription‐dependent nucleosome alteration. Science 301: 1090–1093 [DOI] [PubMed] [Google Scholar]
- Bicknell AA, Cenik C, Chua HN, Roth FP, Moore MJ (2012) Introns in UTRs: why we should stop ignoring them. BioEssays 34: 1025–1034 [DOI] [PubMed] [Google Scholar]
- Booth GT, Wang IX, Cheung VG, Lis JT (2016) Divergence of a conserved elongation factor and transcription regulation in budding and fission yeast. Genome Res 26: 799–811 [DOI] [PMC free article] [PubMed] [Google Scholar]
- Chao SH, Price DH (2001) Flavopiridol inactivates P‐TEFb and blocks most RNA polymerase II transcription in vivo . J Biol Chem 276: 31793–31799 [DOI] [PubMed] [Google Scholar]
- Chen FX, Woodfin AR, Gardini A, Rickels RA, Marshall SA, Smith ER, Shiekhattar R, Shilatifard A (2015) PAF1, a molecular regulator of promoter‐proximal pausing by RNA polymerase II. Cell 162: 1003–1015 [DOI] [PMC free article] [PubMed] [Google Scholar]
- Core LJ, Lis JT (2008) Transcription regulation through promoter‐proximal pausing of RNA polymerase II. Science 319: 1791–1792 [DOI] [PMC free article] [PubMed] [Google Scholar]
- Core LJ, Waterfall JJ, Gilchrist DA, Fargo DC, Kwak H, Adelman K, Lis JT (2012) Defining the status of RNA polymerase at promoters. Cell Rep 2: 1025–1035 [DOI] [PMC free article] [PubMed] [Google Scholar]
- Danko CG, Hah N, Luo X, Martins AL, Core L, Lis JT, Siepel A, Kraus WL (2013) Signaling pathways differentially affect RNA polymerase II initiation, pausing, and elongation rate in cells. Mol Cell 50: 212–222 [DOI] [PMC free article] [PubMed] [Google Scholar]
- Diamant G, Amir‐Zilberstein L, Yamaguchi Y, Handa H, Dikstein R (2012) DSIF restricts NF‐kappaB signaling by coordinating elongation with mRNA processing of negative feedback genes. Cell Rep 2: 722–731 [DOI] [PubMed] [Google Scholar]
- Diamant G, Bahat A, Dikstein R (2016) The elongation factor Spt5 facilitates transcription initiation for rapid induction of inflammatory‐response genes. Nat Commun 7: 11547 [DOI] [PMC free article] [PubMed] [Google Scholar]
- Dignam JD, Lebovitz RM, Roeder RG (1983) Accurate transcription initiation by RNA polymerase II in a soluble extract from isolated mammalian nuclei. Nucleic Acids Res 11: 1475–1489 [DOI] [PMC free article] [PubMed] [Google Scholar]
- Ehrensberger AH, Kelly GP, Svejstrup JQ (2013) Mechanistic interpretation of promoter‐proximal peaks and RNAPII density maps. Cell 154: 713–715 [DOI] [PubMed] [Google Scholar]
- Endoh M, Zhu W, Hasegawa J, Watanabe H, Kim DK, Aida M, Inukai N, Narita T, Yamada T, Furuya A, Sato H, Yamaguchi Y, Mandal SS, Reinberg D, Wada T, Handa H (2004) Human Spt6 stimulates transcription elongation by RNA polymerase II in vitro . Mol Cell Biol 24: 3324–3336 [DOI] [PMC free article] [PubMed] [Google Scholar]
- Farley FW, Soriano P, Steffen LS, Dymecki SM (2000) Widespread recombinase expression using FLPeR (flipper) mice. Genesis 28: 106–110 [PubMed] [Google Scholar]
- Furger A, O'Sullivan JM, Binnie A, Lee BA, Proudfoot NJ (2002) Promoter proximal splice sites enhance transcription. Genes Dev 16: 2792–2799 [DOI] [PMC free article] [PubMed] [Google Scholar]
- Gilchrist DA, Dos Santos G, Fargo DC, Xie B, Gao Y, Li L, Adelman K (2010) Pausing of RNA polymerase II disrupts DNA‐specified nucleosome organization to enable precise gene regulation. Cell 143: 540–551 [DOI] [PMC free article] [PubMed] [Google Scholar]
- Gressel S, Schwalb B, Decker TM, Qin W, Leonhardt H, Eick D, Cramer P (2017) CDK9‐dependent RNA polymerase II pausing controls transcription initiation. Elife 6: e29736 [DOI] [PMC free article] [PubMed] [Google Scholar]
- Hahn S (2004) Structure and mechanism of the RNA polymerase II transcription machinery. Nat Struct Mol Biol 11: 394–403 [DOI] [PMC free article] [PubMed] [Google Scholar]
- Hartzog GA, Fu J (2013) The Spt4‐Spt5 complex: a multi‐faceted regulator of transcription elongation. Biochim Biophys Acta 1829: 105–115 [DOI] [PMC free article] [PubMed] [Google Scholar]
- Hirtreiter A, Damsma GE, Cheung AC, Klose D, Grohmann D, Vojnic E, Martin AC, Cramer P, Werner F (2010) Spt4/5 stimulates transcription elongation through the RNA polymerase clamp coiled‐coil motif. Nucleic Acids Res 38: 4040–4051 [DOI] [PMC free article] [PubMed] [Google Scholar]
- Ivanov D, Kwak YT, Guo J, Gaynor RB (2000) Domains in the SPT5 protein that modulate its transcriptional regulatory properties. Mol Cell Biol 20: 2970–2983 [DOI] [PMC free article] [PubMed] [Google Scholar]
- Jonkers I, Kwak H, Lis JT (2014) Genome‐wide dynamics of Pol II elongation and its interplay with promoter proximal pausing, chromatin, and exons. Elife 3: e02407 [DOI] [PMC free article] [PubMed] [Google Scholar]
- Jonkers I, Lis JT (2015) Getting up to speed with transcription elongation by RNA polymerase II. Nat Rev Mol Cell Biol 16: 167–177 [DOI] [PMC free article] [PubMed] [Google Scholar]
- Kim J, Guermah M, McGinty RK, Lee JS, Tang Z, Milne TA, Shilatifard A, Muir TW, Roeder RG (2009) RAD6‐Mediated transcription‐coupled H2B ubiquitylation directly stimulates H3K4 methylation in human cells. Cell 137: 459–471 [DOI] [PMC free article] [PubMed] [Google Scholar]
- Kim J, Guermah M, Roeder RG (2010) The human PAF1 complex acts in chromatin transcription elongation both independently and cooperatively with SII/TFIIS. Cell 140: 491–503 [DOI] [PMC free article] [PubMed] [Google Scholar]
- Klein BJ, Bose D, Baker KJ, Yusoff ZM, Zhang X, Murakami KS (2011) RNA polymerase and transcription elongation factor Spt4/5 complex structure. Proc Natl Acad Sci USA 108: 546–550 [DOI] [PMC free article] [PubMed] [Google Scholar]
- Krogan NJ, Kim M, Ahn SH, Zhong G, Kobor MS, Cagney G, Emili A, Shilatifard A, Buratowski S, Greenblatt JF (2002) RNA polymerase II elongation factors of Saccharomyces cerevisiae: a targeted proteomics approach. Mol Cell Biol 22: 6979–6992 [DOI] [PMC free article] [PubMed] [Google Scholar]
- Lakso M, Pichel JG, Gorman JR, Sauer B, Okamoto Y, Lee E, Alt FW, Westphal H (1996) Efficient in vivo manipulation of mouse genomic sequences at the zygote stage. Proc Natl Acad Sci USA 93: 5860–5865 [DOI] [PMC free article] [PubMed] [Google Scholar]
- Langmead B, Trapnell C, Pop M, Salzberg SL (2009) Ultrafast and memory‐efficient alignment of short DNA sequences to the human genome. Genome Biol 10: R25 [DOI] [PMC free article] [PubMed] [Google Scholar]
- Langmead B, Salzberg SL (2012) Fast gapped‐read alignment with Bowtie 2. Nat Methods 9: 357–359 [DOI] [PMC free article] [PubMed] [Google Scholar]
- Larochelle S, Batliner J, Gamble MJ, Barboza NM, Kraybill BC, Blethrow JD, Shokat KM, Fisher RP (2006) Dichotomous but stringent substrate selection by the dual‐function Cdk7 complex revealed by chemical genetics. Nat Struct Mol Biol 13: 55–62 [DOI] [PubMed] [Google Scholar]
- Liang K, Gao X, Gilmore JM, Florens L, Washburn MP, Smith E, Shilatifard A (2015) Characterization of human cyclin‐dependent kinase 12 (CDK12) and CDK13 complexes in C‐terminal domain phosphorylation, gene transcription, and RNA processing. Mol Cell Biol 35: 928–938 [DOI] [PMC free article] [PubMed] [Google Scholar]
- Liao Y, Smyth GK, Shi W (2014) featureCounts: an efficient general purpose program for assigning sequence reads to genomic features. Bioinformatics 30: 923–930 [DOI] [PubMed] [Google Scholar]
- Lindstrom DL, Squazzo SL, Muster N, Burckin TA, Wachter KC, Emigh CA, McCleery JA, Yates JR III, Hartzog GA (2003) Dual roles for Spt5 in pre‐mRNA processing and transcription elongation revealed by identification of Spt5‐associated proteins. Mol Cell Biol 23: 1368–1378 [DOI] [PMC free article] [PubMed] [Google Scholar]
- Liu Y, Warfield L, Zhang C, Luo J, Allen J, Lang WH, Ranish J, Shokat KM, Hahn S (2009) Phosphorylation of the transcription elongation factor Spt5 by yeast Bur1 kinase stimulates recruitment of the PAF complex. Mol Cell Biol 29: 4852–4863 [DOI] [PMC free article] [PubMed] [Google Scholar]
- Love MI, Huber W, Anders S (2014) Moderated estimation of fold change and dispersion for RNA‐seq data with DESeq2. Genome Biol 15: 550 [DOI] [PMC free article] [PubMed] [Google Scholar]
- Luo Z, Lin C, Shilatifard A (2012) The super elongation complex (SEC) family in transcriptional control. Nat Rev Mol Cell Biol 13: 543–547 [DOI] [PubMed] [Google Scholar]
- Luse DS (2014) The RNA polymerase II preinitiation complex. Through what pathway is the complex assembled?. Transcription 5: e27050 [DOI] [PMC free article] [PubMed] [Google Scholar]
- Marshall NF, Price DH (1995) Purification of P‐TEFb, a transcription factor required for the transition into productive elongation. J Biol Chem 270: 12335–12338 [DOI] [PubMed] [Google Scholar]
- Marshall NF, Peng J, Xie Z, Price DH (1996) Control of RNA polymerase II elongation potential by a novel carboxyl‐terminal domain kinase. J Biol Chem 271: 27176–27183 [DOI] [PubMed] [Google Scholar]
- Martin M (2011) Cutadapt removes adapter sequences from high‐throughput sequencing reads. EMBnet.journal http://doi.org/10.14806/ej.17.1.200 [Google Scholar]
- Martinez‐Rucobo FW, Sainsbury S, Cheung AC, Cramer P (2011) Architecture of the RNA polymerase‐Spt4/5 complex and basis of universal transcription processivity. EMBO J 30: 1302–1310 [DOI] [PMC free article] [PubMed] [Google Scholar]
- Mayer A, Schreieck A, Lidschreiber M, Leike K, Martin DE, Cramer P (2012) The spt5 C‐terminal region recruits yeast 3′ RNA cleavage factor I. Mol Cell Biol 32: 1321–1331 [DOI] [PMC free article] [PubMed] [Google Scholar]
- Min IM, Waterfall JJ, Core LJ, Munroe RJ, Schimenti J, Lis JT (2011) Regulating RNA polymerase pausing and transcription elongation in embryonic stem cells. Genes Dev 25: 742–754 [DOI] [PMC free article] [PubMed] [Google Scholar]
- Mueller CL, Jaehning JA (2002) Ctr9, Rtf1, and Leo1 are components of the Paf1/RNA polymerase II complex. Mol Cell Biol 22: 1971–1980 [DOI] [PMC free article] [PubMed] [Google Scholar]
- Orphanides G, Lagrange T, Reinberg D (1996) The general transcription factors of RNA polymerase II. Genes Dev 10: 2657–2683 [DOI] [PubMed] [Google Scholar]
- Orphanides G, LeRoy G, Chang CH, Luse DS, Reinberg D (1998) FACT, a factor that facilitates transcript elongation through nucleosomes. Cell 92: 105–116 [DOI] [PubMed] [Google Scholar]
- Pavri R, Zhu B, Li G, Trojer P, Mandal S, Shilatifard A, Reinberg D (2006) Histone H2B monoubiquitination functions cooperatively with FACT to regulate elongation by RNA polymerase II. Cell 125: 703–717 [DOI] [PubMed] [Google Scholar]
- Pavri R, Gazumyan A, Jankovic M, Di Virgilio M, Klein I, Ansarah‐Sobrinho C, Resch W, Yamane A, San‐Martin BR, Barreto V, Nieland TJ, Root DE, Casellas R, Nussenzweig MC (2010) Activation‐induced cytidine deaminase targets DNA at sites of RNA polymerase II stalling by interaction with Spt5. Cell 143: 122–133 [DOI] [PMC free article] [PubMed] [Google Scholar]
- Pei Y, Shuman S (2002) Interactions between fission yeast mRNA capping enzymes and elongation factor Spt5. J Biol Chem 277: 19639–19648 [DOI] [PubMed] [Google Scholar]
- Peterlin BM, Price DH (2006) Controlling the elongation phase of transcription with P‐TEFb. Mol Cell 23: 297–305 [DOI] [PubMed] [Google Scholar]
- Rahl PB, Lin CY, Seila AC, Flynn RA, McCuine S, Burge CB, Sharp PA, Young RA (2010) c‐Myc regulates transcriptional pause release. Cell 141: 432–445 [DOI] [PMC free article] [PubMed] [Google Scholar]
- Ramirez F, Dundar F, Diehl S, Gruning BA, Manke T (2014) deepTools: a flexible platform for exploring deep‐sequencing data. Nucleic Acids Res 42: W187–W191 [DOI] [PMC free article] [PubMed] [Google Scholar]
- Rodriguez‐Molina JB, Tseng SC, Simonett SP, Taunton J, Ansari AZ (2016) Engineered covalent inactivation of TFIIH‐kinase reveals an elongation checkpoint and results in widespread mRNA stabilization. Mol Cell 63: 433–444 [DOI] [PMC free article] [PubMed] [Google Scholar]
- Roeder RG (1996) The role of general initiation factors in transcription by RNA polymerase II. Trends Biochem Sci 21: 327–335 [PubMed] [Google Scholar]
- Saponaro M, Kantidakis T, Mitter R, Kelly GP, Heron M, Williams H, Soding J, Stewart A, Svejstrup JQ (2014) RECQL5 controls transcript elongation and suppresses genome instability associated with transcription stress. Cell 157: 1037–1049 [DOI] [PMC free article] [PubMed] [Google Scholar]
- Shao W, Zeitlinger J (2017) Paused RNA polymerase II inhibits new transcriptional initiation. Nat Genet 49: 1045–1051 [DOI] [PubMed] [Google Scholar]
- Shetty A, Kallgren SP, Demel C, Maier KC, Spatt D, Alver BH, Cramer P, Park PJ, Winston F (2017) Spt5 plays vital roles in the control of sense and antisense transcription elongation. Mol Cell 66: 77–88 e5 [DOI] [PMC free article] [PubMed] [Google Scholar]
- Shi X, Finkelstein A, Wolf AJ, Wade PA, Burton ZF, Jaehning JA (1996) Paf1p, an RNA polymerase II‐associated factor in Saccharomyces cerevisiae, may have both positive and negative roles in transcription. Mol Cell Biol 16: 669–676 [DOI] [PMC free article] [PubMed] [Google Scholar]
- Singh J, Padgett RA (2009) Rates of in situ transcription and splicing in large human genes. Nat Struct Mol Biol 16: 1128–1133 [DOI] [PMC free article] [PubMed] [Google Scholar]
- Squazzo SL, Costa PJ, Lindstrom DL, Kumer KE, Simic R, Jennings JL, Link AJ, Arndt KM, Hartzog GA (2002) The Paf1 complex physically and functionally associates with transcription elongation factors in vivo . EMBO J 21: 1764–1774 [DOI] [PMC free article] [PubMed] [Google Scholar]
- Stanlie A, Begum NA, Akiyama H, Honjo T (2012) The DSIF subunits Spt4 and Spt5 have distinct roles at various phases of immunoglobulin class switch recombination. PLoS Genet 8: e1002675 [DOI] [PMC free article] [PubMed] [Google Scholar]
- Trapnell C, Pachter L, Salzberg SL (2009) TopHat: discovering splice junctions with RNA‐Seq. Bioinformatics 25: 1105–1111 [DOI] [PMC free article] [PubMed] [Google Scholar]
- Ventura A, Kirsch DG, McLaughlin ME, Tuveson DA, Grimm J, Lintault L, Newman J, Reczek EE, Weissleder R, Jacks T (2007) Restoration of p53 function leads to tumour regression in vivo . Nature 445: 661–665 [DOI] [PubMed] [Google Scholar]
- Wada T, Takagi T, Yamaguchi Y, Ferdous A, Imai T, Hirose S, Sugimoto S, Yano K, Hartzog GA, Winston F, Buratowski S, Handa H (1998) DSIF, a novel transcription elongation factor that regulates RNA polymerase II processivity, is composed of human Spt4 and Spt5 homologs. Genes Dev 12: 343–356 [DOI] [PMC free article] [PubMed] [Google Scholar]
- Wen Y, Shatkin AJ (1999) Transcription elongation factor hSPT5 stimulates mRNA capping. Genes Dev 13: 1774–1779 [DOI] [PMC free article] [PubMed] [Google Scholar]
- Werner F (2012) A nexus for gene expression‐molecular mechanisms of Spt5 and NusG in the three domains of life. J Mol Biol 417: 13–27 [DOI] [PMC free article] [PubMed] [Google Scholar]
- Williams LH, Fromm G, Gokey NG, Henriques T, Muse GW, Burkholder A, Fargo DC, Hu G, Adelman K (2015) Pausing of RNA polymerase II regulates mammalian developmental potential through control of signaling networks. Mol Cell 58: 311–322 [DOI] [PMC free article] [PubMed] [Google Scholar]
- Yamaguchi Y, Wada T, Watanabe D, Takagi T, Hasegawa J, Handa H (1999a) Structure and function of the human transcription elongation factor DSIF. J Biol Chem 274: 8085–8092 [DOI] [PubMed] [Google Scholar]
- Yamaguchi Y, Takagi T, Wada T, Yano K, Furuya A, Sugimoto S, Hasegawa J, Handa H (1999b) NELF, a multisubunit complex containing RD, cooperates with DSIF to repress RNA polymerase II elongation. Cell 97: 41–51 [DOI] [PubMed] [Google Scholar]
Associated Data
This section collects any data citations, data availability statements, or supplementary materials included in this article.
Supplementary Materials
Expanded View Figures PDF
Table EV1
Table EV2
Table EV3
Source Data for Expanded View
Review Process File
Data Availability Statement
All raw NGS data (GROseq, ChIPseq and mRNAseq) have been deposited in GEO under accession number GSE106313.