

Abstract
Negative regulation of immune pathways is essential to achieve resolution of immune responses and to avoid excess inflammation. DNA stimulates type I IFN expression through the DNA sensor cGAS, the second messenger cGAMP, and the adaptor molecule STING. Here, we report that STING degradation following activation of the pathway occurs through autophagy and is mediated by p62/SQSTM1, which is phosphorylated by TBK1 to direct ubiquitinated STING to autophagosomes. Degradation of STING was impaired in p62‐deficient cells, which responded with elevated IFN production to foreign DNA and DNA pathogens. In the absence of p62, STING failed to traffic to autophagy‐associated vesicles. Thus, DNA sensing induces the cGAS‐STING pathway to activate TBK1, which phosphorylates IRF3 to induce IFN expression, but also phosphorylates p62 to stimulate STING degradation and attenuation of the response.
Keywords: autophagy, DNA sensing, innate immunity, p62/SQSTM1, STING
Subject Categories: Immunology, Signal Transduction
Introduction
Stimulus‐dependent activation of immune responses is essential to achieve optimal tempo‐spatial immune activities at sites of infection and to avoid tissue damage. To control immune reactions, cells harbor regulatory mechanisms that down‐modulate immune‐stimulatory signals (Chiao et al, 1994; Starr et al, 1997; Liew et al, 2005; Patel & Garcia‐Sastre, 2014; Paludan, 2015). These mechanisms are important to avoid excess inflammation as evidenced by auto‐inflammatory diseases in patient with loss‐of‐function mutations in genes encoding immune‐regulatory proteins (Crow & Manel, 2015).
Cytosolic DNA is highly immune‐stimulatory and is detected by a panel of sensors to stimulate production of type I interferon (IFN)s, interleukin 1β, and activation of death pathways (Hornung et al, 2009; Unterholzner et al, 2010; Sun et al, 2013; Monroe et al, 2014). Cyclic GMP‐AMP (cGAMP) synthase (cGAS) is the key cytosolic DNA sensor that stimulates the IFN induction pathway (Li et al, 2013; Sun et al, 2013). Upon DNA binding, cGAS synthesizes 2′3′ cGAMP, which binds the adaptor protein stimulator of IFN genes (STING) and induces a conformational change in the STING dimer, thus enabling recruitment and activation of the tank‐binding kinase (TBK)1 and the transcription factor IFN regulatory factor (IRF)3 (Paludan & Bowie, 2013). The induction of type I IFNs by DNA is essential for defense against virus infections and for anti‐cancer immunity (Ishikawa et al, 2009; Li et al, 2013; Schoggins et al, 2013; Deng et al, 2014; Woo et al, 2014; Reinert et al, 2016). However, pathological roles have also been ascribed to type I IFNs in bacterial infections and in chronic viral infections (Auerbuch et al, 2004; Teijaro et al, 2013). Most notably, excess activation of the cGAS‐STING pathway is associated with auto‐inflammatory diseases, including Aicardi–Goutiéres Syndrome and systemic lupus erythematosus (Crow & Manel, 2015; Gall et al, 2012; Gao et al, 2015). To keep the cytoplasm clear of DNA, cells use the DNase Trex1 and the autophagy machinery (Stetson et al, 2008; Liang et al, 2014). There are also reports demonstrating a role for components of the autophagy pathway in negative regulation of STING‐dependent signaling (Saitoh et al, 2009; Konno et al, 2013). It is known that STING is turned over following stimulation of signaling (Konno et al, 2013), and although this is believed to be central for negative control of the pathway, there is limited knowledge on the events that govern STING turnover.
Activation of the cGAS‐STING pathway occurs on membranous surfaces. STING is an endoplasmic reticulum (ER)‐resident protein in the resting state (Paludan & Bowie, 2013). Following stimulation, STING traffics to the Golgi and ER‐Golgi intermediate compartments (ERGIC) where TBK1 is recruited and the STING signalsome is activated including phosphorylation of STING and IRF3 (Saitoh et al, 2009; Dobbs et al, 2015; Liu et al, 2015). Eventually, STING can be found in speck‐like structures (Ishikawa et al, 2009), which remain uncharacterized with respect to their nature and also potential roles in termination of STING signaling activity. It has been reported that these structures co‐localize with autophagosome components, but previous studies found the formed membranes to be single bilayer vesicles, and not double bilayer membranes, as in autophagosomes (Saitoh et al, 2009). Recently, it was reported that STING mediates autophagy of the ER to release organelle stress, thus promoting antibacterial immunity and survival after infection (Moretti et al, 2017). While autophagy can be non‐selective, there are receptors that can bind specific molecules and target them for autophagosomes (Levine et al, 2011). One important class of selective autophagy receptors bind and target ubiquitinated proteins to autophagosomes by interaction with LC3 through their LC3‐binding region. Since ubiquitin is used extensively in activation of signals by pattern recognition receptors there is potential for crosstalk between the signals that stimulate immune signaling and the autophagy machinery (Gack et al, 2007; Damgaard et al, 2012; Wang et al, 2014).
Here, we report that the ubiquitin‐binding selective autophagy receptor p62/SQSTM1 is essential for DNA‐ and cGAMP‐stimulated degradation of STING. STING in turn is ubiquitinated through K63 linkage and recruited to p62‐positive compartments. This proceeds through a pathway where TBK1 phosphorylates p62 in an IRF3‐dependent but transcription independent manner, which increases ubiquitin‐binding affinity of p62. Consequently, STING is not degraded in p62‐deficient cells, which produce elevated levels of type I IFN and IFN‐stimulated genes (ISG)s. Thus, p62 is essential for targeting of STING for autophagosomal degradation following stimulation of the cGAS‐STING pathway.
Results
DNA‐stimulated turnover of STING occurs through autophagy
Cytosolic DNA leads to degradation of STING (Konno et al, 2013). This was observed in both murine and human cells following stimulation with dsDNA or cGAMP (Figs 1A and EV1A–C) and was also observed in mice stimulated with the STING agonist DMXAA (Fig 1B). Defects in proteins of different branches of the autophagy machinery have been reported to lead to elevated innate response to DNA (Fig EV1D), but this has been suggested to occur independently of autophagy (Saitoh et al, 2009; Konno et al, 2013). When we tested the impact of another autophagy‐related protein, ATG3, we found that Atg3 −/− cells produced significantly elevated levels of the ISG CXCL10 after stimulation through the STING pathway as compared to wild‐type (WT) cells (Fig 1C). Previous studies had failed to find DNA‐stimulated formation of double‐membrane autophagosomes (Saitoh et al, 2009). However, under our experimental conditions, we found that DNA stimulation led to increased cytoplasmic levels of (i) electron‐dense vesicles resembling endosomes or lysosomes with single outer membrane (Figs 1D–F and EV1E), and (ii) double‐membrane vesicles containing membranous structures (Figs 1G and H, and EV1F). Consistent with previous reports (Saitoh et al, 2009; Konno et al, 2013), treatment with DNA‐ or cGAMP‐stimulated dephosphorylation at serine 555 of ULK1, which is an important component of the autophagy initiation complex (Figs 1I–K, and EV1G and H), as well as LC3‐I to LC3‐II conversion, and recruitment of LC3 to STING foci (Figs 1A and EV1I). Moreover, time‐lapse fluorescence microscopy revealed that LC3 was recruited to the STING‐positive vesicles that accumulated after stimulation with DMXAA (Figs 1L and EV1J; Movie EV1). Finally, we examined the effect of inhibition of autophagy on DNA‐stimulated STING degradation. Importantly, STING was not degraded after DNA stimulation in Atg3 −/− cells (Fig 1M), and this process was significantly delayed in Ulk1/2 −/− cells in agreement with previous reports (Fig 1J; Hu et al, 2016; Konno et al, 2013). Moreover, inhibition of autophagy at different steps by 3‐methyladenine and Bafilomycin A1, but not inhibition of the proteasome, impaired stimulation‐induced degradation of STING (Fig EV1K–M). Bafilomycin A1 treatment furthermore augmented DNA‐induced CXCL10 production (Fig EV1N). Collectively, stimulation of the cGAS‐STING pathway leads to activation of several markers of autophagy and inhibition of autophagy impairs DNA‐stimulated degradation of STING.
Figure 1. DNA‐stimulated turnover of STING occurs through autophagy.

-
AWT and Sting gt/gt MEFs were treated with dsDNA (4 μg/ml) for the indicated time interval, and lysates were immunoblotted for STING, LC3, and β‐actin.
-
BcGas −/− mice were treated with DMXAA (500 mg/mouse) for the indicated time interval, and spleen lysates were immunoblotted for STING and β‐actin.
-
CWT and Atg3 −/− MEFs were treated with dsDNA (4 μg/ml) or 2′3′ cGAMP (4 μg/ml) for 18 h, and supernatants were harvested and analyzed for levels of CXCL10.
-
D, EElectron microscopy of glutaraldehyde‐fixed cells treated with Lipofectamine (mock) or transfected with dsDNA (4 μg/ml) for 8 h. Panel (E) represents 10× magnifications of selected areas of the DNA‐stimulated cells. Red arrowheads highlight electron‐dense vesicles in DNA‐stimulated cells. Scale bars: 2 μm (D); 250 nm (E).
-
FStereological analysis of data shown in panels (D, E). The graph is based on quantification of at least 35 cell profiles per group.
-
GElectron microscopy of glutaraldehyde‐fixed cells transfected with dsDNA (4 μg/ml) for 8 h. Red arrowheads highlight double‐membrane characteristic for autophagosomes. Scale bar: 250 nm.
-
HStereological analysis of data shown in panel (G). The graph is based on quantification of at least 35 cell profiles per group.
-
IWT and Ulk1/2 −/− MEFs were treated with dsDNA (4 μg/ml) for the indicated time interval, and lysates were immunoblotted for pULK1 S555, ULK, STING, and β‐actin.
-
JControl, cGAS KO, and STING KO THP1 cells were treated with dsDNA (4 μg/ml) for the indicated time interval, and lysates were immunoblotted for cGAS, STING, pTBK1, pULK1, and β‐actin.
-
KWT and Ulk1/2 −/− MEFs were treated with dsDNA (4 μg/ml) or 2′3′ cGAMP (4 μg/ml) 18 h, and supernatants were harvested and analyzed for levels of CXCL10.
-
LMEFs were transiently transfected with STING‐mCherry and LC3‐EGFP, treated with DMXAA (100 μg/ml), and imaged live with wide‐field microscopy. Representative image sequence of STING‐mCherry and LC3‐EGFP is shown as inverted contrast. Arrowheads point to LC3‐EGFP recruitment to STING‐mCherry compartments. Scale bar: 5 μm.
-
MWT and Atg3 −/− MEFs were treated with dsDNA (4 μg/ml) for the indicated time interval, and lysates were immunoblotted for STING, pTBK1, LC3, and β‐actin.
Figure EV1. DNA and cGAMP stimulate STING degradation in a range of cell types by autophagy.

-
A, BWT MEFs were treated with 2′3′ cGAMP (4 μg/ml) or DMXAA (100 μg/ml) for the indicated time interval, and lysates were immunoblotted for STING and β‐actin.
-
CTHP1 cells were treated with dsDNA (4 μg/ml) for the indicated time interval, and lysates were immunoblotted for STING, LC3, and β‐actin.
-
DIllustration of the canonical autophagy pathway. 3MA, 3‐methyladenine. BafA1, Bafilomycin A1.
-
E, FElectron microscopy of sections from glutaraldehyde‐fixed cells transfected with dsDNA (4 μg/ml) for 8 h. Panel (E) shows DNA‐stimulated lysosome‐like vesicle, and panel (F) shows two images of vesicular structures enclosed by double membrane (autophagosome) or single membrane (autophagolysosome). Scale bar: 250 nm. Arrowheads: Vesicle outer membranes.
-
GControl, cGAS KO, and STING KO THP1 cells were treated with 2′3′ cGAMP (4 μg/ml) for the indicated time interval, and lysates were immunoblotted for cGAS, STING, pULK1 and β‐actin.
-
HWT and Ulk1/2 −/− MEFs were treated with dsDNA (4 μg/ml) for the indicated time interval, and lysates were immunoblotted for pTBK1 and β‐actin.
-
IWT MEFs were treated with dsDNA (4 μg/ml) for 8 h, and stained with DAPI, anti‐STING, and anti‐LC3. Scale bar, 5 μm.
-
JMEFs were transiently transfected with STING‐mCherry and LC3‐EGFP, treated with DMXAA (100 μg/ml) and imaged live with wide‐field microscopy. Upper panel, representative image sequence of a cell at different time points after stimulation. Lower panel, representative image sequence of the boxed regions. STING‐mCherry and LC3‐EGFP are shown as inverted contrast. Time is indicated as the time in minutes after the start of image acquisition. Arrowheads point to LC3‐EGFP recruitment to STING‐mCherry compartments. Scale bars, 5 μm.
-
K–MTHP1 cells were treated with MG132 (20 mM), 3MA (5 mM) or Baf1A (10 μM) 1 h prior to stimulation with dsDNA (4 μg/ml). Lysates were isolated 9 h post‐stimulation and immunoblotted for STING and β‐actin.
-
NSupernatants from the cells treated as in panel (M) were isolated and levels of CXCL10 were determined by ELISA. Data are shown in means of triplicates ± s.d.
The selective autophagy receptor p62/SQSTM1 exerts negative control of the cGAS‐STING pathway
Ubiquitination is involved in both proteasomal and autophagosomal degradation of proteins, and STING is ubiquitinated at specific residues to promote both activation and negative regulation (Zhong et al, 2009; Tsuchida et al, 2010; Zhang et al, 2012; Wang et al, 2014; Ni et al, 2017). To examine whether specific types of ubiquitin‐linkage accumulated around STING after DNA treatment, stimulated cells were stained with antibodies specific for K63‐ and K48‐linked ubiquitin chains. The well‐described trafficking of STING to specific specks was clearly observed, and there was a strong co‐localization with total ubiquitin, K63‐linked ubiquitin, and to a modest extent with K48‐linked ubiquitin (Figs 2A and B, and EV2A, Appendix Table S1). The observed positive STING signal by microscopy 8 h after stimulation is in contract to the very low STING levels observed at the same time points by Western blotting. This discrepancy is currently not explained. One contributing factor could be that STING degradation products in autophagosomes may be detected by microcopy but not Western blotting.
Figure 2. The selective autophagy receptor p62/SQSTM1 exerts negative control of the cGAS‐STING pathway.

-
A, BWT MEFs were stimulated with dsDNA (4 μg/ml). The cells were fixed 8 h later and stained with antibodies against total ubiquitin or K63‐linked ubiquitin. Scale bars: 5 μm.
-
CTHP1 cells were stimulated with dsDNA (4 μg/ml) for 8 h, and lysates were immunoblotted for p62, NBR1, OPTN, and NDP52.
-
D–GWT MEFs were stimulated with dsDNA (4 μg/ml). The cells were fixed 8 h later and stained with antibodies against total p62, OPTN, NDP52, or NBR1. Scale bars: 5 μm.
-
H, IWT and p62 −/− MEFs were stimulated with dsDNA (4 μg/ml) or 2′3′ cGAMP (4 μg/ml). Total RNA and supernatants were harvested 6 and 18 h later, respectively, and levels of Ifnb and CXCL10 were measured.
-
JThe RNA analyzed in panel (H) was also subjected to a wider examination of ISGs by Fluidigm. The data are presented as a heatmap with each color representing the mean of triplicate measurements.
-
KControl and p62 KO THP1 cells were stimulated with dsDNA (4 μg/ml) or 2′3′ cGAMP (4 μg/ml). Supernatants were harvested 18 h later, and levels of CXCL10 were measured.
-
L, MTHP1 cells were left untreated or stimulated with dsDNA (4 μg/ml) for 4 h in the presence or absence of 3MA (5 mM). p62 was immunoprecipitated from whole‐cell lysates, and levels of STING, TBK1, and p62 in the precipitates were evaluated by immunoblotting.
-
NTHP1 cells were stimulated with dsDNA (4 μg/ml) or 2′3′ cGAMP (4 μg/ml). The cells were fixed 8 h later and stained with antibodies against p62, K63‐linked ubiquitin, and STING. Scale bar: 5 μm.
-
OTHP1 cells were stimulated with dsDNA (4 μg/ml) for 8 h and stained with antibodies against STING, p62, and beclin‐1. Scale bar: 5 μm.
Figure EV2. p62/SQSTM1 is turned over after DNA stimulation and regulates the cGAS‐STING pathway.

-
AWT MEFs were stimulated with dsDNA (4 μg/ml). The cells were fixed 8 h later and stained with antibodies against K48‐linked ubiquitin. Scale bar: 5 μm. Arrow: area of clear colocalization in the stainings.
-
BIllustration of the ubiquitin‐binding selective autophagy receptors.
-
C, DWT, Nbr1 −/− , and Optn −/− MEFs were stimulated with dsDNA (4 μg/ml) or 2′3′ cGAMP (4 μg/ml). Supernatants were harvested 18 h later, and levels of CXCL10 were measured by ELISA.
-
ELysates from DNA‐stimulated WT and Optn −/− MEFs were immunoblotted for the indicated proteins.
-
FWT and Hdac6 −/− MEFs were stimulated with dsDNA (4 μg/ml). Total RNA was harvested 6 h later, and levels of Ifnb mRNA were measured by RT–qPCR.
-
GIllustration of the localization of the target regions in the p62 gene of the two gRNAs used to generate p62 KO THP1 cells.
-
HLysates from control THP1 and two THP1‐derived p62‐deficient cell lines generate with two different gRNAs were immunoblotted for p62, STING, TBK1, IRF3, and β‐actin.
-
IControl and p62 KO THP1 cells (gRNA#2) were stimulated with dsDNA (4 μg/ml). Supernatants were harvested 18 h later, and levels of CXCL10 were measured.
-
J, KHuman foreskin fibroblasts treated with control and p62‐specific gRNA were stimulated with dsDNA (4 μg/ml) or 2′3′ cGAMP (4 μg/ml). Total RNA and supernatants were harvested 6 and 18 h later, respectively, and levels of IFNB and CXCL10 were measured. Western blots for p62 are shown to the right.
-
L, MWT and p62‐deficient MEFs and THP1 cells were stimulated with dsDNA (4 μg/ml). Supernatants were harvested at the indicated time points, and levels of CXCL10 were determined by ELISA.
-
NTHP1 cells were stimulated with dsDNA (4 μg/ml) for 8 h and stained with antibodies against STING, p62, and cGAS. Scale bar: 5 μm. Arrow: area of clear colocalization in the stainings.
A family of receptors is known to selectively target ubiquitinated proteins for autophagy, through their molecular architecture with both an LC3‐interacting region and a ubiquitin‐binding domain (Fig EV2B). Four of these selective autophagy receptors are p62/SQSTM1, NBR1, NDP52, and optineurin (OPTN). All four receptors were expressed in THP1 cells, and p62 and OPTN were also degraded in response to DNA (Fig 2C). In addition, we observed a pronounced relocalization of p62, and to a lesser extent also OPTN, NBR1 and NDP52, to the same areas as STING upon stimulation (Fig 2D–G, Appendix Table S1). Thus, p62 was strongly localized to the same areas as STING after DNA stimulation, and p62 and OPTN were degraded following DNA stimulation.
In order to examine the role of p62 in regulation of DNA‐stimulated IFN responses, we compared expression of IFNβ and CXCL10 in WT versus p62−/− cells. Interestingly, MEFs lacking p62 induced significantly elevated levels of IFNβ and ISGs after stimulation with DNA or cGAMP (Fig 2H–J). Although NBR1 and OPTN also co‐localized with STING, cells deficient in either autophagy receptor did not exhibit elevated expression of CXCL10 after stimulation with DNA or cGAMP (Fig EV2C and D). Optn −/− MEFs even exhibited reduced signaling and CXCL10 expression after stimulation of STING (Fig EV2D and E), consistent with a previous report on OPTN being required for optimal activation of TBK1 (Gleason et al, 2011). The p62‐mediated negative regulation of DNA‐stimulated IFN responses was independent of HDAC6 (Fig EV2F), which is involved in p62‐dependent degradation of aggresomes (Kirkin et al, 2009). To examine the role of p62 in regulation of the cGAS‐STING pathway in human cells, we generated p62 KO THP1 cells (Fig EV2G and H). As in MEFs, THP1 cells lacking p62 induced expression of the ISG CXCL10 to a much higher extent than control cells after stimulation with DNA or cGAMP (Figs 2K and EV2I). Human foreskin fibroblasts also responded with higher DNA‐driven IFN/ISG expression after depletion of p62 expression (Fig EV2J and K). A detailed analysis of the kinetics of CXCL10 induction in MEFs and THP1 cells revealed that the elevated response in p62‐deficient cells was more pronounced at later time points after stimulation (Fig EV2L and M), thus suggesting a role for p62 in negative feedback rather than constitutive control.
Finally, p62 was found to interact constitutively with STING and also with the activation‐induced phosphorylated form of STING (Fig 2L). Although this interaction appeared not to be augmented after DNA stimulation, inhibition of autophagy revealed more STING‐p62 co‐immunoprecipitation in stimulated cells (Fig 2M). Moreover, blotting with anti‐TBK1 demonstrated that TBK1 was recruited to p62 following DNA stimulation. Confocal microscopy revealed that the p62‐STING co‐localizing regions, induced by either DNA or cGAMP, also abundantly contained K63‐linked ubiquitin (Fig 2N).
Since DNA also stimulates an autophagy pathway dependent on cGAS and beclin‐1, but independent of STING (Liang et al, 2014), we wanted to explore whether p62 is recruited to proteins of both DNA‐stimulated autophagy pathways. We observed that p62 co‐localizes with both STING and beclin‐1, which generally showed only limited overlapping staining (Fig 2O). Consistent with this, we observed STING‐p62 foci negative for beclin‐1. p62 was recently reported to be involved in the regulation of cGAS (Chen et al, 2016). Following DNA stimulation, cGAS strongly co‐localized with DNA, and we observed p62 to exhibit some degree of co‐localization with these areas, although p62 was mainly associated with areas positive for STING and negative for cGAS (Fig EV2N). Thus, p62 interacts with STING and exerts negative control of the cGAS‐STING pathway.
STING is degraded in a p62‐dependent manner correlating with its ubiquitination
Given the elevated induction of IFN and ISGs by DNA and cGAMP in p62‐deficient cells, we were interested in examining the activation of the STING pathway. As expected, DNA stimulation led to phosphorylation of TBK1 and IRF3 in WT human and murine cells. Importantly, the phosphorylation of TBK1, STING, and IRF3 was stronger in p62‐deficient cells (Figs 3A and EV3A). When probing for STING, we observed that turnover of STING was abolished after DNA stimulation in p62‐deficient THP1 cells (Fig 3A), and delayed in p62 −/− MEFs, where we also observed higher basal levels of STING (Fig EV3A). Reconstitution of WT p62 expression in p62‐deficient MEFs and THP1 cells enabled these cells to degrade STING after DNA stimulation and reduced DNA‐induced CXCL10 expression (Fig 3B–E, and EV3B and C). Moreover, expression of p62 in STING‐transfected HEK293 cells reduced the levels of STING (Fig EV3D). Since p62 binds ubiquitinated proteins, we next evaluated whether STING was ubiquitinated after DNA stimulation as reported (Zhong et al, 2009; Tsuchida et al, 2010; Zhang et al, 2012; Wang et al, 2014; Ni et al, 2017). Treatment with DNA induced clear K63‐linked, but not K48‐linked, ubiquitination of STING (Fig 3F–H). To examine whether STING ubiquitination was important for STING‐p62 interaction, we expressed TRIM56 in HEK293T cells, and observed elevated ubiquitination of STING as reported previously (Tsuchida et al, 2010; Fig 3I). Importantly, the STING ubiquitination was accompanied by elevated p62‐STING co‐immunoprecipitation (Fig 3I), thus suggesting that ubiquitination of STING augments the association between STING and p62. Collectively, these data show that p62 is essential for stimulation‐induced degradation of STING, which correlates with STING K63 ubiquitination.
Figure 3. STING is degraded in a p62‐dependent manner correlating with its ubiquitination.

-
AWT and p62 KO THP1 cells were stimulated with dsDNA (4 μg/ml) for the indicated time intervals, and lysates were immunoblotted with antibodies specific for the proteins shown.
-
B–EExpression of WT p62 in p62 KO THP1 cells and p62 −/− MEFs was reconstituted using lentiviral transduction. The cells were stimulated with dsDNA (4 μg/ml) and evaluated for levels of STING in lysates and CXCL10 in the supernatants 8 and 16 h post‐treatment, respectively.
-
F–HTHP1 cells were stimulated with dsDNA (4 μg/ml) for the indicated time intervals. Total, K63‐linked and K48‐linked ubiquitin was precipitated, and precipitates were immunoblotted with anti‐STING and anti‐TBK1.
-
IHEK293T cells were transduced with TRIM56, STING‐HA, and p62‐FLAG. Lysates were generated 16 h later and subjected to anti‐HA immunoprecipitation. The precipitate was immunoblotted with anti‐HA, anti‐FLAG, and anti‐ubiquitin.
Figure EV3. STING is degraded in a p62‐dependent manner.

-
AWT and p62 −/− MEFs cells were stimulated with dsDNA (4 μg/ml) for the indicated time intervals and lysates were immunoblotted with antibodies specific for the proteins shown.
-
B, CControl and p62‐deficient THP1 cells and MEFs were transduced with lentivirus encoding p62, and expression of p62, STING, and β‐actin was measured in lysates from the cells by immunoblotting. The p62‐deficient and p62‐rescued cells were treated with dsDNA for 9 h in panel (B) and as indicated in panel (C). Levels of STING and β‐actin in lysates from the cells were evaluated by immunoblotting.
-
DLysates from HEK293 cells transfected for 24 h with STING and p62‐3xFLAG were immunoblotted with anti‐STING and anti‐FLAG.
STING fails to traffic to lysosome‐associated compartments in p62‐deficient cells
To further characterize the nature, origin, and subcellular localization of the compartment containing p62 and STING in DNA‐stimulated cells, we used confocal microscopy to detect endogenous proteins. Following stimulation of the cGAS‐STING pathway, the p62‐STING double‐positive compartments were observed to co‐localize with TBK1, LC3, and ATG9a (Figs 4A and B, and EV4A). The p62‐STING compartments in DNA‐stimulated cells also co‐localized with markers for Golgi and ERGIC, and to a lesser extent the ER (Fig 4C–E). This suggests that the p62‐STING compartments contain material derived from these organelles, but is not localized in the organelles. Electron microscopy showed that the electron‐dense endosome/lysosome‐like structures that accumulated following DNA stimulation localized in close proximity to ER structures (Fig 4F).
Figure 4. STING fails to traffic to lysosomal compartments in p62‐deficient cells.

-
A, BMEFs stimulated with dsDNA (4 μg/ml) or 2′3′ cGAMP (4 μg/ml) for 8 h were fixed and stained with DAPI or antibodies against STING, p62, TBK1, and LC3. Scale bar: 5 μm.
-
C–ETHP1 cells were left untreated or stimulated with dsDNA for 9 h (4 μg/ml). The cells were fixed and stained with antibodies specific for (C) the ER (calnexin), (D) Golgi (GM130), or (E) ERGIC (ERGIC‐53). Scale bars: 5 μm.
-
FElectron microscopy of glutaraldehyde‐fixed MEFs transfected with dsDNA (4 μg/ml) for 8 h. Scale bar: 500 nm.
-
G–IControl and p62 KO THP1 cells were stimulated with dsDNA (4 μg/ml) for 8 h and stained with anti‐STING and DAPI as well as (G) anti‐phospho‐TBK1, (H) anti‐LC3, and (I) LAMP1. Images of the single staining are shown in Fig EV4B–D. Scale bars: 5 μm.
Figure EV4. STING trafficking in response to DNA .

-
AWT MEFs stimulated with dsDNA (4 μg/ml) for 6 h were fixed and stained with antibodies against STING, p62, and ATG9a. Scale bar: 5 μm.
-
B–DImages of single stainings shown in Fig 4G–I. Scale bar: 5 μm.
In order to evaluate the role of p62 in the assembly of the subcellular structures, we compared the staining of control and p62‐deficient THP1 cells for markers of different steps in the activation‐regulation pathway. Strikingly, the characteristic localization of STING in speck‐like patterns in DNA‐stimulated cells was much less abundant in p62‐deficient cells (Fig 4G–I). Consequently, phospho‐TBK1 in the STING‐containing regions was detectable to a lower level in p62‐deficient cells (Figs 4G and EV4B, Appendix Table S1). Interestingly, the speck‐like STING‐positive structures that did not develop to the same extent in p62‐deficient cells were highly positive for LC3 and the lysosome marker LAMP1 (Figs 4H and I, and EV4C and D, Appendix Table S1). Thus, p62 is essential for engaging STING with the autophagy machinery following DNA stimulation and mediating transport to lysosome‐associated compartments.
TBK1 and IRF3 are essential for DNA‐stimulated degradation of STING
TBK1 is essential for DNA‐stimulated IFN induction (Ishii et al, 2006), through phosphorylation of IRF3 in the STING signaling complex (Tanaka & Chen, 2012). In addition, TBK1 has been reported to phosphorylate p62 at S403, hence increasing the affinity of p62 for ubiquitin chains (Pilli et al, 2012). Interestingly, we found that stimulation with DNA or cGAMP elevated the levels of phospho‐p62 in control but not TBK1‐deficient human and murine cells (Figs 5A and EV5A–C). The accumulation of K63‐linked ubiquitin chains in STING‐positive compartments occurred to an elevated extent in TBK1‐deficient cells suggesting a role for the kinase in negative regulation of ubiquitinated STING (Fig EV5D). Consistent with this, STING was not degraded in TBK1‐deficient cells following DNA stimulation (Fig 5A). TBK1 was recruited to p62 after STING stimulation (Fig 2L), and p62 and phospho‐TBK1 showed significant co‐localization in stimulated cells (Fig 5B, Appendix Table S1). To specifically examine the role of p62 S403 phosphorylation in STING turnover, we reconstituted p62 KO THP1 cells with WT and S403A p62 (Fig EV3B) and examined for STING degradation and CXCL10 induction. Importantly, reconstitution with p62 S403A did not restore the ability to degrade STING and to control CXCL10 production (Fig 5C and D).
Figure 5. TBK1 and IRF3 are essential for DNA‐stimulated degradation of STING .

-
AControl and TBK1 KO cells were stimulated with dsDNA (4 μg/ml) for the indicated time intervals, and lysates were immunoblotted with antibodies specific for the antigens shown.
-
BTHP1 cells were left untreated or stimulated with DNA for 3 or 9 h (4 μg/ml). The cells were fixed and stained with antibodies specific for p62, STING, and phospho‐TBK1. Scale bar: 5 μm.
-
C, Dp62 KO THP1 cells were transduced with WT p62, S403A p62, or empty vector. The cells were stimulated with dsDNA for 8 h, and levels of STING were determined by immunoblotting. Supernatants were harvested 18 h later, and levels of CXCL10 were measured by ELISA. The data in panel (D) are presented as means of two replicates ± s.d. *0.01 < P < 0.05; **0.001 < P < 0.005.
-
EControl and IRF3 KO THP1 cells were treated as in (A).
-
F–HWT, Irf3 −/−, Ifnar −/−, and Irf3 S1/S1 MEFs were stimulated with dsDNA (4 μg/ml) for the indicated time intervals, and lysates were immunoblotted with antibodies specific for the antigens shown.
Figure EV5. TBK1 is essential for DNA‐stimulated phosphorylation of p62.

-
AControl and TBK1 KO THP1 cells were stimulated with 2′3′ cGAMP (4 μg/ml) for the indicated time intervals, and lysates were immunoblotted with antibodies specific for phospho‐p62 (p‐p62), phospho‐TBK1 (pTBK1), LC3, and β‐actin.
-
B, CWT and Tbk1 −/− MEF cells were stimulated with dsDNA (4 μg/ml) or 2′3′ cGAMP (4 μg/ml) for the indicated time intervals, and lysates were immunoblotted with antibodies against p62, p‐p62, LC3, and β‐actin.
-
DWT and Tbk1 −/− MEF cells were stimulated with dsDNA (4 μg/ml) for 6 h. The cells were fixed and stained with DAPI and antibodies against STING and K63‐ubiquitin. Scale bar: 5 μm.
-
ETHP1 cells were left untreated or stimulated with DNA for 3 or 9 h (4 μg/ml). The cells were fixed and stained with antibodies specific for p62, STING, and phospho‐IRF3. Scale bar: 5 μm.
-
FWT and Irf3 s1/s1 MEFs were stimulated with dsDNA (4 μg/ml) or 2′3′ cGAMP (4 μg/ml). Supernatants were harvested 18 h later, and levels of CXCL10 were measured by ELISA. Data are presented as means of three replicates ± s.d. ***P < 0.001.
IRF3 is downstream of TBK1 in the IFN induction pathway, and we wanted to explore whether IRF3 was also involved in mediating activation‐induced degradation of STING. Surprisingly, like TBK1‐deficient cells, IRF3‐deficient cells also failed to degrade STING following DNA stimulation despite activation of TBK1 (Fig 5E and F). This correlated with lack of phosphorylation of p62 in the cells lacking IRF3. IRF3 translocates to the nucleus following phosphorylation, but we noted that the cytoplasmic pool of phosphorylated IRF3 co‐localized with p62 and STING (Fig EV5E, Appendix Table S1). The role of IRF3 in p62 phosphorylation and STING degradation could be mediated as a scaffolding protein or through its function as a transcription factor. Therefore, we examined whether DNA‐stimulated turnover of STING still occurred in cells lacking the IFN‐α/β receptor or harboring a transcriptionally inactive mutant form of IRF3, by replacement of Serine 288 and Ser 390 with alanine (Fig EV5F; Chattopadhyay et al, 2016). Although DNA‐stimulated degradation of STING was dependent on IRF3, it was independent of the transcriptional activity of IRF3, as evidenced by retained STING degradation in Irf3 s1/s1 cells, and also of the biological function of type I IFNs (Fig 5G and H). Thus, TBK1 and IRF3 are both essential for DNA‐stimulated degradation of STING. While TBK1 phosphorylates p62 at S403, which increases the affinity of p62 for ubiquitin chains (Pilli et al, 2012), the mode of action of IRF3 in STING degradation is not resolved.
Regulation of innate immune responses to DNA pathogens is dependent on p62
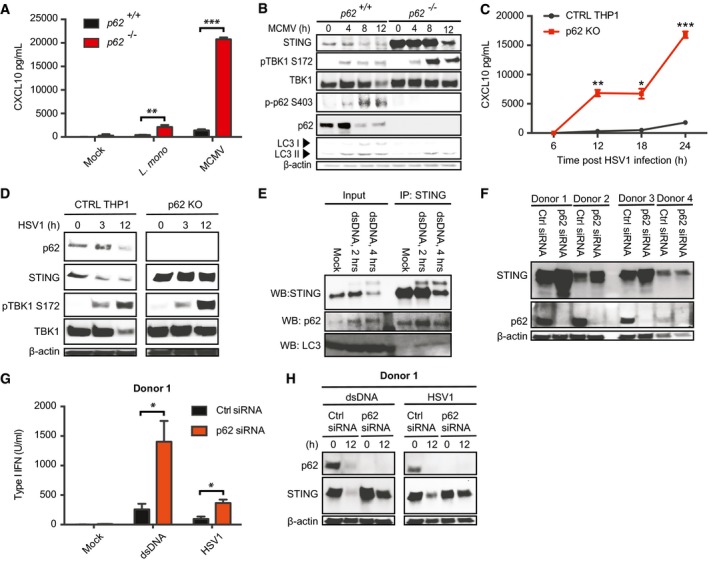
To examine the role of p62 in regulation of innate immune responses to DNA pathogens, we infected WT and p62 −/− MEFs with murine cytomegalovirus (MCMV) and Listeria monocytogenesis and measured induction of CXCL10. Similar to what was observed after stimulation with synthetic DNA, infections with the DNA pathogens stimulated elevated responses in the p62‐deficient cells, which was associated with impaired degradation of STING and elevated activation of TBK1 at late time points (Figs 6A and B, and EV6A–D). Since we observed significantly higher constitutive levels of STING in p62 −/− MEFs compared to WT (Figs 6B and EV3A), we also wanted to evaluate THP1 cells where this phenomenon was not observed. Infection with HSV‐1 induced a strongly elevated production of CXCL10 in p62‐deficient cells compared to the control cells, and STING was not degraded in the infected knockout cells (Fig 6C and D).
Figure 6. P62 exerts negative control of innate responses to infection with bacteria and DNA viruses.
-
A, BWT and p62 −/− MEFs were infected with Listeria monocytogenes (MOI 25) or MCMV (MOI 10). Supernatants were harvested 18 h post‐treatment, and lysates were isolated at the indicated time points. Supernatants were analyzed for levels of CXCL10, and lysates were immunoblotted for the indicated antigens.
-
C, DControl and p62 KO THP1 cells were infected with HSV‐1 (MOI 10) for the indicated time intervals. Supernatants were analyzed for levels of CXCL10, and lysates were immunoblotted for p62, STING, phospho‐TBK1, and β‐actin.
-
ELysates from human monocyte‐derived macrophages transfected with dsDNA (4 μg/ml) were immunoprecipitated with anti‐STING, and immunoblotted with antibodies directed against STING, p62, and LC3.
-
F–Hp62 was knocked down by siRNA in human monocyte‐derived macrophages from four donors. (F) Immunoblotting for p62 and β‐actin in lysates from the four donors. (G, H) The siRNA‐treated cells were treated with dsDNA (4 μg/ml) or infected with HSV‐1 (MOI 10). Supernatants were harvested 12 h post‐treatment, and lysates were isolated at the indicated time points. Supernatants were analyzed for levels of type I IFN, and lysates were immunoblotted for p62, STING, and β‐actin.
Figure EV6. P62 exerts negative control of the STING pathway in response to DNA pathogens.

-
A–DWT and p62 −/− MEFs were infected with MCMV (MOI 10). Total RNA was harvested 6 h post‐treatment analyzed for expression of Cxcl10, Ifit1, Viperin, and Isg15 mRNA.
-
E–GMDMs from donor 2–4 treated with control and p62‐specific siRNA were stimulated with dsDNA (4 μg/ml) or infected with HSV1 (MOI 3). Supernatants were harvested 18 h post‐treatment, and levels of type I IFN bioactivity were measured.
To evaluate the role of p62 in control of the cGAS‐STING pathway in primary human cells, monocyte‐derived macrophages were stimulated with DNA and interaction between STING and p62 was measured. Similar to the observation in THP1 cells, p62 interacted with STING in primary macrophages, and we also found inducible recruitment of LC3 to STING after DNA stimulation (Fig 6E). We managed to achieve strong knockdown of p62 in the primary human macrophages, and observed that the cells with reduced p62 expression produced more type I IFN after stimulation with DNA or infection with HSV‐1 (Figs 6F and G, and EV6E–G). In these cells, we also observed higher constitutive levels of STING and impaired DNA‐induced degradation of STING (Fig 6H). Based on these data, we conclude that p62 is essential for executing degradation of STING and attenuation of signaling after infection with DNA pathogens.
Discussion
The immune system is activated in response to alteration of homeostasis, as seen during infection, cancer, inefficient elimination of cellular material, and tissue damage (Kotas & Medzhitov, 2015). In order to achieve the beneficial effect of an immune response, this system needs to be tuned for the challenge the organism is facing. Therefore, signaling by immune receptors should provide information on the nature of the challenge, the strength of the required signal, and the needed duration of the response. In the innate immune system, ligand‐specific activation of PRRs provide information on the nature of the challenge, while the concentrations of the microbe‐ and host‐derived immunostimulatory molecules control the strength of the signals. In contrast to this, there is currently much less knowledge on the signals that instigate negative control of innate immune pathways. Cytosolic accumulation of DNA represents a danger signal, which stimulates type I IFN production through the cGAS‐STING pathway (Paludan, 2015). In this work, we demonstrate that attenuation of DNA‐stimulated IFN signaling is dependent on the selective autophagy receptor p62, which targets ubiquitinated STING for autophagy‐mediated degradation (Appendix Fig S1).
Autophagy is now well established to play important roles in both activation and regulation of innate and adaptive immune responses (Levine et al, 2011). Previous reports have suggested that autophagy components are involved in negative regulation of DNA signals, although double membranes were not found, thus suggesting a type of non‐canonical autophagy (Saitoh et al, 2009; Konno et al, 2013). We were able to reproduce key data from these studies, including reduced phosphorylation of ULK1 at S555 and co‐localization between Atg9a and STING after DNA stimulation. However, in addition to this, we examined for other markers for different stages of the canonical autophagy pathway (Klionsky et al, 2016). Using electron microscopy of glutaraldehyde‐fixed DNA‐treated cells, we found that DNA stimulates accumulation of electron‐dense lysosome‐like vesicles, but also larger vesicles with double membranes, suggesting that cytosolic DNA stimulates lysosomal pathways and autophagy. In stimulated cells, we found STING to localize to vesicles positive for K63‐linked ubiquitin, p62, TBK1, IRF3, ATG9a, LC3, and LAMP1 as well as markers for ER, Golgi, and ERGIC. With the observed DNA‐induced (i) formation of double‐membrane autophagosomes, (ii) reduced phosphorylation of ULK1 at S555, (iii) LC3 conversion, (iv) and p62 turnover, together with the essential role for ATG3 in degradation of STING we conclude that DNA and cGAMP stimulate a full autophagy pathway, and that STING is degraded through this pathway to attenuate signaling. Since ULK1 has also been suggested to directly inactivate STING through phosphorylation (Konno et al, 2013), our results suggest that autophagy proteins down‐modulate STING activity through both canonical and non‐canonical pathways. This may represent a means to avoid excess inflammation.
One study has described that DNA stimulates cGAS‐dependent but STING‐independent autophagy, through a mechanism involving direct association between cGAS and beclin‐1, thus releasing the inhibitory interaction with Rubicon (Appendix Fig S1; Liang et al, 2014). We observed in agreement with a previous report that STING activation directly induces LC3 conversion and reduced phosphorylation of ULK1 at S555 (Konno et al, 2013), which occurs in a manner dependent on AMP‐activated protein kinase (Konno et al, 2013). This suggests that DNA stimulates autophagy through two pathways, both dependent on cGAS, but only one of the pathways is dependent on STING. The roles and importance of these two DNA‐stimulated autophagy pathways under different conditions have yet to be clarified. Work by Watson et al has demonstrated that Mycobacterium tuberculosis activates autophagy in a manner exhibiting equal dependency on cGAS and STING (Watson et al, 2012, 2015), potentially suggesting the STING‐dependent DNA‐activated autophagy pathway to be most important for control of bacterial infections. While the STING‐independent autophagy pathway was shown to mediate degradation of DNA as a means to clear to cytoplasm for foreign DNA (Liang et al, 2014), we report here that the STING‐dependent autophagy pathway directs STING itself for degradation, in a p62‐dependent manner. Our observation that the constitutive STING levels were higher in MEFs and MDMs lacking p62, and also observed in Atg3 −/− MEFs, suggests that the p62 autophagy pathway is also involved in constitutive turnover of STING. This was not observed in THP1 cells, where basal STING levels were independent of p62 expression. This argues for a two‐step model where (i) basal autophagy plays a role in constitutive turnover of STING (dependent on ATG3 and p62), and (ii) DNA‐stimulated autophagy is essential for turnover of STING after activation (dependent on ATG3, p62, TBK1, and IRF3). Of these two modes of STING degradation, both are operative in MEFs and MDMs, but only the stimulation‐induced pathway is found to a detectable level in THP1 cells.
At the mechanistic level, DNA stimulated K63‐linked ubiquitination of STING and activation of TBK1 and IRF3. Interestingly, DNA also mediated interaction between TBK1 and p62, and instigated TBK1 dependent phosphorylation of p62 at S403, which in turn gains increased affinity for K63‐linked ubiquitin chains (Pilli et al, 2012). Consequently, DNA‐stimulated degradation of STING was dependent on TBK1. This process was also dependent on IRF3, but not the transcriptional activity of the protein. Stimulation of the cGAS‐STING pathway triggers activation of TBK1, which in turn recruits and phosphorylates IRF3. We propose that once the pathway has been activated to the level of IRF3, p62 is recruited to TBK1 and phosphorylated by the kinase, thus further strengthened the affinity of p62 for ubiquitinated STING to promote its traffic to autophagosomes. Since several ubiquitin E3 ligases have been reported to ubiquitinate STING, more information is required to fully understand the functionally important dynamics of ubiquitination for both activation and regulation of the cGAS‐STING pathway (Zhong et al, 2009; Tsuchida et al, 2010; Zhang et al, 2012; Wang et al, 2014; Ni et al, 2017). The observation that STING degradation is initiated only when the IFN induction pathway is activated to the level of IRF3 is intriguing. In this way only actively signaling STING would be degraded, and, in addition, STING would not be degraded in cells infected with DNA viruses that target the STING pathway at the step between TBK1 activation and IRF3 activation (Liang et al, 2012; Christensen et al, 2016). It should be noted that ubiquitin‐dependent degradation of STING is not limited to the autophagy pathway, since the E3 ubiquitin ligases RNF5 and TRIM30α promote K48 polyubiquitination of STING, which targets it for proteasomal degradation (Zhong et al, 2009; Wang et al, 2015).
p62 is part of a larger family of ubiquitin‐binding autophagy receptors, which link ubiquitin to autophagy by harboring both a ubiquitin‐binding domain and an LC3‐interaction region (Levine et al, 2011). p62 is well established to be essential for the clearance of aggresomes, through a mechanism involving HDAC6. However, since Hdac6 −/− cells, in contrast to p62‐deficient cells, responded normally to DNA, the p62‐dependent termination of STING signaling seems to be occurring through a different mechanism than elimination of aggresomes. Interestingly, there is evidence for a role for p62 in negative regulation of the DNA‐activated AIM2 inflammasome (Shi et al, 2012), and in constitutive turnover of cGAS (Chen et al, 2016). Collectively these reports suggest a broader role for p62 in negative regulation of DNA‐stimulated immune responses. It should also be noted that STING turnover did occur in p62‐deficient cells, although to a reduced extent and with much delay. This shows the existence of several mechanisms for STING turnover, as already documented in the literature (Zhong et al, 2009; Qin et al, 2014; Hu et al, 2016). In addition to the reported negative regulation of immune responses, selective autophagy receptors have been demonstrated to be involved in autophagy of ubiquitinated bacteria and viruses (Thurston et al, 2009; Orvedahl et al, 2010; Wild et al, 2011; Chong et al, 2012; Watson et al, 2012). Interestingly, this function of the receptors was promoted by TBK1 (Thurston et al, 2009; Wild et al, 2011; Watson et al, 2012). In fact, TBK1 has recently been shown to phosphorylate all the selective autophagy receptors linking ubiquitinated cargo to autophagic membranes (Richter et al, 2016). Thus, the TBK1‐p62 axis plays a pivotal role in both activation and regulation of host defense and inflammation.
In conclusion, this work demonstrates that the DNA‐stimulated cGAS‐STING‐TBK1 pathway, which induces activation of IRF3 and expression of type I IFNs, also triggers phosphorylation of p62, which targets STING for autophagosomal degradation. The work thus demonstrates that the very same pathway that turns on IFN production has an in‐built off‐switch, which is engaged only when the STING signalsome is active. Given the well‐described role of the STING pathway in inflammatory diseases (Liu et al, 2014), proper function of the TBK1‐p62 relay may be essential to limit the IFN response following challenge with cytosolic DNA.
Materials and Methods
Mice
C57BL/6 and cGAS−/− mice were bred at Taconic M&B. Isoflurane (Abbott), or [ketamine (MSD Animal Health) and xylazine (RompunVet)], was used to anesthetize mice, and all described animal experiments have been reviewed and approved by Danish government authorities and comply with Danish laws. No animals were excluded from the analysis.
Reagents, virus, and bacteria
For stimulations and inhibitions, we used 60‐mer dsDNA (DNA technology) (Unterholzner et al, 2010), 2′3′ cGAMP, DMXAA, MG132, Bafilomycin A1, and 3‐methyladenime (all from InvivoGen). HSV‐1 (strain F) and L. monocytogenesis (strain LO28) were propagated as described previously (Hansen et al, 2014; Christensen et al, 2016). For production of MCMV (strain K181), Ifnar −/− MEFs were infected with virus at MOI 0.01. The infection was allowed to proceed until the cytopathic effects exceeded 90%, at which point the culture flasks were frozen. Cell debris was cleared from the thawed media by centrifugation at 4,500 × g for 60 min (4°C). The supernatant was subjected to centrifugation at 26,700 × g on SORVAL RC6 plus (Thermo Scientific) for 5 h, and the concentration of virus in the resuspended pellet was determined by titration on Ifnar −/− MEF monolayers.
Cells
The cell lines used were MEFs, THP1, and human foreskin fibroblasts (HFFs). MEFs and HFFs were maintained in DMEM, and THP1 cells were grown in RPMI 1640. All media were supplemented with 10% fetal calf serum and penicillin–streptomycin. The following MEF lines were used (laboratory which generated the line): cGas −/− , Sting gt/gt (Paludan); Atg3 −/−, p62 −/−, and Nbr1 −/− (Masaaki Komatsu); Ulk1/2 −/− (Craig B Thompson); Ifnar −/− (Jason Upton); Irf3 −/− and Tbk1 −/− (John Hiscott); Irf3 S1/S1 and Hdac6 −/− (Ganes C Sen). The following genome‐edited THP1‐derived cell lines were used: cGAS KO, STING KO, TBK1 KO, IRF3 KO, and p62 KO. See section below for details on how the cells were generated. For differentiation of monocyte‐derived macrophages (MDMs), peripheral blood mononuclear cells were isolated from healthy donors by Ficoll–Paque gradient centrifugation (GE Healthcare). Monocytes were separated by adherence to plastic in RPMI 1640 supplemented with 10% AB‐positive human serum. Differentiation of monocytes to macrophages was achieved by culturing in Dulbecco's modified Eagle medium (DMEM) supplemented with 10% heat‐inactivated AB‐positive human serum; 200 IU/ml penicillin; 100 μg/ml streptomycin; and 600 μg/ml glutamine for 10 days in the presence of 10 ng/ml M‐CSF (R&D Systems).
Generation of gene‐modified cells
THP1 cells deficient in cGAS, STING, TBK1, and IRF3 were generated with CRISPR/Cas9 technology as described (Ablasser et al, 2013; Holm et al, 2016). For generation of p62‐deficient THP1 cells, we constructed lentiviral vectors expressing Cas9 and gRNA using the lentiCRISPR v2 (Addgene plasmid # 52961). The gRNAs used were p62 gRNA#1, 5′‐gATGGCCATGTCCTACGTGA‐3′; p62 gRNA#2, 5′‐GTCATCCTTCACGTAGGACA‐3′. All gRNAs match sequences in the first exon of the target genes. The cells were transduced with the individual lentiviral vectors and diluted into single cells. The clones were expanded in the presence of puromycin (1 μg/ml) for 2 weeks, and the complete knockout of the target gene in the clones was identified by Western blot. The p62 gRNA#1 lentiviral vector was also used to transduce human foreskin fibroblasts, in which case the transduced cells were treated with puromycin (1 μg/ml) for 30 days, and used for experiments without clonal selection. For rescue of p62 expression (WT or S403A) in p62 KO, THP1 cells were transduced with lentivirus encoding human wt and S403S p62 modified in exon 1 to prevent targeting from gRNA#1 (Applied Biological Materials Inc.). Single‐cell clones were selected, and expression of p62 was confirmed by Western blotting. For rescue of p62 expression in p62 −/− MEFs, cells were transduced with high‐titer lentivirus encoding murine wt p62 (Applied Biological Materials Inc.). The cells were incubated for 3 days and used for experiments.
siRNA knockdown in primary human macrophages
For siRNA knockdown in MDMs, cells were transfected with a pool of p62 specific siRNAs (L‐010230‐00‐0020) or scrambled siRNA controls (45 nM) using Lipofectamine RNAiMax (Life technologies) on days 6 and 8 into the differentiation procedure. The cells were used for experiments after 10 days of differentiation.
Electron microscopy
Cells were washed twice in PBS and fixed in 2% glutaraldehyde in 0.1 M sodium cacodylate buffer, pH 7.2 overnight at 4°C. Subsequently, the cells were washed in 0.1 M cacodylate buffer, pH 7.2, and embedded in 2% agarose. This was followed by post‐fixation in 1% osmium in 0.1 M cacodylate buffer, pH 7.2 for 60 min, washed as above and subsequently in maleate buffer, pH 5.2. The agarose embedded cells were én‐bloc stained with 0.5% uranyl acetate in maleate buffer for 60 min. The cells were washed again, dehydrated in graded alcohols, transferred to propylene oxide 3 × 10 min, followed by overnight incubation in 50% propylene oxide and 50% Epon (TAAB, Berkshire, England), and finally infiltrated with Epon. Sections with a thickness of 50–70 nm were cut for electron microscopy with a Reichert Jung Ultracut E microtome. The sections were stained with saturated uranyl acetate for 10 min and Pb‐citrate for 2 min.
Stereology
EM images are taken using a Phillips 100 CM electron microscope equipped with a SISIII digital camera at 1,500× and 5,000× magnification in a systematic way with a random start. Using a 2D‐unbiased counting frame with a certain guard area to the edges of the images, a number of cell profiles were sampled. For each sampled cell profile, the volume fraction of the autophagosomes and electron‐dense endosome/lysosome‐like vesicles was estimated using the following formula:
When ∑P(Auto) is the number of test points hitting autophagosomes or endosome/lysosome‐like vesicles and ∑P(Cell) the number of test points hitting sampled cell profiles. The area of each sampled cell profile was estimated by the 2D nucleator with five test lines (Nyengaard, 1999). For the cell samples analyzed in this work, the cell profile areas were not statistically significant different between the groups. If we assume that the height of the cells is not either different between the two groups, then there is no difference in the reference volume (equal to cell volume) between the groups and it is possible to compare the volume fraction of the autophagosomes and endosome/lysosome‐like vesicles between the groups without a risk of falling into the reference trap.
RNA isolation and quantitative RT–PCR
The RNA purification and qPCR was performed as described (Reinert et al, 2016), with the following primers from Applied Biosystems: Ifnb (Mm00439552_s1), Cxcl10 (Mm00445235_m1), IFNB1 (Hs01077958_s1), CXCL10 (Hs01124251_g1). Levels of mRNAs of interest were normalized to β‐actin using the formula 2Ct(βactin) − Ct(mRNA X). The resulting normalized ratio (NR) was either presented directly in the figures or further normalized to the NR of untreated WT cells as specified in the figure legends.
Fluidigm
Biomarker (Fluidigm) was used for multiplex quantitative real‐time (qPCR) as described (Reinert et al, 2016). For brief description, see the Supplemental Experimental Procedures. Briefly, total RNA was isolated and specific targets were pre‐amplified in one step using the CellDirect One‐Step qRT–PCR kit (Invitrogen) according to the manufacturer's instructions. Pre‐amplified cDNA was diluted at least 1:5 in low EDTA TE‐buffer (VWR—Bie & Berntsen) before PCR (qPCR) on the BioMarker (Fluidigm). qPCR was performed in the 48.48 Dynamic Array Integrated Fluidic Circuits (Fluidigm) combining pre‐amplified samples with TaqMan gene expression assays (Applied Biosystems) as described (Reinert et al, 2016), including [Mx2 (Mm00488995_m1), Ifit1 (Mm00515153_m1), Ifit2 (Mm00492606_m1), Irf7 (Mm00516788_m1), Tbk1 (Mm00451150_m1), and Irf3 (Mm00516784_m1)]. Data were acquired using the Fluidigm Real‐Time PCR Analysis software 3.0.2 (Fluidigm).
ELISA
CXCL10 protein levels were measured by ELISA using the hCXCL10/IP‐10 DuoSet (R&D Systems).
Type I IFN bioassay
Bioactive human type I IFN was measured on cell supernatants by use of HEK‐Blue™ IFN‐α/β cells as reporter cells according to the manufacturer instructions (InvivoGen), and as described by the manufacturer.
Immunoblotting
Whole‐cell extracts or immunoprecipitation samples were analyzed by immunoblotting. Samples were diluted in XT sample buffer and XT reducing agent and ran on a SDS–PAGE (Criterion™ TGX™). Trans‐Blot Turbo™ Transfer System® was used for the transfer of proteins to PVDF membranes (all reagents Bio‐Rad). The membrane was blocked in 5% Difco™ skim milk (BD) or 5% bovine serum albumin (BSA) (Sigma). For detection of STING dimerization, samples were prepared for electrophoresis using non‐reducing RIPA lysis buffer with 0.2% SDS and complete mini inhibitor (Sigma). The antibodies used for immunoblotting were as follows: rabbit anti‐cGAS (Cell Signaling, D1D3G/#15102, 1:1,000), rabbit anti‐STING (Cell Signaling, D2P2F/#13647, 1:1,000), sheep anti‐STING (R&D Systems, AF6516, 1:500), rabbit anti‐pSTING (S366) (Cell Signaling Technology, #85735), rabbit anti‐TBK1 (Cell Signaling, D1B4/#3504, 1:1,000), rabbit anti‐pTBK1 (Ser172) (Cell Signaling, D52C2/#5483, 1:1,000), rabbit anti‐IRF3 (Cell Signaling, D83B9/#4302, 1:1,000), rabbit anti‐pIRF3 (Ser396) (Cell Signaling, D6O1M/#29047, 1:1,000), rabbit anti‐pULK1 (Ser555) (Cell Signaling, D1H4/#5869, 1:1,000), guinea pig anti‐p62 (Progen, GP62‐C, 1:2,000), rat anti‐pp62 (Ser403) (MBL, D343‐3, 1:1,000), rabbit anti‐LC3 (MBL, PM036, 1:1,000), rabbit anti‐NBR1 (Cell Signaling, D2E6/#9891, 1:1,000), rabbit anti‐NDP52 (Genetex, GTX630396, 1:1,000), mouse anti‐optineurin (EMD Millipore, MABT185, 1:1,000), mouse anti‐c‐Myc HRP (Santa Cruz, 9E10, sc‐40 HRP, 1:400), mouse anti‐FLAG M2 (Sigma‐Aldrich, F3165, 1:1,000), rabbit anti‐HA (Cell Signaling, C29F4/#3724, 1:1,000), and mouse anti‐β‐actin (Abcam, AC‐15/ab49900, 1:10,000).
Ectopic expression of proteins in HEK293T cells
HEK293T cells were seeded into 6‐cm culture dishes to ~70% confluency. The cells were transfected with 4 μg pRK‐7‐Flag‐hSTING and 4 μg HA‐ubiquitin (Addgene) using 12 μg polyethyleneimine (PEI). After transfection for 24 h, the cells were lysed in IP‐lysis buffer (Thermo Fisher Scientific) with 10 mM NaF and 1× Complete EDTA‐free protease inhibitor cocktail tablets (Roche). The lysates were incubated with anti‐HA magnetic beads (Thermo Scientific) for 2 h at room temperature. After three times washing, the immunoprecipitates were eluted. In another set of experiments, HEK293T cells stably expressing STING cells were transfected with 2 μg pIRESpuro3‐p62‐N3‐FLAG using 2 μg PEI. Lysates and eluates were analyzed by Immunoblotting.
Immunoprecipitation
Cleared cell lysates were incubated with antibodies against STING (1:50) or p62 (1:50) overnight at 4°C. The antibodies used were rabbit anti‐STING (Cell Signaling, D2P2F/#13647) and guinea pig anti‐p62 (Progen, GP62‐C). Protein G Dynabeads® (Novex by Life Technologies) were added for the last 2 h (0.9 mg per IP reaction in 240 μl). Immunoprecipitated complexes were eluted from the beads with a glycine buffer (200 mM glycine, pH 2.5), and protein expression was evaluated by Western blotting.
Purification of endogenous ubiquitin conjugates
Tandem ubiquitin‐binding entities (TUBEs) were used to purify endogenous ubiquitin conjugates from THP‐1 cell lysates. Purification of glutathione‐S‐transferase (GST) fused to 1×UBAubq Ub conjugates was pulled down in THP‐1 cells using affinity reagents as in (Fiil et al, 2013). For isolation of K63‐Ub chains and K48‐Ub chains, LifeSensors were used according to the manufacturer's recommendations. PMA differentiated 10 × 106 THP‐1 cells were lysed in ice‐cold 600 μl TUBE lysis buffer contains (20 mM Na2HPO4, 20 mM NaH2PO4, 1% NP‐40, 2 mM EDTA) supplemented with 1 mM DTT, 5 mM NEM (Sigma‐Aldrich), complete protease inhibitor cocktail (Roche), PhosSTOP (Roche). Pre‐bound Glutathione Sepharose 4B beads (GE Healthcare) was added to 50 μg/ml of GST‐TUBE for 1 h. Lysates were incubated on ice and cleared by sonication and centrifugation, mixed the supernatant with beads followed the incubation at 4°C for a minimum of 6 h with continual rotation. The sepharose beads were washed three times in 1 ml ice‐cold PBS 0.1%. (v/v) Tween‐20. 1× LSB buffer used to elute the bound Ub sample material.
Confocal microscopy
MEFs or PMA‐differentiated THP1 cells were seeded on coverslips and stimulated as indicated. The cells were fixed with 4% formaldehyde (Sigma), permeabilized with 0.1% Triton X‐100 (Sigma), and blocked with 1% BSA (Sigma). Cells were stained with primary antibodies for 2 h and with secondary antibody (all 1:500, Alexa Fluor; Invitrogen) for 1 h. Cell nuclei were stained with DAPI (Invitrogen). Images were acquired on Zeiss LSM 710 confocal microscope using a 63 × 1.4 oil‐immersion objective and processed with the Zen2010 (Zeiss) and ImageJ software. The antibodies used were mouse anti‐cGAS (Santa Cruz, D‐9/sc‐515777, 1:50), sheep anti‐STING (R&D Systems, AF6516, 1:50), rabbit anti‐TBK1 (Abcam, ab115623, 1:50), rabbit anti‐pTBK1 (Cell Signaling, D52C2/#5483, 1:50), rabbit anti‐pIRF3 (Cell Signaling, D6O1M/#29047, 1:50), rabbit anti‐LC3 (MBL, PM036, 1:100), guinea pig anti‐p62 (Progen, GP62‐C, 1:200), rabbit anti‐NBR1 (Cell Signaling, D2E6/#9891, 1:200), mouse anti‐NDP52 (EMD Millipore, MAB4386, 1:100), rabbit anti‐optineurin (Genetex, GTX105447, 1:100), mouse anti‐beclin‐1 (Santa Cruz, E‐8/sc‐48341, 1:50), mouse anti‐LAMP1 (Santa Cruz, H4A3/sc‐20011, 1:50), rabbit anti‐ATG9a (Genetex, GTX128427, 1:100), mouse anti‐ubiquitin (Life Sensors, VU101, 1:100), mouse anti‐K63 ubiquitin (EMD Millipore, apu3/05‐1308, 1:100), rabbit anti‐K48 ubiquitin (Abcam, ab140601, 1:200), rabbit anti‐calnexin (Abcam, ab22595, 1:100), mouse anti‐GM130 (BD Biosciences, 610823, 1:200), and rabbit anti‐ERGIC‐53 (Santa Cruz, B‐4/sc‐398893, 1:100).
Live cell imaging
MEF cells were transiently transfected using Lipofectamine 2000 with a combination of LC3‐EGFP and STING‐mCherry, seeded on rat tail collagen‐coated glass coverslips, and allowed to express for 24 h. For live cell imaging, media were changed to phenol red‐free DMEM with 10% FBS, antibiotics and 25 mM HEPES. Imaging was performed using a Nikon Ti Eclipse automated microscope equipped with an Andor Zyla sCMOS camera, a 100 × Apo oil TIRF objective (NA 1.49) and a 37°C heating chamber. DMXAA was added just before image acquisition. Images were captured in wide‐field mode every minute for a minimum of 3 h. The experiment was repeated on three different days with a minimum of three cells captured per day. Image sequences were analyzed using ImageJ Fiji.
Statistics
For analysis of statistically significant difference between two groups of data, we used two‐tailed Student's t‐test when the data exhibited normal distribution, and Wilcoxon rank sum test when the data set did not pass the normal distribution test.
Author contributions
TP and SRP conceived the idea and designed the experiments. TP, CB, CK, MHC, B‐cZ, CS, LR, YC, SBJ, MKS, and LNN performed the experiments. RN, JRN, MRJ, MG‐H, and SRP supervised experiments. CBT, RJL, GCS, GvL, and MK provided reagents. TP and SRP wrote the manuscript.
Conflict of interest
The authors declare that they have no conflict of interest.
Supporting information
Appendix
Expanded View Figures PDF
Movie EV1
Review Process File
Acknowledgements
The technical assistance of Kirsten Stadel Petersen, Gitte Albinus Pedersen, and Ane Kjeldsen is greatly appreciated. This work was funded by The Danish Medical Research Council (12‐124330), The Novo Nordisk Foundation, The Lundbeck Foundation (R198‐2015‐171), and Aarhus University Research Foundation (all S.R.P.). Centre for Stochastic Geometry and Advanced Bioimaging is supported by the Villum Foundation. In addition, we received funding from The Lundbeck Foundation (R126‐2012‐11389, T.P.), The EU FP7 Mobilex program (4092‐00253) (C.B.), The Chinese Scholarship Council (C.S.), and The graduate School of Health, AU (M.H.C.). M.G‐H. is supported by Ludwig Institute for Cancer Research Ltd, a Wellcome Trust Fellowship (102894/Z/13/Z), a Sapere Aude: Danish Council for independent Research Starting Grant, and the EMBO Young Investigator Programme.
The EMBO Journal (2018) 37: e97858
References
- Ablasser A, Schmid‐Burgk JL, Hemmerling I, Horvath GL, Schmidt T, Latz E, Hornung V (2013) Cell intrinsic immunity spreads to bystander cells via the intercellular transfer of cGAMP. Nature 503: 530–534 [DOI] [PMC free article] [PubMed] [Google Scholar]
- Auerbuch V, Brockstedt DG, Meyer‐Morse N, O'Riordan M, Portnoy DA (2004) Mice lacking the type I interferon receptor are resistant to Listeria monocytogenes . J Exp Med 200: 527–533 [DOI] [PMC free article] [PubMed] [Google Scholar]
- Chattopadhyay S, Kuzmanovic T, Zhang Y, Wetzel JL, Sen GC (2016) Ubiquitination of the transcription factor IRF‐3 activates RIPA, the apoptotic pathway that protects mice from viral pathogenesis. Immunity 44: 1151–1161 [DOI] [PMC free article] [PubMed] [Google Scholar]
- Chen M, Meng Q, Qin Y, Liang P, Tan P, He L, Zhou Y, Chen Y, Huang J, Wang RF, Cui J (2016) TRIM14 inhibits cGAS degradation mediated by selective autophagy receptor p62 to promote innate immune responses. Mol Cell 64: 105–119 [DOI] [PubMed] [Google Scholar]
- Chiao PJ, Miyamoto S, Verma IM (1994) Autoregulation of IkappaB alpha activity. Proc Natl Acad Sci USA 91: 28–32 [DOI] [PMC free article] [PubMed] [Google Scholar]
- Chong A, Wehrly TD, Child R, Hansen B, Hwang S, Virgin HW, Celli J (2012) Cytosolic clearance of replication‐deficient mutants reveals Francisella tularensis interactions with the autophagic pathway. Autophagy 8: 1342–1356 [DOI] [PMC free article] [PubMed] [Google Scholar]
- Christensen MH, Jensen SB, Miettinen JJ, Luecke S, Prabakaran T, Reinert LS, Mettenleiter TC, Chen ZJ, Knipe DM, Sandri‐Goldin RM, Enquist LW, Hartmann R, Mogensen TH, Rice SA, Nyman TA, Matikainen S, Paludan SR (2016) HSV‐1 ICP27 targets the TBK1‐activated STING signalsome to inhibit virus‐induced type I IFN expression. EMBO J 35: 1385–1399 [DOI] [PMC free article] [PubMed] [Google Scholar]
- Crow YJ, Manel N (2015) Aicardi‐Goutieres syndrome and the type I interferonopathies. Nat Rev Immunol 15: 429–440 [DOI] [PubMed] [Google Scholar]
- Damgaard RB, Nachbur U, Yabal M, Wong WW, Fiil BK, Kastirr M, Rieser E, Rickard JA, Bankovacki A, Peschel C, Ruland J, Bekker‐Jensen S, Mailand N, Kaufmann T, Strasser A, Walczak H, Silke J, Jost PJ, Gyrd‐Hansen M (2012) The ubiquitin ligase XIAP recruits LUBAC for NOD2 signaling in inflammation and innate immunity. Mol Cell 46: 746–758 [DOI] [PubMed] [Google Scholar]
- Deng L, Liang H, Xu M, Yang X, Burnette B, Arina A, Li XD, Mauceri H, Beckett M, Darga T, Huang X, Gajewski TF, Chen ZJ, Fu YX, Weichselbaum RR (2014) STING‐dependent cytosolic DNA sensing promotes radiation‐induced type I interferon‐dependent antitumor immunity in immunogenic tumors. Immunity 41: 843–852 [DOI] [PMC free article] [PubMed] [Google Scholar]
- Dobbs N, Burnaevskiy N, Chen D, Gonugunta VK, Alto NM, Yan N (2015) STING activation by translocation from the ER is associated with infection and autoinflammatory disease. Cell Host Microbe 18: 157–168 [DOI] [PMC free article] [PubMed] [Google Scholar]
- Fiil BK, Damgaard RB, Wagner SA, Keusekotten K, Fritsch M, Bekker‐Jensen S, Mailand N, Choudhary C, Komander D, Gyrd‐Hansen M (2013) OTULIN restricts Met1‐linked ubiquitination to control innate immune signaling. Mol Cell 50: 818–830 [DOI] [PMC free article] [PubMed] [Google Scholar]
- Gack MU, Shin YC, Joo CH, Urano T, Liang C, Sun L, Takeuchi O, Akira S, Chen Z, Inoue S, Jung JU (2007) TRIM25 RING‐finger E3 ubiquitin ligase is essential for RIG‐I‐mediated antiviral activity. Nature 446: 916–920 [DOI] [PubMed] [Google Scholar]
- Gall A, Treuting P, Elkon KB, Loo YM, Gale M, Barber GN, Stetson DB (2012) Autoimmunity initiates in nonhematopoietic cells and progresses via lymphocytes in an interferon‐dependent autoimmune disease. Immunity 36: 120–131 [DOI] [PMC free article] [PubMed] [Google Scholar]
- Gao D, Li T, Li XD, Chen X, Li QZ, Wight‐Carter M, Chen ZJ (2015) Activation of cyclic GMP‐AMP synthase by self‐DNA causes autoimmune diseases. Proc Natl Acad Sci USA 112: E5699–E5705 [DOI] [PMC free article] [PubMed] [Google Scholar]
- Gleason CE, Ordureau A, Gourlay R, Arthur JS, Cohen P (2011) Polyubiquitin binding to optineurin is required for optimal activation of TANK‐binding kinase 1 and production of interferon beta. J Biol Chem 286: 35663–35674 [DOI] [PMC free article] [PubMed] [Google Scholar]
- Hansen K, Prabakaran T, Laustsen A, Jorgensen SE, Rahbek SH, Jensen SB, Leber JH, Decker T, Horan KA, Jakobsen MR, Paludan SR (2014) Listeria monocytogenes induces IFNβ expression through an IFI16, cGAS, and STING dependent pathway. EMBO J 33: 1654–1666 [DOI] [PMC free article] [PubMed] [Google Scholar]
- Holm CK, Rahbek SH, Gad HH, Bak RO, Jakobsen MR, Jiang Z, Hansen AL, Jensen SK, Sun C, Thomsen MK, Laustsen A, Nielsen CG, Severinsen K, Xiong Y, Burdette DL, Hornung V, Lebbink RJ, Duch M, Fitzgerald KA, Bahrami S et al (2016) Influenza A virus targets a cGAS independent STING pathway, which controls enveloped RNA viruses. Nat Commun 7: 10680 [DOI] [PMC free article] [PubMed] [Google Scholar]
- Hornung V, Ablasser A, Charrel‐Dennis M, Bauernfeind F, Horvath G, Caffrey DR, Latz E, Fitzgerald KA (2009) AIM2 recognizes cytosolic dsDNA and forms a caspase‐1‐activating inflammasome with ASC. Nature 458: 514–518 [DOI] [PMC free article] [PubMed] [Google Scholar]
- Hu MM, Yang Q, Xie XQ, Liao CY, Lin H, Liu TT, Yin L, Shu HB (2016) Sumoylation promotes the stability of the DNA sensor cGAS and the adaptor STING to regulate the kinetics of response to DNA virus. Immunity 45: 555–569 [DOI] [PubMed] [Google Scholar]
- Ishii KJ, Coban C, Kato H, Takahashi K, Torii Y, Takeshita F, Ludwig H, Sutter G, Suzuki K, Hemmi H, Sato S, Yamamoto M, Uematsu S, Kawai T, Takeuchi O, Akira S (2006) A Toll‐like receptor‐independent antiviral response induced by double‐stranded B‐form DNA. Nat Immunol 7: 40–48 [DOI] [PubMed] [Google Scholar]
- Ishikawa H, Ma Z, Barber GN (2009) STING regulates intracellular DNA‐mediated, type I interferon‐dependent innate immunity. Nature 461: 788–792 [DOI] [PMC free article] [PubMed] [Google Scholar]
- Kirkin V, Lamark T, Sou YS, Bjorkoy G, Nunn JL, Bruun JA, Shvets E, McEwan DG, Clausen TH, Wild P, Bilusic I, Theurillat JP, Overvatn A, Ishii T, Elazar Z, Komatsu M, Dikic I, Johansen T (2009) A role for NBR1 in autophagosomal degradation of ubiquitinated substrates. Mol Cell 33: 505–516 [DOI] [PubMed] [Google Scholar]
- Klionsky DJ, Abdelmohsen K, Abe A, Abedin MJ, Abeliovich H, Acevedo AA, Adachi H, Adams CM, Adams PD, Adeli K, Adhihetty PJ, Adler SG, Agam G, Agarwal R, Aghi MK, Agnello M, Agostinis P, Aguilar PV, Aguirre‐Ghiso J, Airoldi EM et al (2016) Guidelines for the use and interpretation of assays for monitoring autophagy (3rd edition). Autophagy 12: 1–222 [DOI] [PMC free article] [PubMed] [Google Scholar]
- Konno H, Konno K, Barber GN (2013) Cyclic dinucleotides trigger ULK1 (ATG1) phosphorylation of STING to prevent sustained innate immune signaling. Cell 155: 688–698 [DOI] [PMC free article] [PubMed] [Google Scholar]
- Kotas ME, Medzhitov R (2015) Homeostasis, inflammation, and disease susceptibility. Cell 160: 816–827 [DOI] [PMC free article] [PubMed] [Google Scholar]
- Levine B, Mizushima N, Virgin HW (2011) Autophagy in immunity and inflammation. Nature 469: 323–335 [DOI] [PMC free article] [PubMed] [Google Scholar]
- Li XD, Wu J, Gao D, Wang H, Sun L, Chen ZJ (2013) Pivotal roles of cGAS‐cGAMP signaling in antiviral defense and immune adjuvant effects. Science 341: 1390–1394 [DOI] [PMC free article] [PubMed] [Google Scholar]
- Liang Q, Fu B, Wu F, Li X, Yuan Y, Zhu F (2012) ORF45 of Kaposi's sarcoma‐associated herpesvirus inhibits phosphorylation of interferon regulatory factor 7 by IKKepsilon and TBK1 as an alternative substrate. J Virol 86: 10162–10172 [DOI] [PMC free article] [PubMed] [Google Scholar]
- Liang Q, Seo GJ, Choi YJ, Kwak MJ, Ge J, Rodgers MA, Shi M, Leslie BJ, Hopfner KP, Ha T, Oh BH, Jung JU (2014) Crosstalk between the cGAS DNA sensor and Beclin‐1 autophagy protein shapes innate antimicrobial immune responses. Cell Host Microbe 15: 228–238 [DOI] [PMC free article] [PubMed] [Google Scholar]
- Liew FY, Xu D, Brint EK, O'Neill LA (2005) Negative regulation of toll‐like receptor‐mediated immune responses. Nat Rev Immunol 5: 446–458 [DOI] [PubMed] [Google Scholar]
- Liu Y, Jesus AA, Marrero B, Yang D, Ramsey SE, Montealegre Sanchez GA, Tenbrock K, Wittkowski H, Jones OY, Kuehn HS, Lee CC, DiMattia MA, Cowen EW, Gonzalez B, Palmer I, DiGiovanna JJ, Biancotto A, Kim H, Tsai WL, Trier AM et al (2014) Activated STING in a vascular and pulmonary syndrome. N Engl J Med 371: 507–518 [DOI] [PMC free article] [PubMed] [Google Scholar]
- Liu S, Cai X, Wu J, Cong Q, Chen X, Li T, Du F, Ren J, Wu Y, Grishin N, Chen ZJ (2015) Phosphorylation of innate immune adaptor proteins MAVS, STING, and TRIF induces IRF3 activation. Science 347: aaa2630 [DOI] [PubMed] [Google Scholar]
- Monroe KM, Yang Z, Johnson JR, Geng X, Doitsh G, Krogan NJ, Greene WC (2014) IFI16 DNA sensor is required for death of lymphoid CD4 T cells abortively infected with HIV. Science 343: 428–432 [DOI] [PMC free article] [PubMed] [Google Scholar]
- Moretti J, Roy S, Bozec D, Martinez J, Chapman JR, Ueberheide B, Lamming DW, Chen ZJ, Horng T, Yeretssian G, Green DR, Blander JM (2017) STING senses microbial viability to orchestrate stress‐mediated autophagy of the endoplasmic reticulum. Cell 171: 809–823 [DOI] [PMC free article] [PubMed] [Google Scholar]
- Ni G, Konno H, Barber GN (2017) Ubiquitination of STING at lysine 224 controls IRF3 activation. Sci Immunol 2: eaah7119 [DOI] [PMC free article] [PubMed] [Google Scholar]
- Nyengaard JR (1999) Stereologic methods and their application in kidney research. J Am Soc Nephrol 10: 1100–1123 [DOI] [PubMed] [Google Scholar]
- Orvedahl A, MacPherson S, Sumpter R Jr, Talloczy Z, Zou Z, Levine B (2010) Autophagy protects against Sindbis virus infection of the central nervous system. Cell Host Microbe 7: 115–127 [DOI] [PMC free article] [PubMed] [Google Scholar]
- Paludan SR, Bowie AG (2013) Immune sensing of DNA. Immunity 38: 870–880 [DOI] [PMC free article] [PubMed] [Google Scholar]
- Paludan SR (2015) Activation and regulation of DNA‐driven immune responses. Microbiol Mol Biol Rev 79: 225–241 [DOI] [PMC free article] [PubMed] [Google Scholar]
- Patel JR, Garcia‐Sastre A (2014) Activation and regulation of pathogen sensor RIG‐I. Cytokine Growth Factor Rev 25: 513–523 [DOI] [PubMed] [Google Scholar]
- Pilli M, Arko‐Mensah J, Ponpuak M, Roberts E, Master S, Mandell MA, Dupont N, Ornatowski W, Jiang S, Bradfute SB, Bruun JA, Hansen TE, Johansen T, Deretic V (2012) TBK‐1 promotes autophagy‐mediated antimicrobial defense by controlling autophagosome maturation. Immunity 37: 223–234 [DOI] [PMC free article] [PubMed] [Google Scholar]
- Qin Y, Zhou MT, Hu MM, Hu YH, Zhang J, Guo L, Zhong B, Shu HB (2014) RNF26 temporally regulates virus‐triggered type I interferon induction by two distinct mechanisms. PLoS Pathog 10: e1004358 [DOI] [PMC free article] [PubMed] [Google Scholar]
- Reinert LS, Lopusna K, Winther H, Sun C, Thomsen MK, Nandakumar R, Mogensen TH, Meyer M, Vægter CB, Nyengaard JR, Fitzgerald KA, Paludan SR (2016) Sensing of HSV‐1 by the cGAS‐STING pathway in microglia orchestrates antiviral defense in the CNS. Nat Commun 7: 13348 [DOI] [PMC free article] [PubMed] [Google Scholar]
- Richter B, Sliter DA, Herhaus L, Stolz A, Wang C, Beli P, Zaffagnini G, Wild P, Martens S, Wagner SA, Youle RJ, Dikic I (2016) Phosphorylation of OPTN by TBK1 enhances its binding to Ub chains and promotes selective autophagy of damaged mitochondria. Proc Natl Acad Sci USA 113: 4039–4044 [DOI] [PMC free article] [PubMed] [Google Scholar]
- Saitoh T, Fujita N, Hayashi T, Takahara K, Satoh T, Lee H, Matsunaga K, Kageyama S, Omori H, Noda T, Yamamoto N, Kawai T, Ishii K, Takeuchi O, Yoshimori T, Akira S (2009) Atg9a controls dsDNA‐driven dynamic translocation of STING and the innate immune response. Proc Natl Acad Sci USA 106: 20842–20846 [DOI] [PMC free article] [PubMed] [Google Scholar]
- Schoggins JW, Macduff DA, Imanaka N, Gainey MD, Shrestha B, Eitson JL, Mar KB, Richardson RB, Ratushny AV, Litvak V, Dabelic R, Manicassamy B, Aitchison JD, Aderem A, Elliott RM, Garcia‐Sastre A, Racaniello V, Snijder EJ, Yokoyama WM, Diamond MS et al (2013) Pan‐viral specificity of IFN‐induced genes reveals new roles for cGAS in innate immunity. Nature 505: 691–695 [DOI] [PMC free article] [PubMed] [Google Scholar]
- Shi CS, Shenderov K, Huang NN, Kabat J, Abu‐Asab M, Fitzgerald KA, Sher A, Kehrl JH (2012) Activation of autophagy by inflammatory signals limits IL‐1beta production by targeting ubiquitinated inflammasomes for destruction. Nat Immunol 13: 255–263 [DOI] [PMC free article] [PubMed] [Google Scholar]
- Starr R, Willson TA, Viney EM, Murray LJ, Rayner JR, Jenkins BJ, Gonda TJ, Alexander WS, Metcalf D, Nicola NA, Hilton DJ (1997) A family of cytokine‐inducible inhibitors of signalling. Nature 387: 917–921 [DOI] [PubMed] [Google Scholar]
- Stetson DB, Ko JS, Heidmann T, Medzhitov R (2008) Trex1 prevents cell‐intrinsic initiation of autoimmunity. Cell 134: 587–598 [DOI] [PMC free article] [PubMed] [Google Scholar]
- Sun L, Wu J, Du F, Chen X, Chen ZJ (2013) Cyclic GMP‐AMP synthase is a cytosolic DNA sensor that activates the type I interferon pathway. Science 339: 786–791 [DOI] [PMC free article] [PubMed] [Google Scholar]
- Tanaka Y, Chen ZJ (2012) STING specifies IRF3 phosphorylation by TBK1 in the cytosolic DNA signaling pathway. Sci Signal 5: ra20 [DOI] [PMC free article] [PubMed] [Google Scholar]
- Teijaro JR, Ng C, Lee AM, Sullivan BM, Sheehan KC, Welch M, Schreiber RD, de la Torre JC, Oldstone MB (2013) Persistent LCMV infection is controlled by blockade of type I interferon signaling. Science 340: 207–211 [DOI] [PMC free article] [PubMed] [Google Scholar]
- Thurston TL, Ryzhakov G, Bloor S, von Muhlinen N, Randow F (2009) The TBK1 adaptor and autophagy receptor NDP52 restricts the proliferation of ubiquitin‐coated bacteria. Nat Immunol 10: 1215–1221 [DOI] [PubMed] [Google Scholar]
- Tsuchida T, Zou JA, Saitoh T, Kumar H, Abe T, Matsuura Y, Kawai T, Akira S (2010) The ubiquitin ligase TRIM56 regulates innate immune responses to intracellular double‐stranded DNA. Immunity 33: 765–776 [DOI] [PubMed] [Google Scholar]
- Unterholzner L, Keating SE, Baran M, Horan KA, Jensen SB, Sharma S, Sirois C, Jin T, Xiao T, Fitzgerald P, Paludan SR, Bowie AG (2010) IFI16 is an innate immune sensor for intracellular DNA. Nat Immunol 11: 997–1004 [DOI] [PMC free article] [PubMed] [Google Scholar]
- Wang Q, Liu X, Cui Y, Tang Y, Chen W, Li S, Yu H, Pan Y, Wang C (2014) The E3 ubiquitin ligase AMFR and INSIG1 bridge the activation of TBK1 kinase by modifying the adaptor STING. Immunity 41: 919–933 [DOI] [PubMed] [Google Scholar]
- Wang Y, Lian Q, Yang B, Yan S, Zhou H, He L, Lin G, Lian Z, Jiang Z, Sun B (2015) TRIM30alpha is a negative‐feedback regulator of the intracellular DNA and DNA virus‐triggered response by targeting STING. PLoS Pathog 11: e1005012 [DOI] [PMC free article] [PubMed] [Google Scholar]
- Watson RO, Manzanillo PS, Cox JS (2012) Extracellular M. tuberculosis DNA targets bacteria for autophagy by activating the host DNA‐sensing pathway. Cell 150: 803–815 [DOI] [PMC free article] [PubMed] [Google Scholar]
- Watson RO, Bell SL, Macduff DA, Kimmey JM, Diner EJ, Olivas J, Vance RE, Stallings CL, Virgin HW, Cox JS (2015) The cytosolic sensor cGAS detects Mycobacterium tuberculosis DNA to induce type I interferons and activate autophagy. Cell Host Microbe 17: 811–819 [DOI] [PMC free article] [PubMed] [Google Scholar]
- Wild P, Farhan H, McEwan DG, Wagner S, Rogov VV, Brady NR, Richter B, Korac J, Waidmann O, Choudhary C, Dotsch V, Bumann D, Dikic I (2011) Phosphorylation of the autophagy receptor optineurin restricts Salmonella growth. Science 333: 228–233 [DOI] [PMC free article] [PubMed] [Google Scholar]
- Woo SR, Fuertes MB, Corrales L, Spranger S, Furdyna MJ, Leung MY, Duggan R, Wang Y, Barber GN, Fitzgerald KA, Alegre ML, Gajewski TF (2014) STING‐dependent cytosolic DNA sensing mediates innate immune recognition of immunogenic tumors. Immunity 41: 830–842 [DOI] [PMC free article] [PubMed] [Google Scholar]
- Zhang J, Hu MM, Wang YY, Shu HB (2012) TRIM32 protein modulates type I interferon induction and cellular antiviral response by targeting MITA/STING protein for K63‐linked ubiquitination. J Biol Chem 287: 28646–28655 [DOI] [PMC free article] [PubMed] [Google Scholar]
- Zhong B, Zhang L, Lei C, Li Y, Mao AP, Yang Y, Wang YY, Zhang XL, Shu HB (2009) The ubiquitin ligase RNF5 regulates antiviral responses by mediating degradation of the adaptor protein MITA. Immunity 30: 397–407 [DOI] [PubMed] [Google Scholar]
Associated Data
This section collects any data citations, data availability statements, or supplementary materials included in this article.
Supplementary Materials
Appendix
Expanded View Figures PDF
Movie EV1
Review Process File