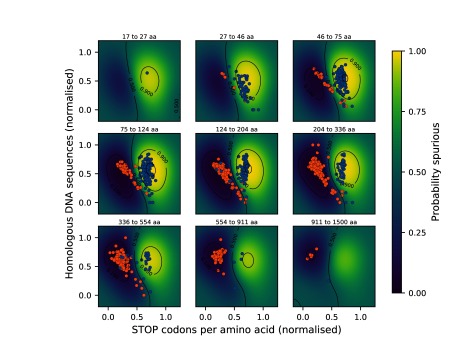
Figure 3. A Gaussian process classifier is used to assign probability scores to sequences, describing their likelihood to be spurious.
Sequences classified as spurious are coloured blue and non-spurious proteins are coloured orange. The classification is performed in three dimensions. Shown above are cross-sections along the sequence length dimension. 500 test data samples are projected to the nearest layer in this plot. 8-fold cross validation suggests a mean prediction accuracy of 96.8%.

