Abstract
Introduction:
The aim of this study is to compare three different echocardiographic methods commonly used in the assessment of left ventricle (LV) ejection fraction (EF).
Methods:
All patients underwent full echocardiography including LVEF assessed using M-mode, automated EF (Auto-EF), and visual estimation by two readers.
Results:
We enrolled 268 patients. Auto-EF measurement was feasible in 240 (89.5%) patients. The averaged LVEF was (52% ± 12) with the visual assessment, (51% ± 11) with Auto-EF and (57% ± 13) with M-mode. Using Bland-Altman analysis, we found that the difference between the mean visual and the Auto-EF was not significant (−0.3% [−0.5803–0.0053], P = 0.054). However, the mean EF was significantly different when comparing visual versus M-mode and Auto-EF versus M-mode with the mean differences: (−2.4365 [−2.9946–−1.8783], P < 0.0001) and (−2.1490 [−2.7348–−1.5631], P < 0.0001) respectively. Inter-observer variability analysis of the visual EF assessment between the two readers showed that intraclass correlation coefficient was 0.953, (95% confidence interval: 0.939–0.965, P < 0.0001), with excellent correlation between the two readers: R = 0.911, P < 0.0001).
Conclusion:
The two-dimensional echocardiographic methods using Biplane Auto-EF or visual assessment were significantly comparable, whereas M-mode results in an overestimation of the LVEF.
Key words: Auto-ejection fraction, ejection fraction, M-mode, tissue tracking, visual assessment
INTRODUCTION
Assessment of the left ventricular (LV) size and ejection fraction (EF) represents the most frequent indications for echocardiographic study. LVEF has an important prognostic and incremental diagnostic and therapeutic implications in most types of cardiovascular diseases.[1,2,3] There are multiple modalities for the measurement of LV volumes, and function, most commonly used is two-dimensional (2D) echocardiography-based approaches such as visual and automated biplane EF (Auto-EF), and the M-mode echocardiography modality.[4,5] Visual LVEF assessment is easy, fast, and commonly used during clinical practice, but it is more reader dependent and requires an expert physician.[6,7,8] On the other hand, Auto-EF assessment meanly depends on speckle tracking technology by tracing the endocardial border during systole and diastole. Where a dedicated software can define the end-systolic and end-diastolic frames. Auto-EF is considered as more robust, less operator dependent, and can provide rapid and reproducible assessment of LV performance.[2,9,10] The M-mode-based technique is the oldest but remain widely used for the assessment of LV dimensions and function. Although it is easy and can be performed by less experienced examiners, it has a significant interobserver and interlaboratory variations, and provides only information about contractility along a single slice of the LV, whereas, the contractility of the other segments can be missed.[11] However, Eyeball LVEF estimation expected to be utilized more often, due to the recent increase using of handheld echocardiography machines, where only a visual EF assessment is feasible.[12,13,14] We hypothesized that LVEF measurements by Auto-EF and M-mode are comparable to that measured by visual assessment.[15]
METHODS
Patients selection
Our study is a cross-sectional analysis conducted in two tertiary cardiac centers in Saudi Arabia in the period between May and October 2017. The study population consisted of 268 patients who underwent full echocardiographic examination. All patients were either referred from an outpatient clinic or during hospital admission. For the purpose of this study, basic demographic variables, clinical data were obtained. Patients with limited echocardiography windows, leading to a poor endocardial definition and those who have had atrial fibrillation during the exam were excluded from the study. The study protocol was approved by the Institutional Ethical Committee, and all patients signed an informed consent.
Echocardiographic examination
The echocardiography examinations were done by registered diagnostic medical sonographer with more than 5 years' experience, using the clinical imaging system (Vivid E95, General Electric Medical Systems, Waukesha, WI, USA) and 5-MHz transducer. Standard echocardiographic views (parasternal, apical and substernal) were obtained. All images were reviewed to confirm that parasternal long axis (PSLA), four-chamber (4-CH), and two-chamber (2-CH) views had been acquired with at least three complete cardiac cycles. All the recorded views were reviewed to select the most suitable with less heart rate variability.
Visual assessment of left ventricle ejection fraction
The left ventricular function was visually assessed by 2 expert readers (more than 5 years' experience). LVEF was evaluated using three different orthogonal planes including the parasternal and apical views; the two LVEF readings were averaged. A third blinded assessment of LVEF was obtained if more than 5% difference between the first two readings, then averaged LVEF will be calculated as the mean of the three readings.
M-mode ejection fraction assessment
LVEF Based-M-mode evaluated using PSLA view by setting the M-mode cursor immediately distal to the mitral valve leaflets, and perpendicular to the LV longitudinal axis. Then LV dimensions and LVEF will be measured.
Auto-ejection fraction assessment
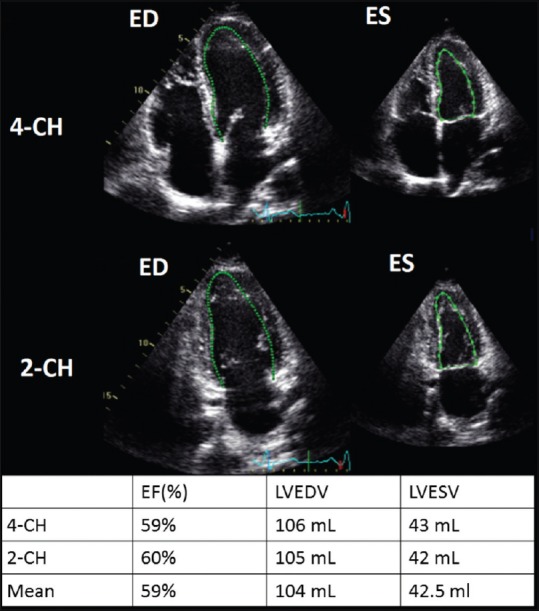
A commercially available software that enables detection of the endocardial boundary at end-systole and-diastole using the speckle tracking technique was used. Then, LV volumes and LVEF will be calculated by summation of end-systolic and end-diastolic LV stacks that obtained from apical 2-CH and 4-CH views [Figure 1]. Sonographers can manually correct the internal LV border in case of the wrong delineation by the software. Auto-EF was defined as the mean LVEF recorded from the two apical views.
Figure 1.

Automated assessment of left ventricle ejection fraction and volumes. The Endocardial borders are automatically tracked at end-diastole (on the left) and end-systole (on the right) using apical four chamber view (top) and apical two chamber view (middle). The measurements of left ventricle ejection fraction and volumes were displayed (bottom)
Statistical analysis
Quantitative variables are expressed as means ± standard deviations, and categorical variables are expressed as frequencies or percentages. Linear regression was performed for correlation analysis between different LVEF that measured visually, Auto-EF, and by M-mode. Inter-observer variability between readers of the visual LVEF was measured. Finally, Bland–Altman analysis was used to assess the agreement between the different echocardiographic modalities. P < 0.05 is considered statistically significant for all tests. All statistical analyses were performed using SPSS for Windows (Version 20.0 SPSS Inc., Chicago, IL, USA).
RESULTS
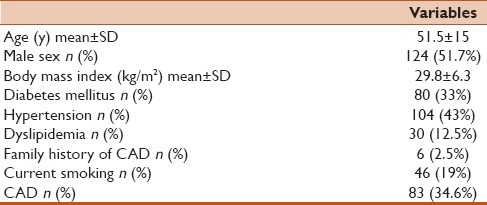
The mean age was 51.5 ± 15 years and men were 124 (51.7%). The other baseline characteristics are shown in Table 1.
Table 1.
Baseline characteristics

The mean left ventricle ejection fraction
We enrolled 268 patients in this study. Auto-EF measurement was feasible in 240 (89.5%) patients. The averaged LVEF was (52%±12) with the visual assessment, (51%±11) using the Auto-EF and (57%±13) using M-mode modality.
Reproducibility of visual ejection fraction
We analyzed the inter-observer variability of the visual EF assessment between the two readers and we found that intraclass correlation coefficient was 0.953 (95% confidence interval: 0.939–0.965, P < 0.0001) and excellent correlation between the readers: R = 0.911, P < 0.0001.
Comparison between the different methods of left ventricle ejection fraction measurement
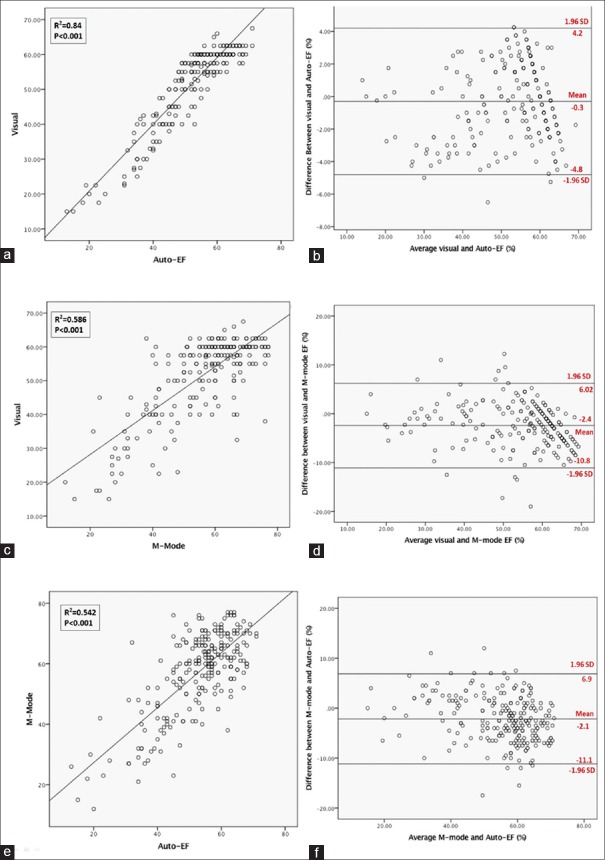
Using Bland–Altman analysis, we found that the difference between the mean visual EF and the Auto-EF group was −0.3% (−0.5803–0.0053), that was not statistically significant (P = 0.054) [Figure 2]. However, We found that the mean EF was significantly different when comparing visual versus M-mode and Auto-EF versus M-mode with the mean differences: −2.4365 (−2.9946–−1.8783, P < 0.0001) and −2.1490 (−2.7348–−1.5631, P < 0.0001) respectively, [Figure 2].
Figure 2.
Correlations and Bland-Altman plots between different methods. Correlation plots at the left and Bland-Altman plots at the right. (a and b) Between: Visual and Auto-ejection fraction assessment. (c and d) Visual and M-mode ejection fraction assessment. (e and f) the Auto-ejection fraction and M-mode assessment of ejection fraction
Regression analysis
We found an excellent correlations between Visual EF and Auto-EF measurement (r = 0.917, P < 0.001), visual and M-mode (r = 0.766, P < 0.0001); and between the Auto-EF and M-mode (r = 0.736, P < 0.0001) [Figure 2].
DISCUSSION
In the present study, we analyzed three different echocardiographic modalities that were commonly used in the evaluation of LVEF. We found that visual assessment of LV function is comparable to automated biplane technique. Moreover, we found that M-mode can lead to overestimation of the LVEF when compared to the other techniques. However, the three modalities are highly correlated.
EF is one of the most important indicators in the diagnosis and management plan of patients with heart diseases, in particular, heart failure.[16,17,18] Although 3D echocardiography is the gold standard ultrasonic imaging method for the evaluation of LV volume and function, 2D echocardiography-based modalities remain the most common technique used during clinical practice.
Auto-EF is considered as a highly accurate modality in the evaluation of LV function; it depends on tissue tracking technique by tracing the myocardial borders during systole and diastole. However, only 85% of patients are feasible to this modality and require a particular echocardiographic settings such as adjusting the image contrast and the frame rate.[5]
Multiple reports compared between the different echocardiographic modalities in the assessment of LV function. Shahgaldi et al.[4] found similar results of our study in that visual EF estimation using either a 2D or triplane echocardiography is comparable with the quantitative real-time 3D imaging. Similarly, Frederiksen et al.[5] showed that LVEF measured by Auto-EF did not differ from eyeballing, but it was lower than that measured by semi-automated methods. Furthermore, Cannesson et al.,[19] found that Auto-EF is well correlated with both eyeballing and semi-automated methods in the evaluation of LV function. Contrasting results were reported by Knackstedt et al.[20] The intraobserver variability of visual EF estimation was high, and has a nonsignificant correlation with Auto-EF.
In the present study, we found that visual assessment and Auto-EF are comparable; however, the latter has an advantage through quantitative estimation of LV size and dimensions.
The results of our study have multiple clinical implications, especially when using the handheld echocardiography machines that only enable the visual assessment of LVEF, due to lacking advanced technologies such as tissue tracking imaging. Furthermore, during the cardiac risk evaluation before an emergency noncardiac surgery, when a fast diagnosis is necessary, the eyeball evaluation of LVEF can readily provide an accurate assessment as Auto-EF.
Our study has some limitations in the present analysis; no gold standard method was used as a reference such as the 3D echocardiography. Patients with AF or significant arrhythmia were excluded, so our result cannot be generalized to this group of patients. Our visual EF was not compared with that of handheld echocardiography machines.
CONCLUSION
When performed by expert readers, visual assessment of the LVEF has low interobserver variability and well correlated with biplane Auto-EF method. On the other hand, M-mode assessment results in overestimation of the LVEF and hence can be used as a complementary tool for the evaluation of LV function and diameter.
Financial support and sponsorship
Nil.
Conflicts of interest
There are no conflicts of interest.
REFERENCES
- 1.Wong M, Johnson G, Shabetai R, Hughes V, Bhat G, Lopez B, et al. Echocardiographic variables as prognostic indicators and therapeutic monitors in chronic congestive heart failure. Veterans Affairs cooperative studies V-HeFT I and II. V-HeFT VA Cooperative Studies Group. Circulation. 1993;87:VI65–70. [PubMed] [Google Scholar]
- 2.Barbosa D, Heyde B, Dietenbeck T, Houle H, Friboulet D, Bernard O, et al. Quantification of left ventricular volume and global function using a fast automated segmentation tool: Validation in a clinical setting. Int J Cardiovasc Imaging. 2013;29:309–16. doi: 10.1007/s10554-012-0103-8. [DOI] [PubMed] [Google Scholar]
- 3.Lang RM, Badano LP, Mor-Avi V, Afilalo J, Armstrong A, Ernande L, et al. Recommendations for cardiac chamber quantification by echocardiography in adults: An update from the American Society of Echocardiography and the European Association of Cardiovascular Imaging. J Am Soc Echocardiogr. 2015;28:1–39.e14. doi: 10.1016/j.echo.2014.10.003. [DOI] [PubMed] [Google Scholar]
- 4.Shahgaldi K, Gudmundsson P, Manouras A, Brodin LA, Winter R. Visually estimated ejection fraction by two dimensional and triplane echocardiography is closely correlated with quantitative ejection fraction by real-time three dimensional echocardiography. Cardiovasc Ultrasound. 2009;7:41. doi: 10.1186/1476-7120-7-41. [DOI] [PMC free article] [PubMed] [Google Scholar]
- 5.Frederiksen CA, Juhl-Olsen P, Hermansen JF, Andersen NH, Sloth E. Clinical utility of semi-automated estimation of ejection fraction at the point-of-care. Heart Lung Vessel. 2015;7:208–16. [PMC free article] [PubMed] [Google Scholar]
- 6.Akinboboye O, Sumner J, Gopal A, King D, Shen Z, Bardfeld P, et al. Visual estimation of ejection fraction by two-dimensional echocardiography: The learning curve. Clin Cardiol. 1995;18:726–9. doi: 10.1002/clc.4960181208. [DOI] [PubMed] [Google Scholar]
- 7.Lavine SJ, Salacata A. Visual quantitative estimation: Semiquantitative wall motion scoring and determination of ejection fraction. Echocardiography. 2003;20:401–10. doi: 10.1046/j.1540-8175.2003.03079.x. [DOI] [PubMed] [Google Scholar]
- 8.Thavendiranathan P, Popović ZB, Flamm SD, Dahiya A, Grimm RA, Marwick TH, et al. Improved interobserver variability and accuracy of echocardiographic visual left ventricular ejection fraction assessment through a self-directed learning program using cardiac magnetic resonance images. J Am Soc Echocardiogr. 2013;26:1267–73. doi: 10.1016/j.echo.2013.07.017. [DOI] [PubMed] [Google Scholar]
- 9.Gudmundsson P, Rydberg E, Winter R, Willenheimer R. Visually estimated left ventricular ejection fraction by echocardiography is closely correlated with formal quantitative methods. Int J Cardiol. 2005;101:209–12. doi: 10.1016/j.ijcard.2004.03.027. [DOI] [PubMed] [Google Scholar]
- 10.Rahmouni HW, Ky B, Plappert T, Duffy K, Wiegers SE, Ferrari VA, et al. Clinical utility of automated assessment of left ventricular ejection fraction using artificial intelligence-assisted border detection. Am Heart J. 2008;155:562–70. doi: 10.1016/j.ahj.2007.11.002. [DOI] [PubMed] [Google Scholar]
- 11.Sahn DJ, DeMaria A, Kisslo J, Weyman A. Recommendations regarding quantitation in M-mode echocardiography: Results of a survey of echocardiographic measurements. Circulation. 1978;58:1072–83. doi: 10.1161/01.cir.58.6.1072. [DOI] [PubMed] [Google Scholar]
- 12.Prinz C, Voigt JU. Diagnostic accuracy of a hand-held ultrasound scanner in routine patients referred for echocardiography. J Am Soc Echocardiogr. 2011;24:111–6. doi: 10.1016/j.echo.2010.10.017. [DOI] [PubMed] [Google Scholar]
- 13.Cardim N, Fernandez Golfin C, Ferreira D, Aubele A, Toste J, Cobos MA, et al. Usefulness of a new miniaturized echocardiographic system in outpatient cardiology consultations as an extension of physical examination. J Am Soc Echocardiogr. 2011;24:117–24. doi: 10.1016/j.echo.2010.09.017. [DOI] [PubMed] [Google Scholar]
- 14.Kimura BJ, Gilcrease GW, 3rd, Showalter BK, Phan JN, Wolfson T. Diagnostic performance of a pocket-sized ultrasound device for quick-look cardiac imaging. Am J Emerg Med. 2012;30:32–6. doi: 10.1016/j.ajem.2010.07.024. [DOI] [PubMed] [Google Scholar]
- 15.Costa JA, Almeida ML, Estrada TC, Werneck GL, Rocha AM, Rosa ML, et al. Utility of ultraportable echocardiography in the preoperative evaluation of noncardiac surgery. Arq Bras Cardiol. 2016;107:420–6. doi: 10.5935/abc.20160169. [DOI] [PMC free article] [PubMed] [Google Scholar]
- 16.Hunt SA, Abraham WT, Chin MH, Feldman AM, Francis GS, Ganiats TG, et al. ACC/AHA 2005 guideline update for the diagnosis and management of chronic heart failure in the adult: A report of the American College of Cardiology/American Heart Association task force on practice guidelines (Writing committee to update the 2001 guidelines for the evaluation and management of heart failure): Developed in collaboration with the American College of Chest Physicians and the International Society for Heart and Lung Transplantation: Endorsed by the Heart Rhythm society. Circulation. 2005;112:e154–235. doi: 10.1161/CIRCULATIONAHA.105.167586. [DOI] [PubMed] [Google Scholar]
- 17.Aaronson KD, Schwartz JS, Chen TM, Wong KL, Goin JE, Mancini DM, et al. Development and prospective validation of a clinical index to predict survival in ambulatory patients referred for cardiac transplant evaluation. Circulation. 1997;95:2660–7. doi: 10.1161/01.cir.95.12.2660. [DOI] [PubMed] [Google Scholar]
- 18.Curtis JP, Sokol SI, Wang Y, Rathore SS, Ko DT, Jadbabaie F, et al. The association of left ventricular ejection fraction, mortality, and cause of death in stable outpatients with heart failure. J Am Coll Cardiol. 2003;42:736–42. doi: 10.1016/s0735-1097(03)00789-7. [DOI] [PubMed] [Google Scholar]
- 19.Cannesson M, Tanabe M, Suffoletto MS, McNamara DM, Madan S, Lacomis JM, et al. Anovel two-dimensional echocardiographic image analysis system using artificial intelligence-learned pattern recognition for rapid automated ejection fraction. J Am Coll Cardiol. 2007;49:217–26. doi: 10.1016/j.jacc.2006.08.045. [DOI] [PubMed] [Google Scholar]
- 20.Knackstedt C, Bekkers SC, Schummers G, Schreckenberg M, Muraru D, Badano LP, et al. Fully automated versus standard tracking of left ventricular ejection fraction and longitudinal strain: The FAST-EFs multicenter study. J Am Coll Cardiol. 2015;66:1456–66. doi: 10.1016/j.jacc.2015.07.052. [DOI] [PubMed] [Google Scholar]


