

Abstract
Objective
This study was aimed at investigating the relationship between neuron-specific enolase (NSE) and components of metabolic syndrome (MS).
Design
Cross-sectional study.
Setting
Chinese health check-up population.
Participants
40 684 health check-up people were enrolled in this study from year 2014 to 2016.
Main outcome measures
OR and coefficient for MS.
Results
The percentage of abnormal NSE and MS was 26.85% and 8.85%, respectively. There were significant differences in sex, body mass index, drinking habit, triglycerides (TGs), high-density lipoprotein cholesterol (HDL-C), blood pressure and MS between low-NSE and high-NSE groups. In logistic regression analysis, elevated NSE was present in MS, higher body mass index, hypertriglyceridaemia, hypertension and low-HDL groups. Stepwise linear analysis showed a negative correlation between NSE and fasting blood glucose (FBG) (<6.0 mmol/L), and a positive correlation between NSE and TGs (<20 mmol/L), systolic blood pressure (75–200 mm Hg), HDL-C (0.75–2.50 mmol/L), diastolic blood pressure (<70 mm Hg) and FBG (6.00–20.00 mmol/L). Furthermore, MS was positively correlated with NSE within the range of 2.00–7.50 ng/mL, but had a negative correlation with NSE within the range of 7.50–23.00 ng/mL.
Conclusion
There are associations between NSE with MS and its components. The result suggests that NSE may be a potential predictor of MS. Further research could be conducted in discussing the potential mechanism involved.
Keywords: neuron specific enolase, metabolic syndrome, cross-sectional study
Strengths and limitations of this study.
There is no study about the relationship between neuron-specific enolase (NSE) and metabolic syndrome (MS); this study based on a large sample of population revealed that NSE and MS may probably have a causal relationship.
The health check-up population varies from the general population, so that the representativeness of this conclusion is limited.
This cross-sectional study was carried out in one hospital that might not consider the population in other settings.
Brain MRI was not performed to evaluate the degree of brain impairment; thus, the interpretation of the inherent association mechanism between NSE and MS is limited.
Introduction
Metabolic syndrome (MS) and its components are important factors in cerebrovascular diseases. The components of MS, such as overweight or obesity, hypertension, hyperlipidaemia and hyperglycaemia, are independently or jointly linked to the aetiology of atherosclerosis and stroke.1–7 It has been reported that the risks of atherosclerosis in MS population over 5–10 years were two times higher than those in non-MS population.8 People with MS have a higher prevalence of cerebral events, especially of non-fatal ischaemic stroke.9 This relationship has been confirmed by other studies.10–12
Neuron-specific enolase (NSE) is one of the isozymes of the enolase family. Two of the three subunits which constitute the enolase family form two types of dimers (αγ and γγ), which specifically exist in neurons.13 NSE is a tumour marker, especially in detecting small cell lung cancer.14 15 In 1997, Missler et al found a trend towards elevated levels of NSE in patients with stroke16; subsequently, number of studies revealed that serum NSE was elevated in patients with brain injury.17–20 It has been shown that NSE is more efficient when used in conjunction with other biomarkers in assessing the risk of cardiovascular disease and transient ischaemic attack.21 22 Thus, NSE is also considered as a sensitive marker for evaluating the severity of craniocerebral injury and prognosis of relevant diseases.23
However, there are no reports on the association between NSE and MS, although. Studies have demonstrated the relationship of MS with brain dysfunction, and the association between blood pressure (BP), blood glucose and NSE.24–27 If a predictive relationship exists between NSE and MS or its components, it will be of immense value in early diagnosis of the impairment of brain function by MS.
This current investigation is a cross-sectional study on a large health check-up population with the aim of exploring the relationship between NSE and MS and its components.
Methods
Patients
A health check-up population from the Physical Examination Center of the First Affiliated Hospital of Wannan Medical College, in Wuhu, China, was enrolled in this study from 2014 to 2016. Inclusion criteria: (1) age within the range 18–89 years; (2) evidence of having undergone tumour marker tests and (3) the absence of history of brain disease intervention. The exclusion criteria included: (1) the absence of available data on triglyceride (TG), fasting blood glucose (FBG), uric acid, high-density lipoprotein, blood urea nitrogen (BUN), glutamic–pyruvic transaminase, glutamic oxaloacetate, aminotransferase, NSE; (2) individuals with brain disease intervention, tumour or cancer, severe cardiovascular diseases or severe infections. A total of 40 684 subjects consisting 25 604 (62.93%) men and 15 080 (37.07%) women were enrolled in this cross-sectional study. Their mean age was 50.49±13.52 years. The study was conducted in compliance with Helsinki guidelines of the Helsinki Declaration of World Medical Association. Verbal informed consent was obtained from each participant before the investigation.
Questionnaire survey
A questionnaire was designed by clinical and epidemiological experts. It contained demographic and behavioural characteristics, history of diseases and operations, and body examinations. The demographic characteristics included sex, age, occupation, educational backgrounds, and so on. The behavioural characteristics included smoking (scored as 0=never smoking, 1=smoking occasionally and 2=smoking frequently) and drinking (scored as 0=never drinking, 1=drinking occasionally and 2=drinking frequently). The history of diseases and operations included the information of severe infections, cardiovascular diseases, major surgeries and tumour or cancer.
Physical examination
The physical examination included height, weight and BP. Subjects were assessed when barefooted by professional staff. They were required to have their eyes straight ahead and upper limbs put on both sides of the body in a natural pose; height data were acquired to the nearest 0.1 cm. The subjects maintained steady body positions during the body weight measurement and wore minimal clothing. Weight data were acquired to the nearest 0.1 kg. The body mass index (BMI) was calculated as: weight (kg)/square of height (m2). The BMI data were calculated to the nearest 0.01 kg/m2. BP was measured using a mercury sphygmomanometer, after the subjects rested for 5 min. Systolic blood pressure (SBP) and diastolic blood pressure (DBP) were measured.
Biochemical assays
A total of 5 mL venous blood from each subject was used for the measurement of biochemical indices. The specimens were collected from the participants after 12-hour fast and then centrifuged and stored at −70℃ until assayed. All specimens were assayed within 24 hours. The parameters assayed were TG, FBG, high-density lipoprotein cholesterol (HDL-C), BUN and NSE. The measurement of NSE concentrations was done with commercial ELISA kits (CanAg NSE EIA, Göteborg, Sweden). All biochemical assays were performed by laboratory technicians in the hospital.
Classification of participants/definitions
All participants were divided into subgroups according to BMI (≥25 kg/m2 group and <25 kg/m2 group) and NSE (≥12.5 ng/mL group and <12.5 ng/mL group).28 Hypertension was defined as SBP ≥140 mm Hg and/or DBP ≥90 mm Hg or under treatment with antihypertensive drugs. Hyperglycaemia was defined as FBG ≥6.1 mmol/L. Hypertriglyceridaemia was defined as TG ≥1.7 mmol/L. Low high-density lipoprotein referred to HDL-C <0.9 mmol/L in men, and HDL-C <1.0 mmol/L in women, while MS was defined according to the Chinese Diabetes Society (CDS) criteria.29
Statistical analysis
Characteristics of the population were illustrated by simple descriptive statistics; the data were expressed as mean ±SD for continuous variables or frequency (%) for categorical variables. The comparison of demographic characteristics and biochemical indices between ≥12.5 ng/mL and <12.5 ng/mL groups was done using χ2 test. Then, multivariable logistic regression model analysis was used to explore the relationship between MS and its components with NSE, and adjusted for possible confounding factors such as sex, age, drinking and BUN, to provide the OR and 95% CI values. Stepwise correlation analysis was used to explore the correlation between the components of MS and NSE. Before and after adjustment for sex, age, drinking and BUN, R package with mgcv and ggplot V.2.0 was used to explore the generalised smoothing splines between NSE and MS components. Linear regression was conducted to estimate the relationship between NSE and MS components with or without adjustment for potential confounders. Participants were divided into four groups by quartiles (<P25, P25–P50, P50–P75 and ≥P75) of NSE in each segment, and stepwise logistic regression was conducted to test the connection between NSE and MS. All tests were two-sided and statistical significance level was considered as ‘α=0.05’. Data management and all analyses were performed using R software program (V.3.0.0).
Patient and public involvement
No patients were involved in developing the questionnaire, the hypothesis and plans or implementation for this study. No patients were involved in the data analysis or the manuscript writing. And we did not plan to disseminate the results of this study to participants or some relevant people.
Results
Demographic characteristics and biochemical indices between NSE
The demographic characteristics and biochemical indices of the NSE subgroups are shown in table 1. The results show that 26.87% of the population had abnormal NSE level, and the prevalence of MS was 8.85%. In the MS group, NSE concentration was 9.47±6.07 ng/mL, and in non-MS group, the concentration was 9.06±5.83 ng/mL. There were significant differences in BMI, TG, HDL-C and BP between the two NSE groups. In addition, the two NSE groups differed significantly with respect to other baseline characteristics such as sex, drinking habit and BUN.
Table 1.
Comparison of the demographic characteristics and biochemical indices between NSE subgroups
| Variables | Total | <12.50 ng/mL | ≥12.50 ng/mL | χ2 | P values |
| Sex | |||||
| Female | 15 080 (37.07) | 11 555 (38.83) | 3525 (32.27) | 147.1634 | <0.0001 |
| Male | 25 604 (62.93) | 18 206 (61.17) | 7398 (67.73) | ||
| Age (years) | |||||
| <45 | 50.49±13.52 | 9879 (33.19) | 3603 (32.99) | 2.4862 | 0.2885 |
| 45– | 11 671 (39.22) | 4372 (40.03) | |||
| 59– | 8211 (27.59) | 2984 (26.99) | |||
| BMI (kg/m2) | |||||
| <25 | 23.98±3.23 | 20 223 (67.95) | 6868 (62.88) | 92.4951 | <0.0001 |
| ≥25 | 9538 (32.05) | 4055 (37.12) | |||
| Drinking* | |||||
| 0 | 24 606 (60.48) | 18 116 (64.76) | 6490 (62.61) | 134.8549 | <0.0001 |
| 1 | 3660 (9.00) | 2879 (10.29) | 781 (7.53) | ||
| 2 | 10 076 (24.77) | 6981 (24.95) | 3095 (29.86) | ||
| Smoking* | |||||
| 0 | 27 409 (67.37) | 20 015 (71.55) | 7394 (71.33) | 0.4157 | 0.8123 |
| 1 | 8934 (22.00) | 6514 (23.29) | 2420 (23.35) | ||
| 2 | 1998 (4.91) | 1446 (5.17) | 552 (5.33) | ||
| Low HDL-C (mmol/L) | |||||
| No | 38 137 (93.74) | 27 655 (92.92) | 10 482 (95.96) | 125.7493 | <0.0001 |
| Yes | 2547 (6.26) | 2106 (7.08) | 441 (4.04) | ||
| Hyperglycaemia | |||||
| No | 35 068 (86.20) | 25 669 (86.25) | 8323 (76.20) | 0.2758 | 0.5994 |
| Yes | 5616 (13.80) | 4092 (13.75) | 2600 (23.80) | ||
| Hypertension | |||||
| No | 32 216 (79.19) | 23 863 (80.18) | 8353 (76.47) | 66.7443 | <0.0001 |
| Yes | 8468 (20.81) | 5898 (19.82) | 2570 (23.53.) | ||
| Hypertriglycerid a emia | |||||
| No | 26 990 (66.34) | 20 152 (67.71) | 6838 (62.60) | 93.4716 | <0.0001 |
| Yes | 13 694 (33.66) | 9609 (32.29) | 4085 (37.40) | ||
| MS | |||||
| No | 36 286 (89.19) | 26 701 (89.72) | 9585 (87.75) | 32.08 | <0.0001 |
| Yes | 4398 (10.81) | 3060 (10.28) | 1338 (12.25) | ||
| BUN (mmol/L) | |||||
| <2.86 | 5.44±1.54 | 637 (2.14) | 248 (2.27) | 33.0906 | <0.0001 |
| 2.86– | 25 721 (86.43) | 9202 (84.24) | |||
| 7.14– | 3403 (11.43) | 1473 (13.49) | |||
| Total | |||||
| 40 684(100) | 29 761 (73.15) | 10 923 (26.85) |
*For drinking, 0=never drink, 1=drink occasionally, and 2=drink frequently; for smoking, 0=never smoke, 1=smoke occasionally and 2=smoke frequently. The figures in brackets are percentages.
BMI, body mass index; BUN, blood urea nitrogen; HDL-C, high-density lipoprotein cholesterol; MS, metabolic syndrome.
Relationship between components of MS and NSE
Variables which had significant differences in the two NSE groups were adjusted. Based on multiple logistic regression analysis, elevated NSE level was found in MS individuals. In stepwise linear analysis of the relationship between MS components and NSE, a positive relationship was found in BMI (β=0.0627, p<0.0001), TG (<20 mmol/L, β=0.2553, p<0.0001), SBP (75–200 mm Hg, β=0.0487, p<0.0001), DBP (<70 mm Hg, β=0.01846, p<0.0001; ≥70 mm Hg, β=0.0156, p<0.0001), HDL-C (0.75–1.25 mmol/L, β=8.4354, p<0.0001) and FBG (6.00–20.0 mmol/L, β=0.041, p=0.0353). However, a negative relationship was found in FBG (<6.00 mmol/L, β=−0.599, p<0.0001). These results are shown in table 2 and in figures 1 and 2.
Table 2.
Stepwise linear regression model of the relationship between metabolic syndrome (MS) components and neuron-specific enolase
| MS components | Unadjusted | Adjusted* | |||||
| β | SE | P values | β | SE | P values | ||
| BMI (kg/m2) | <25 | 0.1057 | 0.0188 | <0.0001 | 0.0627 | 0.0098 | <0.0001 |
| ≥25 | 0.0077 | 0.0257 | 0.7639 | ||||
| TG (mmol/L) | <20 | 0.3018 | 0.0224 | <0.0001 | 0.2553 | 0.0237 | <0.0001 |
| SBP (mm Hg) | 75–200 | 0.0417 | 0.0017 | <0.0001 | 0.0487 | 0.0019 | <0.0001 |
| DBP (mm Hg) | <80 | 0.0887 | 0.0083 | <0.0001 | 0.0294 | 0.6063 | <0.0001 |
| ≥80 | 0.0324 | 0.0062 | <0.0001 | 0.0734 | 0.0085 | <0.0001 | |
| HDL-C (mmol/L) | 0.75– | 7.5522 | 0.3982 | <0.0001 | 8.4354 | 0.4096 | <0.0001 |
| 1.25–2.50 | −0.2347 | 0.1393 | 0.0919 | 0.1196 | 0.1455 | 0.4111 | |
| FBG (mmol/L) | <6.00 | −0.5329 | 0.0704 | <0.0001 | −0.599 | 0.074 | <0.0001 |
| 6.00–20.00 | 0.1043 | 0.0388 | 0.0072 | 0.0937 | 0.0403 | 0.0202 | |
*Adjusted for sex, age, drink and blood urea nitrogen.
β stands for coefficient. BMI, body mass index; DBP, diastolic blood pressure; FBG, fasting blood glucose; HDL-C, high-density lipoprotein cholesterol; SBP, systolic blood pressure; TG, triglyceride.
Figure 1.

Multiple logistic regression analysis of the factors that influence neuron-specific enolase (NSE). Adjusted for sex, age, drink and blood urea nitrogen (BUN), the dependent variable was NSE, while the independent variable was metabolic syndrome (MS). The longitudinal coordinate represents potential factors that influence NSE, while the horizontal coordinate are ORs of NSE.
Figure 2.

Stepwise correlation analysis of neuron-specific enolase (NSE) and metabolic syndrome (MS) components. The horizontal coordinate represents different components of MS; the longitudinal coordinate shows residual of NSE. Solid line: without adjustment; dotted line: adjustment for sex, age, drink and blood urea nitrogen. (A) Correlation of body mass index (BMI) with NSE. (B) Correlation of triglyceride (TG) with NSE. (C) Correlation of systolic blood pressure (SBP) with NSE. (D) Correlation of diastolic blood pressure (DBP) with NSE. (E) Correlation of high-density lipoprotein cholesterol (HDL-C) with NSE. (F) Correlation of fasting blood glucose (FBG) with NSE.
After adjusting potential risk factors, the relationship between NSE and MS changed as a function of NSE concentration. Results from stepwise regression analysis revealed that OR <1 when NSE concentration ranges from 2.00 ng/mL to 7.50 ng/mL, indicating that NSE was negatively related to MS in this range. And OR >1 when NSE concentration ranges from 7.50 ng/mL to 23.00 ng/mL, indicating that NSE was positively related to MS (figures 3 and 4).
Figure 3.

Stepwise logistic regression analysis between neuron-specific enolase (NSE) and metabolic syndrome (MS). Adjusted for sex, age and smoke. The longitudinal coordinate represents quartile segments of NSE; the horizontal coordinate is OR of MS.
Figure 4.
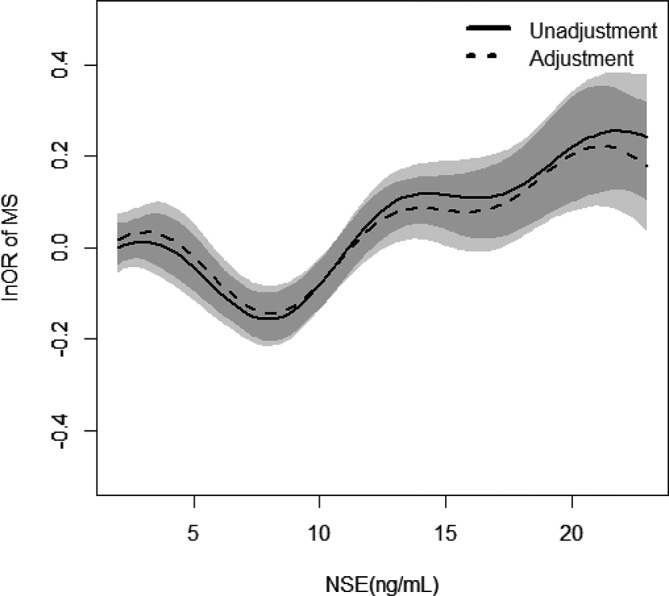
Relationship between neuron-specific enolase (NSE) and metabolic syndrome (MS) and their 95% CIs (shade scope). The horizontal coordinate represents NSE; the longitudinal coordinate is lnOR. Solid line: without adjustment; dotted line: adjustment for sex, age, drink and blood urea nitrogen.
Discussion
The findings of this research show differences in NSE concentration between MS and non-MS population. Moreover, there were correlations between MS components and NSE. The effect of MS on brain can be reflected by changes in the concentration of NSE. In the absence of serious lesion, NSE is retained in the nerve cell because there is no cellular damage. Thus, NSE would not be detectable in peripheral blood.30 Therefore, NSE and MS components showed a certain association only in a limited range.
After adjusting a number of factors, there was weak correlation between BMI and NSE. In a previous study, Samanc et al reported that there was no correlation between BMI and NSE.25 The difference between their findings and the findings in the present study might be partly ascribed to differences in sample size. In addition, the mean age of people enrolled in this study was 50.49±13.52 years, while in the study by Samanc et al, the mean ages of idiopathic intracranial hypertension and control groups were 35.40±9.85 and 37.10±9.65 years, respectively.
In this study, NSE was positively associated with risk of elevated TG. This is in agreement with the findings of Lindenstrom et al who reported that plasma TG was positively associated with ischaemic stroke.31 Similar results were obtained by other workers.32 33 However, there are some reports indicating no association between NSE and TGs at all.34 35 Thus, from the viewpoint of previous research, the correlation between TG and stroke or ischaemic stroke was controversial, partly due to differences in blood samples used, some collected the non-fasting blood samples,30 32 while others used fasting blood samples.34 35 In the present research, TG levels were assessed on fasting blood samples, and serum NSE level was measured to evaluate brain injury. Elevated serum NSE has been shown to be related to the volume of brain infarction tissue.36 Differences in the degrees of stroke impairment might be responsible for the disparities in the results from different studies. In addition, the criteria of abnormal TG used also varied. Therefore, more precise and rigorous investigations are required.
HDL-C showed a positive association with NSE at a range of 0.75–2.50 mmol/L, which indicated that HDL-C was positively associated with NSE in the normal range of HDL-C. Serum NSE levels could reflect impairment due to cerebral infarction.20 This finding is inconsistent with the popular view that HDL-C level is a protective factor against stoke.37 Indeed, it has been found that HDL-C is related to an increased risk factor of stroke in women.38 However, in this study, the number of female participants was smaller than the number of males enrolled. This association between NSE and HDL-C has not been reported before. Several aspects of this phenomenon should be considered. Maybe in the other studies, emphasis was on the stoke events, while in the present study, NSE was used as a marker of brain damage (including stroke and other brain diseases). Some unknown mechanism may exist, which need to be discussed in the future. Another possible explanation could be that the relationship between cardiovascular disease and HDL-C affects the association between cerebrovascular diseases.38
Hypertension is associated with cerebrovascular diseases; patients who had hypertension were more susceptible to cerebrovascular diseases.39–41 In this study, there was a positive correlation between SBP/DBP and NSE, when SBP ranges from 75 mm Hg to 200 mm Hg, and DBP <70 mm Hg, which is in agreement with the results of González-Quevedo et al 27 42 had done. In addition, a study on the Atherosclerosis Risk in Communities found that high BP was the most important risk factor for all subtypes of stroke. It was explained that hypertension was associated with white matter lesions, which caused elevations in NSE levels.27 42 43 However, the authors of the present study consider that hypertension might do harm to grey matter of the brain which is composed of a large number of neurons, and this damage might be reflected by changes in NSE.44 Since image inspection was not performed in this study, further imaging examination is required to identify this damage. The underlying mechanism remains to be studied. In other subgroups of SBP and DBP, the correlation was not valid because of the lack of adequate population.
FBG had a negative association with NSE<6.0 mmol/L. Low FBG leads to hypoglycaemia. Hypoglycaemia damages the brain because brain activity relies on the circulating glucose as its main energy source.45 46 Thus, NSE decreased with increasing FBG (FBG<6.0 mmol/L) in contrast to the positive association for FBG>6.0 mmol/L. It is well known that elevated FBG is one of the risk factors for cerebrovascular diseases.47 This is consistent with the results of the current study. The only difference was that different correlations were obtained for subgroups of FBG.
From the analyses results, there were links between NSE and each component of MS. Figures 2 and 4 show that there might exist a connection between NSE and MS. When NSE concentration ranges from 2.00 ng/mL to 7.50 ng/mL, NSE levels showed negative correlation with MS. A positive correlation was found between NSE and MS when NSE concentration ranges from 7.50 ng/mL to 23.0 ng/mL. It might mean that that NSE has nutritional function in the brain at low concentrations. Thus, it can protect brain tissue at a certain concentration.48 However, at a comparatively high level, NSE can reflect impairment of brain tissue.15 Therefore, NSE concentration may be a potential predictor in the course of occurrences and development of MS. Cerebral vascular stenosis or infarction results in insufficient blood supply to the brain, leading to the functional injury of brain, and NSE can reflect the degree of brain injury.49 The improvements in living standards have led to the rising incidence of MS. To some extent, the assay of NSE concentrations could predict a pathway for cardiovascular disease in MS populations. The advantage of the present study is that it is an epidemiological investigation based on a large sample size. This is essential for the validity and reliability of the results obtained.
Limitations
This is a cross-sectional study based on a large sample health check-up population, which varies from the general population. Thus, the representativeness of this conclusion is limited. In addition, the mechanism involved in the link between NSE and MS is still unclear. However, it is clear from this study that they probably have a causal relationship. In this study, NSE was not evaluated specifically for brain function. Moreover, MRI was not applied to evaluate the degree of impairment of brain due to financial constraints. This will be done in subsequent studies.
Supplementary Material
Acknowledgments
We thank Wannan Medical College and the First Affiliated Hospital of Wannan Medical College for their help in this paper.
Footnotes
Contributors: The project was designed by Y-FW and S-YW; data were collected by X-JZ, X-YZ and W-BL. JM, M-FJ, Z-WW and HW took part in the data entry and arrangement. Y-FW helped in data analysis. All authors contributed to the research and have read and approved the final manuscript.
Funding: This research received no specific grant from any funding agency in the public, commercial or not-for-profit sectors.
Competing interests: None declared.
Patient consent: Obtained.
Ethics approval: This study was approved by the Ethics Committee of Wannan Medical College.
Provenance and peer review: Not commissioned; externally peer reviewed.
Data sharing statement: No additional unpublished data are available.
References
- 1. Karcher HS, Holzwarth R, Mueller HP, et al. Body fat distribution as a risk factor for cerebrovascular disease: an MRI-based body fat quantification study. Cerebrovasc Dis 2013;35:341–8. 10.1159/000348703 [DOI] [PubMed] [Google Scholar]
- 2. Ridker PM. Fasting versus nonfasting triglycerides and the prediction of cardiovascular risk: do we need to revisit the oral triglyceride tolerance test? Clin Chem 2008;54:11–13. 10.1373/clinchem.2007.097907 [DOI] [PubMed] [Google Scholar]
- 3. Boden WE. High-density lipoprotein cholesterol as an independent risk factor in cardiovascular disease: assessing the data from Framingham to the Veterans Affairs High-Density Lipoprotein Intervention Trial. Am J Cardiol 2000;86 19–22. 10.1016/S0002-9149(00)01464-8 [DOI] [PubMed] [Google Scholar]
- 4. Long AN, Dagogo-Jack S. Comorbidities of diabetes and hypertension: mechanisms and approach to target organ protection. J Clin Hypertens 2011;13:244–51. 10.1111/j.1751-7176.2011.00434.x [DOI] [PMC free article] [PubMed] [Google Scholar]
- 5. Forouzanfar MH, Alexander L, Anderson HR, et al. Global, regional, and national comparative risk assessment of 79 behavioural, environmental and occupational, and metabolic risks or clusters of risks in 188 countries, 1990-2013: a systematic analysis for the Global Burden of Disease Study 2013. Lancet 2015;386:2287–323. 10.1016/S0140-6736(15)00128-2 [DOI] [PMC free article] [PubMed] [Google Scholar]
- 6. Dejong RN. The nervous system complications of diabetes mellitus, with special reference to cerebrovascular changes. J Nerv Ment Dis 1950;111:181–206. 10.1097/00005053-195011130-00001 [DOI] [Google Scholar]
- 7. Hanyu H. [Diabetes mellitus and dementia]. Brain Nerve 2014;66:129–34. [PubMed] [Google Scholar]
- 8. Chen J, Guo-Hou HE, Shao-Zu YU. The clinical significance of neuron-specific enolasein serially determinated on the patients with acute cerebral infarction. Journal of Apoplexy & Nervous Diseases 2005;22:70–2. [Google Scholar]
- 9. Novo S, Peritore A, Guarneri FP, et al. Metabolic syndrome (MetS) predicts cardio and cerebrovascular events in a twenty years follow-up. A prospective study. Atherosclerosis 2012;223:468–72. 10.1016/j.atherosclerosis.2012.05.018 [DOI] [PubMed] [Google Scholar]
- 10. Ohta Y, Takao Y, Harada K, et al. Metabolic syndrome is a risk factor for acute cerebral infarction in a younger elderly Kurashiki population. J Stroke Cerebrovasc Dis 2012;21:231–9. 10.1016/j.jstrokecerebrovasdis.2010.07.003 [DOI] [PubMed] [Google Scholar]
- 11. Kawamoto R, Tomita H, Oka Y, et al. Metabolic syndrome as a predictor of ischemic stroke in elderly persons. Intern Med 2005;44:922–7. 10.2169/internalmedicine.44.922 [DOI] [PubMed] [Google Scholar]
- 12. McNeill AM, Rosamond WD, Girman CJ, et al. The metabolic syndrome and 11-year risk of incident cardiovascular disease in the atherosclerosis risk in communities study. Diabetes Care 2005;28:385–90. 10.2337/diacare.28.2.385 [DOI] [PubMed] [Google Scholar]
- 13. Orlino EN, Olmstead CE, Lazareff JA, et al. An enzyme immunoassay for neuron-specific enolase in cerebrospinal fluid. Biochem Mol Med 1997;61:41–6. [DOI] [PubMed] [Google Scholar]
- 14. Ono A, Naito T, Ito I, et al. Correlations between serial pro-gastrin-releasing peptide and neuron-specific enolase levels, and the radiological response to treatment and survival of patients with small-cell lung cancer. Lung Cancer 2012;76:439–44. 10.1016/j.lungcan.2011.12.012 [DOI] [PubMed] [Google Scholar]
- 15. Zhao WX, Luo JF. Serum neuron-specific enolase levels were associated with the prognosis of small cell lung cancer: a meta-analysis: Centre for Reviews and Dissemination (UK). 2013. [DOI] [PubMed]
- 16. Missler U, Wiesmann M, Friedrich C, et al. S-100 Protein and neuron-specific enolase concentrations in blood as indicators of infarction volume and prognosis in acute ischemic stroke. Stroke 1997. 28:1956–60. 10.1161/01.STR.28.10.1956 [DOI] [PubMed] [Google Scholar]
- 17. Pinelis VG, Sorokina EG, Semenova JB, et al. Biomarkers in children with traumatic brain injury. Zhurnal nevrologii i psikhiatrii im. S.S. Korsakova 2015;115:66–72. 10.17116/jnevro20151158166-72 [DOI] [PubMed] [Google Scholar]
- 18. Krohn M, Dreßler J, Bauer M, et al. Immunohistochemical Investigation of S100 and NSE in Cases of Traumatic Brain Injury and Its Application for Survival Time Determination. J Neurotrauma 2015;32:430–40. 10.1089/neu.2014.3524 [DOI] [PubMed] [Google Scholar]
- 19. Hajduková L, Sobek O, Prchalová D, et al. Biomarkers of Brain Damage: S100B and NSE Concentrations in Cerebrospinal Fluid—A Normative Study. Biomed Res Int 2015;2015:1–7. 10.1155/2015/379071 [DOI] [PMC free article] [PubMed] [Google Scholar]
- 20. Gelderblom M, Daehn T, Schattling B, et al. Plasma levels of neuron specific enolase quantify the extent of neuronal injury in murine models of ischemic stroke and multiple sclerosis. Neurobiol Dis 2013;59:177–82. 10.1016/j.nbd.2013.07.017 [DOI] [PubMed] [Google Scholar]
- 21. Sharain K, Hoppensteadt D, Bansal V, et al. Progressive Increase of Inflammatory Biomarkers in Chronic Kidney Disease and End-Stage Renal Disease. Clinical and Applied Thrombosis/Hemostasis 2013;19:303–8. 10.1177/1076029612454935 [DOI] [PubMed] [Google Scholar]
- 22. Purroy F, Suárez-Luis I, Cambray S, et al. The determination of copeptin levels helps management decisions among transient ischaemic attack patients. Acta Neurol Scand 2016;134:140–7. 10.1111/ane.12523 [DOI] [PubMed] [Google Scholar]
- 23. Brandner S, Thaler C, Buchfelder M, et al. Brain-derived protein concentrations in the cerebrospinal fluid: contribution of trauma resulting from ventricular drain Insertion. J Neurotrauma 2013;30:1205–10. 10.1089/neu.2012.2621 [DOI] [PubMed] [Google Scholar]
- 24. Singh RB, Gupta S, Dherange P, et al. Metabolic syndrome: a brain disease. Can J Physiol Pharmacol 2012;90:1171–83. 10.1139/y2012-122 [DOI] [PubMed] [Google Scholar]
- 25. Samancı Y, Samancı B, Şahin E, et al. Neuron-specific enolase levels as a marker for possible neuronal damage in idiopathic intracranial hypertension. Acta Neurol Belg 2017;117:707–11. 10.1007/s13760-017-0762-2 [DOI] [PubMed] [Google Scholar]
- 26. Li J, Yan M, Zhang Y, et al. Serum neuron-specific enolase is elevated as a novel indicator of diabetic retinopathy including macular oedema. Diabetic Medicine 2015;32:102–7. 10.1111/dme.12597 [DOI] [PubMed] [Google Scholar]
- 27. González-Quevedo A, García SG, Concepción OF, et al. Increased serum S-100B and neuron specific enolase - Potential markers of early nervous system involvement in essential hypertension. Clin Biochem 2011;44:154–9. 10.1016/j.clinbiochem.2010.11.006 [DOI] [PubMed] [Google Scholar]
- 28. Fizazi K, Cojean I, Pignon JP, et al. Normal serum neuron specific enolase (NSE) value after the first cycle of chemotherapy: an early predictor of complete response and survival in patients with small cell lung carcinoma. Cancer 1998;82:1049–55. [DOI] [PubMed] [Google Scholar]
- 29. Yh L, Jm L, Wang SY, et al. Comparison of the diagnostic criteria of metabolic syndrome by International Diabetes Federation and that by Chinese Medical Association Diabetes Branch]. Zhonghua yi xue za zhi 2006;86:386–9. [PubMed] [Google Scholar]
- 30. Haque A, Ray SK, Cox A, et al. Neuron specific enolase: a promising therapeutic target in acute spinal cord injury. Metab Brain Dis 2016;31:487–95. 10.1007/s11011-016-9801-6 [DOI] [PMC free article] [PubMed] [Google Scholar]
- 31. Lindenstrom E, Boysen G, Nyboe J. Influence of total cholesterol, high density lipoprotein cholesterol, and triglycerides on risk of cerebrovascular disease: the Copenhagen city heart study. BMJ 1994;309:11–15. 10.1136/bmj.309.6946.11 [DOI] [PMC free article] [PubMed] [Google Scholar]
- 32. Hachinski V, Graffagnino C, Beaudry M, et al. Lipids and stroke: a paradox resolved. Archives of Neurology 1996;53:303–8. [DOI] [PubMed] [Google Scholar]
- 33. Freiberg JJ, et al. Nonfasting triglycerides and risk of ischemic stroke in the general population. JAMA 2008;300:2142–52. 10.1001/jama.2008.621 [DOI] [PubMed] [Google Scholar]
- 34. Shahar E, Chambless LE, Rosamond WD, et al. Plasma lipid profile and incident ischemic stroke: the Atherosclerosis Risk in Communities (ARIC) Study. Stroke 2003;34:623–31. 10.1161/01.STR.0000057812.51734.FF [DOI] [PubMed] [Google Scholar]
- 35. Willey JZ, Qiang X, Bodenalbala B, et al. Lipid profile components and risk of ischemic stroke: the Northern Manhattan Study (NOMAS). Archives of Neurology 2009;66:1400–6. [DOI] [PMC free article] [PubMed] [Google Scholar]
- 36. Dong L, Hou R, Xu Y, et al. Analyzing the correlation between the level of serum markers and ischemic cerebral vascular disease by multiple parameters. Comput Math Methods Med 2015;2015:1–5. 10.1155/2015/972851 [DOI] [PMC free article] [PubMed] [Google Scholar]
- 37. Amarenco P, Labreuche J, Touboul P-J. High-density lipoprotein-cholesterol and risk of stroke and carotid atherosclerosis: A systematic review. Atherosclerosis 2008;196:489–96. 10.1016/j.atherosclerosis.2007.07.033 [DOI] [PubMed] [Google Scholar]
- 38. Bots ML, Elwood PC, Nikitin Y, et al. Total and HDL cholesterol and risk of stroke. EUROSTROKE: a collaborative study among research centres in Europe. Journal of Epidemiology & Community Health 2002;56:i19–i24. 10.1136/jech.56.suppl_1.i19 [DOI] [PMC free article] [PubMed] [Google Scholar]
- 39. Henskens LH, van Oostenbrugge RJ, Kroon AA, et al. Detection of silent cerebrovascular disease refines risk stratification of hypertensive patients. J Hypertens 2009;27:846–53. 10.1097/HJH.0b013e3283232c96 [DOI] [PubMed] [Google Scholar]
- 40. Chobanian AV, Bakris GL, Black HR, et al. Seventh report of the joint national committee on prevention, detection, evaluation, and treatment of high blood pressure. Hypertension 2003;42:1206–52. 10.1161/01.HYP.0000107251.49515.c2 [DOI] [PubMed] [Google Scholar]
- 41. Maillard P, Seshadri S, Beiser A, et al. Effects of systolic blood pressure on white-matter integrity in young adults in the Framingham Heart Study: a cross-sectional study. Lancet Neurol 2012;11:1039–47. 10.1016/S1474-4422(12)70241-7 [DOI] [PMC free article] [PubMed] [Google Scholar]
- 42. González-Quevedo A, González-García S, Hernández-Díaz Z, et al. Serum neuron specific enolase could predict subclinical brain damage and the subsequent occurrence of brain related vascular events during follow up in essential hypertension. J Neurol Sci 2016;363:158–63. 10.1016/j.jns.2016.02.052 [DOI] [PubMed] [Google Scholar]
- 43. Avet J, Pichot V, Barthélémy J-C, et al. Leukoaraiosis and ambulatory blood pressure load in a healthy elderly cohort study: The PROOF study. Int J Cardiol 2014;172:59–63. 10.1016/j.ijcard.2013.11.052 [DOI] [PubMed] [Google Scholar]
- 44. Kharabian Masouleh S, Beyer F, Lampe L, et al. Gray matter structural networks are associated with cardiovascular risk factors in healthy older adults. J Cereb Blood Flow Metab 2018;38:17 10.1177/0271678X17729111 [DOI] [PMC free article] [PubMed] [Google Scholar]
- 45. Auer RN, Wieloch T, Olsson Y, et al. The distribution of hypoglycemic brain damage. Acta Neuropathol 1984;64:177–91. 10.1007/BF00688108 [DOI] [PubMed] [Google Scholar]
- 46. Auer RN. Progress review: hypoglycemic brain damage. Stroke 1986;17:699–708. 10.1161/01.STR.17.4.699 [DOI] [PubMed] [Google Scholar]
- 47. Ergul A, Kelly-Cobbs A, Abdalla M, et al. Cerebrovascular complications of diabetes: focus on stroke. Endocr Metab Immune Disord Drug Targets 2012;12:148–58. 10.2174/187153012800493477 [DOI] [PMC free article] [PubMed] [Google Scholar]
- 48. Hattori T, Takei N, Mizuno Y, et al. Neurotrophic and neuroprotective effects of neuron-specific enolase on cultured neurons from embryonic rat brain. Neurosci Res 1995;21:191–8. 10.1016/0168-0102(94)00849-B [DOI] [PubMed] [Google Scholar]
- 49. Gutierrez J, Elkind MSV, Virmani R, et al. A pathological perspective on the natural history of cerebral atherosclerosis. Inter J Stroke 2015;10:1074–80. 10.1111/ijs.12496 [DOI] [PMC free article] [PubMed] [Google Scholar]
Associated Data
This section collects any data citations, data availability statements, or supplementary materials included in this article.