Abstract
Background
Significant mortality and morbidity are associated with alterations in the pulmonary vasculature. While techniques have been described for quantitative morphometry of whole-lung arterial trees in larger animals, no methods have been described in mice. We report a method for the quantitative assessment of murine pulmonary arterial vasculature using high-resolution computed tomography scanning.
Methods
Mice were harvested at 2 weeks, 4 weeks, and 3 months of age. The pulmonary artery vascular tree was pressure perfused to maximal dilation with a radio-opaque casting material with viscosity and pressure set to prevent capillary transit and venous filling. The lungs were fixed and scanned on a specimen computed tomography scanner at 8-μm resolution, and the vessels were segmented. Vessels were grouped into categories based on lumen diameter and branch generation.
Results
Robust high-resolution segmentation was achieved, permitting detailed quantitation of pulmonary vascular morphometrics. As expected, postnatal lung development was associated with progressive increase in small-vessel number and arterial branching complexity.
Conclusions
These methods for quantitative analysis of the pulmonary vasculature in postnatal and adult mice provide a useful tool for the evaluation of mouse models of disease that affect the pulmonary vasculature.
Keywords: Pulmonary circulation, Lung development, Computed tomography
Introduction
The lung is a complex organ that is composed of airways, blood vessels, and parenchyma. Acquired diseases such as emphysema and bronchopulmonary dysplasia, and congenital diseases such as congenital diaphragmatic hernia, congenital heart disease, and primary pulmonary hypertension may have alterations in the pulmonary vasculature from vessel wall remodeling and reduction in vessel numbers due to vessel rarefaction or failed angiogenesis.1–6 Pulmonary hypertension is a source of significant morbidity and mortality. The mechanisms are not fully understood, and treatments to prevent or reverse it are lacking.
Animal models have been used to investigate the histology, physiology, and molecular mechanisms of pulmonary hypertension and pulmonary vascular disease.7–9 A major limitation in studying pulmonary hypertension and other pulmonary vascular disease is the lack of appropriate quantitative morphometric techniques to evaluate the entire intact pulmonary vascular tree. Current analysis of the pulmonary vasculature is restricted to histologic or stereologic techniques that require the use of random or systematic sampling from two-dimensional tissue sections to draw conclusions about three-dimensional (3D) structure.10–15 Verified techniques such as point discrimination, line intercept count, and transection count use standardized methods such as a uniform grid to overlay on tissue section images and thus limit the amount of error associated with probing the structures of interest.10,14,16–18 Such methods are limited by the assumption that each analyzed sample is sufficiently random yet simultaneously representative of the entire lung.10 Hence, these methods do not account for the full complexity of the pulmonary vasculature. Furthermore, they do not allow whole-lung evaluation of branch-patterning, vessel generation, length, diameter, or volume of the pulmonary vasculature. Moreover, tissue sections alone may miss the true density of blood vessels or changes in vessel density and structure from one lobe to another.15
In recent years, 3D techniques to evaluate the pulmonary vasculature in small animal models have evolved to avoid the above limitations. Multidetector computed tomography (CT), magnetic resonance imaging, and micro-CT (μCT) have been used.14,19–22 Micro-CT has a number of advantages. Images can be acquired in vivo or on postmortem tissue samples. Analysis may be combined with unbiased sampling procedures and can encompass the entire pulmonary vascular tree.14,20,22 μCT can acquire images with resolution that is comparable to microscopy.14 Recently, μCT was combined with arterial casting to evaluate pulmonary vascular development in the rat. Data were obtained and analyzed with proprietary software to provide automated measurements.22 Besides the limitation of using noncommercially available software, few studies have applied these techniques to mice. Mouse models of pulmonary vascular disease are important for understanding the basis of pulmonary vascular disease. Thus, the purpose of this study was to develop a method for quantitative analysis of the total murine lung vascular tree using current techniques and commercially available software.
Materials and methods
Animals
Male C57BL/6-SVJ/129 hybrid mice from our existing colony were sacrificed at 2 weeks, 4 weeks, and 3 months (adult). Animal care and procedures were approved by the University of North Carolina Institutional Animal Care and Use Committee.
Lung perfusion and casting technique
Perfusion cannulas were constructed by inserting polyethylene-10 (PE-10) into polyethylene-50 (PE-50) tubing (Solomon Scientific, San Antonio, TX) in which a wire mandrel was inserted to maintain luminal patency during heating over a soldering iron tip to seal the tubing and form a trumpeted tip.
Mice were deeply anesthetized with isoflurane, heparinized, and lungs harvested either with or without measurement of right ventricular pressure. After removal of the anterior chest wall, the pulmonary artery was cannulated through the right ventricle, the left atrium incised, and the lungs perfused with 200 μL of phosphate-buffered saline containing sodium nitroprusside (104 M) to ensure maximum vessel dilation. The trachea was then cannulated with PE-10 tubing and inflated to 20 cm H2O with 4% paraformaldehyde (Fig. 1A). Microfil (Flowtech Inc, Carver, MA), which was mixed in a ratio of 800 μL of Microfil, 100 μL of diluent, and 100 μL of casting agent to achieve a viscosity tailored to minimize capillary and venous transit, was slowly infused under a dissecting microscope. After the Microfil solidified, the trachea was ligated to maintain airway distension, and the lungs and/or trachea excised and fixed in paraformaldehyde for 24 hours.
Fig. 1.
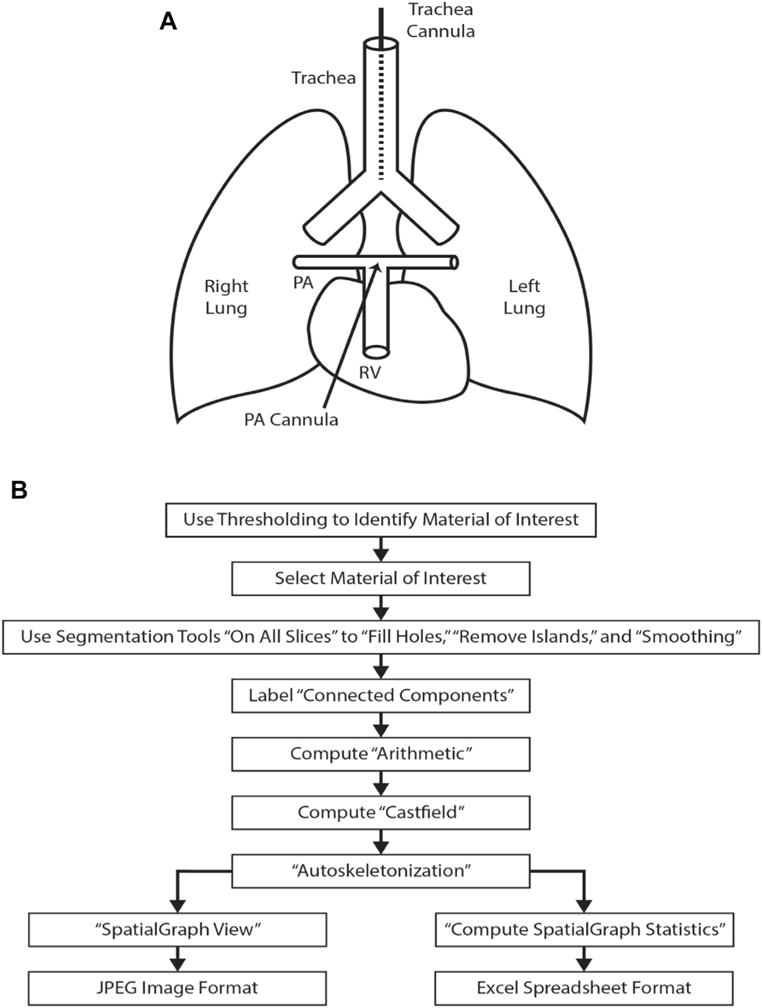
(A) The diagram of the cannulation process for pulmonary arterial perfusion and pulmonary airway perfusion. After removal of the anterior chest wall, using a dissection microscope, the pulmonary artery (PA) is cannulated with a polyethylene (PE) tubing through a small incision in the right ventricle (RV). A tie secures the catheter in the PA and prevents leakage. A tracheotomy is performed to cannulate the trachea with PE tubing above the level of the carina. A tie secures the cannula within the trachea. (B) Flowchart of the “work flow” for processing the acquired images, 3D reconstruction, and analysis of the images.
Tissue imaging and analysis
Lungs were scanned on a MicroCT 40 (Scanco Medical, Wayne, PA). CT scans were obtained using the following settings: field of view (16 mm), energy or intensity (70 kVp, 114 μA, 8W), high resolution (i.e., 1000 projections), voxel size (8 μm), and an integration time (200 ms). This produced DICOM images at 8-μm resolution. Data (DICOM) were analyzed using Amira 5.5.0 software (FEI, Hillsboro, Oregon). A 3D reconstruction of the pulmonary arterial tree was achieved with multiple steps. Threshold segmentation identified the material of interest and was optimized by specimen. If bubbles were present within the arterial cast, a segmentation tool removed the bubbles with the command “Fill Holes.” Images were processed with default settings using the “Remove Islands” and “Smoothing” segmentation functions. Connected components were attached to the Labelfield with a minimum size threshold of 100 pixels and a maximum size threshold of 0. “Connected components options” for “Labelfield” and “Spreadsheet” were selected as output styles, and “Preserve Exterior” was left unchecked. Next, material of interest was identified within the spreadsheet by identifying the largest nonexterior material available and noting the material designation (i.e., material X). Compute-arithmetic function was performed by designating the function to be performed on the material identified by the spreadsheet as A = X. A Castfield was generated from the result, and the output type selected is Labelfield. Using the Castfield generation, autos-keletonization was performed on the generated Labelfield (Fig. 1B).
Three consecutive images were created from the cast of the lung vessels. The first image was the node visualization where a ball is present at each branch point in the vascular tree (Fig. 2A). The second was the skeletonized image where a line represents the centerline for each vessel (Fig. 2B). The third image was the reconstruction of the lung cast (Fig. 2C). Once the autoskeleton image was generated, loops were then identified using the Filament editor function. “Loops” are nonanatomic and false connections between two vessels that are artifacts from reconstruction of the vascular tree. Nonanatomic “loops” were removed manually and sequentially to preserve normal branching and to create a ranked vascular tree.
Fig. 2.
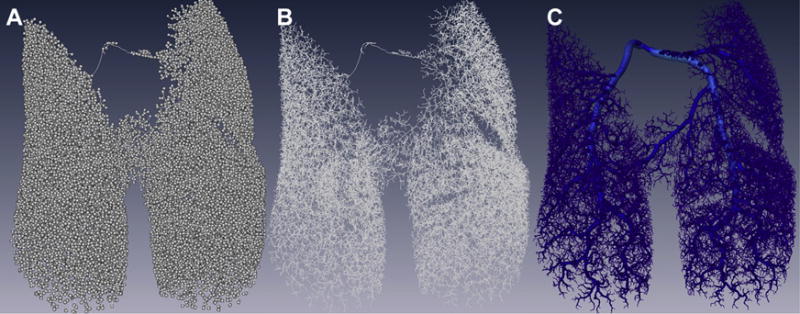
Images created using Amira during the workflow process to create the reconstructed image of the pulmonary vasculature. Represented are three images from the same cast of the pulmonary vasculature. (A) Node visualization–each branch point in the vascular tree is represented by a ball. (B) Skeleton–the skeletonized view shows a line that represents the centerline of each vessel. (C) Reconstructed lung–the image depicts the final reconstruction of the lung cast. (Color version of figure is available online.)
“Generations” within the vascular tree are assigned based on progressive dichotomous branching with the main pulmonary artery designated as the trunk of the tree (generation 1). An increase in the order of branching was assigned an increase in the generation, with higher generation number with greater distance from the trunk of the vascular tree. All segments received a generation assignment. Reconstructed vascular trees were deemed appropriate if an entire tree produced less than 150 “loops”. The latter abnormal segments prevent the ranking of the vessel segments as the software is unable to rank branches which form a loop. Using the spatial graph view, images of the vascular tree were generated and spatial graph analysis was performed. Spatial graph data provided the total number of segments, mean segment radius, segment length, segment volume, and the number of segments at each vessel rank. Segments were then grouped based on luminal diameter (<25 μm, 25-75 μm, 75-150 μm, and >150 μm) and compared. The degree of vessel branching was analyzed by comparing the number of vessels at each vessel generation. After μCT scanning, lungs were cleared using daily serial ethanol washes (25%, 50%, 75%, 95%, and 100%), then final immersion in methyl salicylate according to the manufacturers specifications (Flowtech Inc). Photomicrographs were acquired at 9× and 30× magnification and analyzed using ImageJ (NIH).
Statistical analysis
Data are presented as mean standard error of mean and were tested for significance (P < 0.05) by t-tests or analysis of variance (ANOVA), followed by Bonferroni tests or Kruskal–Wallis tests where appropriate (GraphPad Prism v 5, San Diego, CA). Three animals were used in each experimental group.
Results
Cleared lungs from three different mice from each age group showed qualitative increases in vascular complexity and density (Fig. 3A and C). The tortuosity and dilated nature of the main pulmonary artery declined with adulthood (Fig. 3E). Inspection of the lung periphery at high magnification revealed that more of the “side” branches of high-generation vessels are present in the periphery of the lung at 2 weeks (Fig. 3B). By 4 weeks, there were high-generation side branches that sprouted off of the entire length of the secondary and tertiary generation branches (Fig. 3D). The branching pattern filled the lung and was highly organized in the adult (Fig. 3E and F).
Fig. 3.
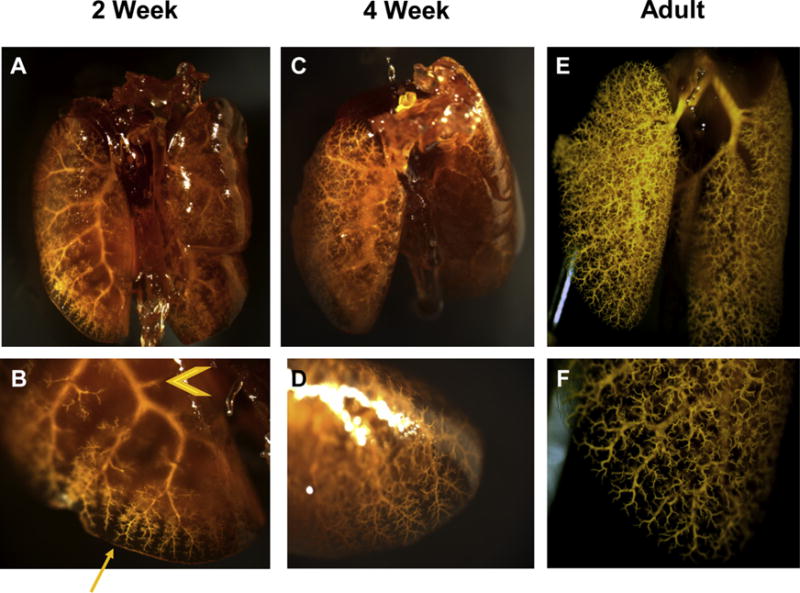
Mouse lungs that have been perfused through the pulmonary vasculature with Microfil and cleared. Each lung is representative of their respective age group. Age groups: 2 weeks (A, B); 4 weeks (C, D); adult (E, F). Images were acquired by dissecting microscope. Whole lung: 9× magnificationd(A, C, E) lung periphery: 30× magnificationd(B, D, F). The lungs grossly demonstrate an increase in complexity and number of vessels in the pulmonary arterial tree across development. “Side branches” of major pulmonary arteries appear in greater abundance in the periphery (arrow) of 2-week mice then the proximal (arrowhead) pulmonary vasculature (2B). Side branches have filled and sprouted from proximal pulmonary vessels by 4 weeks (2D). (Color version of figure is available online.)
Three mice were scanned in each age group. Each exhibited between 50 and 150 nonanatomic loops that were identified and removed, followed by 3D reconstruction (Fig. 4). Consistent with the gross imaging (Fig. 3), density, complexity, and branch-order qualitatively increased with age (Fig. 4). The number of vessels increased with age although it did not reach statistical significance by ANOVA (P = 0.37), while the number of generations in the vascular tree peaked at 4 weeks (Fig. 5A and B). Differences in the number of generations were not statistically significant between age groups by ANOVA (P = 0.37). The number of vessels within a given range of lumen diameter increased with growth to adulthood (Fig. 5C) while vessel lengths did not (Fig. 5D).
Fig. 4.
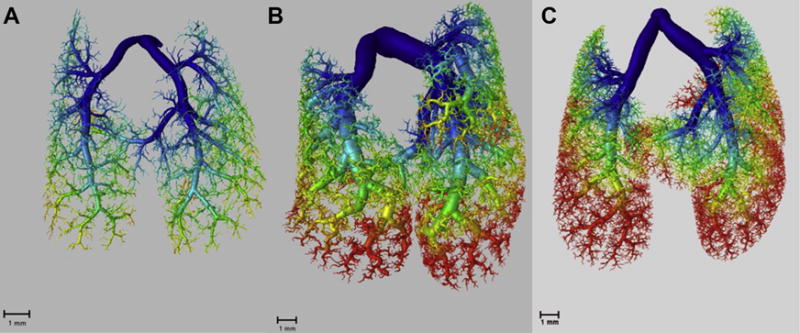
Reconstructed of images of the mouse pulmonary vasculature at (A) 2 weeks of age, (B) 4 weeks of age, and (C) 3 months of age. The generation of a vessel is represented by a color gradient from blue (low) to red (high). Qualitatively, there is increased density and complexity in the pulmonary vasculature as age increases. (Color version of figure is available online.)
Fig. 5.
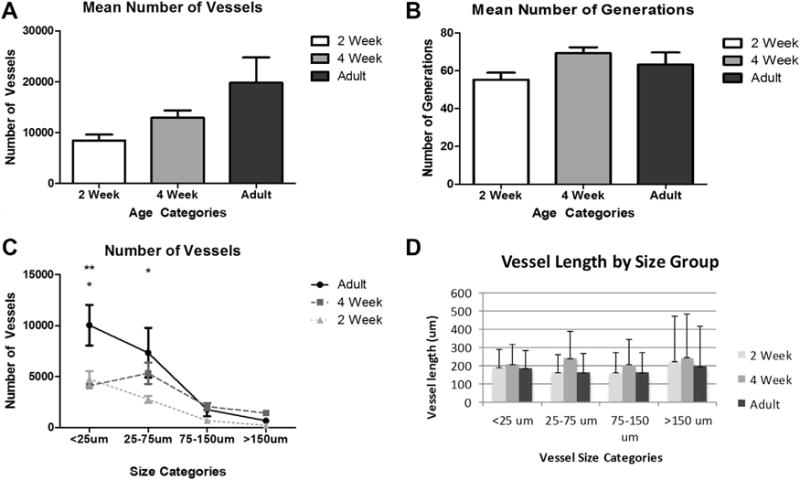
(A) The graph shows the mean number of vessels by age group. The number of vessels increased with age. Comparisons between groups were not statistically significant (P = 0.37). (B) The graph shows the mean number of generations by age group. The mean number peaks at 4 weeks and slightly decreases in adulthood. Comparisons between age groups did not demonstrate statistically significant differences. (P = 0.37). (C) The graph shows the mean vessel counts by diameter of the vessels divided into size categories for each age group. Statistically significant differences are present between adult and 2-week mice for the <25 mm and 25-75 mm size categories and between the adult and 4-week mice for the <25 mm size category. No statistically significant differences are present between 4-week and 2-week mice. (*P < 0.05 adult versus 2 weeks; **P < 0.01 Adult versus 4 weeks). (D) The graph shows the vessel length as it relates to the established vessel size categories. The highest vessel lengths in each size category are at the 4-week time point. Comparisons between groups failed to demonstrate differences.
To evaluate the number of vessels in relation to the complexity of branching, mean vessel number as a function of generation was determined for each age group. The number of vessels for a given generation grouping increased with age, although the differences within a grouping were not significant (Fig. 6A).
Fig. 6.
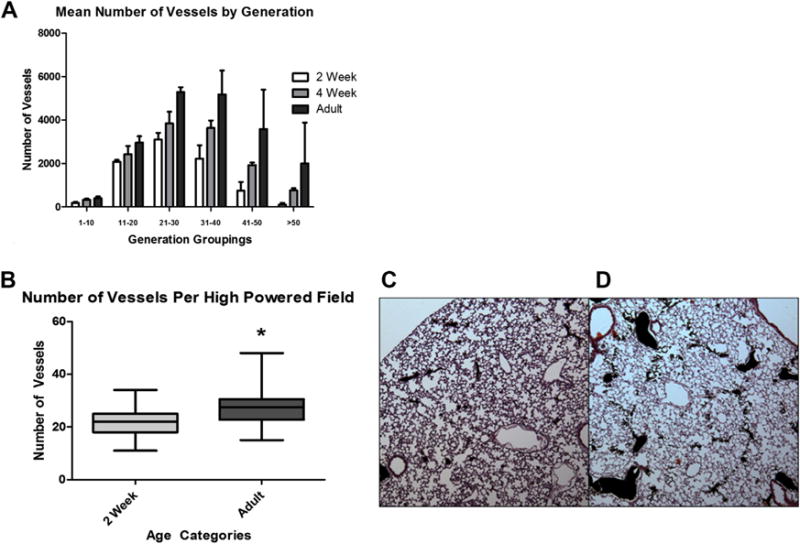
(A) The graph shows the mean number of vessels at each age. The means of each age were compared to one another within the generation grouping. While the mean vessel number increases in accordance with the age cohort, none of the differences were found to be statistically significant. There is a peak in the number of vessels for each age cohort in the 21-30 rank grouping. (B) The graph demonstrates a statistically significant difference with a greater number of vessels per high-powered field in adult mice in comparison to 2-week mice. (*P < 0.0001; whiskers on box plot represent the maximum and minimum vessels per high-powered field). (C and D) Hematoxylin and eosin-stained micrographs from C–2 week and D–adult mice at 100× magnification. Filled arteries are black. (Color version of figure is available online.)
Lungs from 2 week and adult mice perfused with Microfil were prepared for histologic analysis, sectioned, and images were acquired. Manual counts for filled vessels were obtained from random images (Fig. 6B). As expected, the number of vessels was significantly greater in the adult.
Discussion
This study combined high-resolution CT, vascular casting of cleared whole-lung, histologic analysis, and automated quantification of vessels with commercially available software to evaluate the murine pulmonary vasculature. Generation number, vessel lengths, diameters, and densities were determined with the methods developed for this study. This study is important because it uses a readily available method for automated quantification of the entire mouse pulmonary vasculature with high resolution. Moreover, the techniques from this study can be applied to mouse models for pulmonary hypertension and other forms of pulmonary vascular disease where vessel rarefaction, failed angiogenesis, or inappropriate angiogenesis are a part of the pathogenesis of pulmonary hypertension.4,6,23,24 The mechanisms are not understood, and there is no treatment. Analysis derived by techniques from this study may elucidate the mechanisms that drive the pathologic changes that occur in mouse models for pulmonary hypertension and pulmonary vascular disease.
Past morphometric methods to study the pulmonary vasculature in humans and animals involved stereology of histologic sections, corrosion casts, arteriograms, and CT scans.10,11,20–22,25–28 Traditional methods evaluate as few as 0.1% of vessels in the lung and do not always capture areas representative of the entire lung.13–15,28 The use of μCT with 3D reconstruction of the pulmonary vasculature is an improvement over traditional techniques because it permits hierarchical vessel analysis, automates vessel measurements, avoids random sampling of histologic sections, and captures the entire vascular tree including the smallest vessels.13,15,20,22,29 μCT with 3D reconstruction of the pulmonary vasculature has been used in rodent models, but to date, only one such study has been performed in mice. In that study, the authors did not demonstrate the full complexity of vessel branching or use of resolution capable of showing small vessels.20 The smallest vessels identified were 160 μm in diameter and were only measured down to eight generations.20 The present methods allow measurement of vessels as small as 8 μm in diameter and greater than 50 generations into the vascular tree. The latter study and the present study used the same software for analysis. However, to visualize the pulmonary vasculature, Counter et al.20 used intravenous contrast, which they cited as having uneven distribution that led to the poor vessel resolution. The present study uses Microfil, which provides even distribution and sufficient viscosity to prevent capillary and venous transit. Razavi et al.22 used Microfil to study the rat pulmonary vasculature and achieved resolution to 12.5 μm.
In the past, most groups have developed proprietary computer software.22 The present study used the commercially available software, Amira, to reconstruct images and perform the analysis. The advantages of Amira are that it is commercially available, flexible, and easy to use.
As expected, there was an increase in vessel number with age. The largest increase occurred between 2 weeks and 4 weeks and between the 21st and 40th generation, with vessels having diameters of 75 μm and below. To date and to the knowledge of the authors, there is no mouse study that can be used as a comparison for our time series developmental data, but the data in this study are consistent with pulmonary vascular development in rats and humans.22,30 Unexpectedly, this study showed no difference in vessel length with age or according to diameter. Counter et al.20 reported similar findings, where the length of vessel segments was consistent throughout the lung. Branching in the pulmonary vasculature is fractal in nature, wherein the length of vessels segments between branch points is consistent throughout the vascular tree.29 Thus, vessel length is not responsible for complexity or variance in the mouse pulmonary vasculature. Rather, complexity is determined by the degree of progressively increasing branching or generation.31 In our study, generations peaked at 4 weeks and then slightly decreased by adulthood. Gross observations of whole lung and histologic vessel quantification supported our data from CT scans.
This study has limitations. Filling of the vascular tree by manual injection and direct visualization of the pulmonary vascular tree can lead to overfilling or disruption of vessels. When this was encountered, the specimen was not used for analysis. This problem can be overcome with automatic injectors, although variation in catheters and animals may then surface as a new problem. We thus relied on manual injection while viewing the surface of the lung, which we found to yield good results. Image reconstruction led to loops, i.e., false continuity between two vessels. The loops had to be removed manually before measurement and quantification. The manual removal of loops may lead to bias if incorrectly removed or if not recognized. All measurements were made postmortem which does not allow for multiple or longitudinal measurements in the same animal, a previous limitation.20,22 A final limitation, μCT scanners are expensive. In the absence of such instrumentation, the casting and clearing methods that we describe here permit a certain level of manual morphometry when combined with progressive dissection through the depth of the lung lobe.
Conclusions
In conclusion, we describe methods for automated quantitative morphometry of the pulmonary vasculature of the mouse. This limits the possibility for bias that can occur when using sampling or supervised stereologic techniques. We believe that these methods will aid lung imaging in mouse models of pulmonary vascular disease.
Acknowledgments
The authors thank Maria Gambarian for her expert care of the mice and technical support. They thank Ted Hobgood for assistance with figures and cover art. This work was supported by the Robert Wood Johnson Foundation Harold Amos Faculty Development Program (67069) (SEM), UNC Department of Surgery, and the National Institutes of Health grant-GM008450 (MRP).
Footnotes
Author’s contributions: M.R.P. and S.E.M. did conception, design, experimentation, analysis and interpretation, writing article, and revision of manuscript. S.M.M. carried out conception, design, experimentation, analysis and interpretation of results. M.S. did experimentation, analysis and interpretation of results, and writing and revision of manuscript. C.L. helped in experimentation. Y.Z.L. executed conception, design, experimentation, analysis and interpretation of results, and writing and revision of manuscript. J.E.F. did advice, reagents for experiments, and manuscript editing.
Disclosure
The authors have not financial or personal relationships to disclose that may create a conflict or bias in conducting the study or interpreting data.
References
- 1.Dhillon R. The management of neonatal pulmonary hypertension. Arch Dis Child Fetal Neonatal Ed. 2012;97:F223–F228. doi: 10.1136/adc.2009.180091. [DOI] [PubMed] [Google Scholar]
- 2.Kool H, Mous D, Tibboel D, de Klein A, Rottier RJ. Pulmonary vascular development goes awry in congenital lung abnormalities. Birth Defects Res C Embryo Today. 2014;102:343–358. doi: 10.1002/bdrc.21085. [DOI] [PubMed] [Google Scholar]
- 3.Krishnan U, Rosenzweig EB. Pulmonary hypertension in chronic lung disease of infancy. Curr Opin Pediatr. 2015;27:177–183. doi: 10.1097/MOP.0000000000000205. [DOI] [PubMed] [Google Scholar]
- 4.Voelkel NF, Douglas IS, Nicolls M. Angiogenesis in chronic lung disease. Chest. 2007;131:874–879. doi: 10.1378/chest.06-2453. [DOI] [PMC free article] [PubMed] [Google Scholar]
- 5.Kitagawa M, Hislop A, Boyden EA, Reid L. Lung hypoplasia in congenital diaphragmatic hernia. A quantitative study of airway, artery, and alveolar development. Br J Surg. 1971;58:342–346. doi: 10.1002/bjs.1800580507. [DOI] [PubMed] [Google Scholar]
- 6.Hopkins N, McLoughlin P. The structural basis of pulmonary hypertension in chronic lung disease: remodelling, rarefaction or angiogenesis? J Anat. 2002;201:335–348. doi: 10.1046/j.1469-7580.2002.00096.x. [DOI] [PMC free article] [PubMed] [Google Scholar]
- 7.Faber JE, Szymeczak CL, Cotecchia S, et al. Alpha1-adrenoceptor-dependent vascular hypertrophy and remodeling in murine hypoxic pulmonary hypertension. Am J Physiol Heart Circ Physiol. 2007;292:H2316–H2323. doi: 10.1152/ajpheart.00792.2006. [DOI] [PubMed] [Google Scholar]
- 8.Mecham RP, Whitehouse LA, Wrenn DS, et al. Smooth muscle-mediated connective tissue remodeling in pulmonary hypertension. Science. 1987;237:423–426. doi: 10.1126/science.3603030. [DOI] [PubMed] [Google Scholar]
- 9.Rendas A, Branthwaite M, Lennox S, Reid L. Response of the pulmonary circulation to acute hypoxia in the growing pig. J Appl Physiol Respir Environ Exerc Physiol. 1982;52:811–814. doi: 10.1152/jappl.1982.52.4.811. [DOI] [PubMed] [Google Scholar]
- 10.Bolender RP, Hyde DM, Dehoff RT. Lung morphometry: a new generation of tools and experiments for organ, tissue, cell, and molecular biology. Am J Physiol. 1993;265:L521–L548. doi: 10.1152/ajplung.1993.265.6.L521. [DOI] [PubMed] [Google Scholar]
- 11.Davies P, Reid L. Hypoxic remodeling of the rat pulmonary arterial microcirculation assessed by microdissection. J Appl Physiol (1985) 1991;71:1886–1891. doi: 10.1152/jappl.1991.71.5.1886. [DOI] [PubMed] [Google Scholar]
- 12.Hislop A, Reid L. Intra-pulmonary arterial development during fetal life-branching pattern and structure. J Anat. 1972;113:35–48. [PMC free article] [PubMed] [Google Scholar]
- 13.Hsia CC, Hyde DM, Ochs M, Weibel ER. How to measure lung structure–what for? On the “Standards for the quantitative assessment of lung structure”. Respir Physiol Neurobiol. 2010;171:72–74. doi: 10.1016/j.resp.2010.02.016. [DOI] [PubMed] [Google Scholar]
- 14.Hsia CC, Hyde DM, Ochs M, Weibel ER. An official research policy statement of the American Thoracic Society/European Respiratory Society: standards for quantitative assessment of lung structure. Am J Respir Crit Care Med. 2010;181:394–418. doi: 10.1164/rccm.200809-1522ST. [DOI] [PMC free article] [PubMed] [Google Scholar]
- 15.Zeltner TB, Bertacchini M, Messerli A, Burri PH. Morphometric estimation of regional differences in the rat lung. Exp Lung Res. 1990;16:145–158. doi: 10.3109/01902149009087879. [DOI] [PubMed] [Google Scholar]
- 16.Dunnill MS. Quantitative methods in the study of pulmonary pathology. Thorax. 1962;17:320–328. doi: 10.1136/thx.17.4.320. [DOI] [PMC free article] [PubMed] [Google Scholar]
- 17.Cooney TP, Thurlbeck WM. The radial alveolar count method of Emery and Mithal: a reappraisal 2–intrauterine and early postnatal lung growth. Thorax. 1982;37:580–583. doi: 10.1136/thx.37.8.580. [DOI] [PMC free article] [PubMed] [Google Scholar]
- 18.Cooney TP, Thurlbeck WM. The radial alveolar count method of Emery and Mithal: a reappraisal 1–postnatal lung growth. Thorax. 1982;37:572–579. doi: 10.1136/thx.37.8.572. [DOI] [PMC free article] [PubMed] [Google Scholar]
- 19.Cero FT, Hillestad V, Sjaastad I, et al. Absence of the inflammasome adaptor ASC reduces hypoxia-induced pulmonary hypertension in mice. Am J Physiol Lung Cell Mol Physiol. 2015;309:L378–L387. doi: 10.1152/ajplung.00342.2014. [DOI] [PubMed] [Google Scholar]
- 20.Counter WB, Wang IQ, Farncombe TH, Labiris NR. Airway and pulmonary vascular measurements using contrast-enhanced micro-CT in rodents. Am J Physiol Lung Cell Mol Physiol. 2013;304:L831–L843. doi: 10.1152/ajplung.00281.2012. [DOI] [PubMed] [Google Scholar]
- 21.Mondy WL, Cameron D, Timmermans JP, et al. Micro-CT of corrosion casts for use in the computer-aided design of microvasculature. Tissue Eng Part C Methods. 2009;15:729–738. doi: 10.1089/ten.TEC.2008.0583. [DOI] [PubMed] [Google Scholar]
- 22.Razavi H, Dusch MN, Zarafshar SY, Taylor CA, Feinstein JA. A method for quantitative characterization of growth in the 3-D structure of rat pulmonary arteries. Microvasc Res. 2012;83:146–153. doi: 10.1016/j.mvr.2011.12.003. [DOI] [PubMed] [Google Scholar]
- 23.Delaney C, Wright RH, Tang JR, et al. Lack of EC-SOD worsens alveolar and vascular development in a neonatal mouse model of bleomycin-induced bronchopulmonary dysplasia and pulmonary hypertension. Pediatr Res. 2015;78:634–640. doi: 10.1038/pr.2015.166. [DOI] [PMC free article] [PubMed] [Google Scholar]
- 24.Tuder RM, Voelkel NF. Angiogenesis and pulmonary hypertension: a unique process in a unique disease. Antioxid Redox Signal. 2002;4:833–843. doi: 10.1089/152308602760598990. [DOI] [PubMed] [Google Scholar]
- 25.Horsfield K. Morphometry of the small pulmonary arteries in man. Circ Res. 1978;42:593–597. doi: 10.1161/01.res.42.5.593. [DOI] [PubMed] [Google Scholar]
- 26.Horsfield K, Thomas M. Morphometry of pulmonary arteries from angiograms in chronic obstructive lung disease. Thorax. 1981;36:360–365. doi: 10.1136/thx.36.5.360. [DOI] [PMC free article] [PubMed] [Google Scholar]
- 27.Ackermann M, Houdek JP, Gibney BC, et al. Sprouting and intussusceptive angiogenesis in postpneumonectomy lung growth: mechanisms of alveolar neovascularization. Angiogenesis. 2014;17:541–551. doi: 10.1007/s10456-013-9399-9. [DOI] [PMC free article] [PubMed] [Google Scholar]
- 28.Singhal S, Henderson R, Horsfield K, Harding K, Cumming G. Morphometry of the human pulmonary arterial tree. Circ Res. 1973;33:190–197. doi: 10.1161/01.res.33.2.190. [DOI] [PubMed] [Google Scholar]
- 29.Frey U, Hislop A, Silverman M. Branching properties of the pulmonary arterial tree during pre- and postnatal development. Respir Physiol Neurobiol. 2004;139:179–189. doi: 10.1016/j.resp.2003.09.010. [DOI] [PubMed] [Google Scholar]
- 30.Davies G, Reid L. Growth of the alveoli and pulmonary arteries in childhood. Thorax. 1970;25:669–681. doi: 10.1136/thx.25.6.669. [DOI] [PMC free article] [PubMed] [Google Scholar]
- 31.Weibel ER. Morphometry of the human lung. Berlin: Springer-Verlag; 1963. [Google Scholar]


