

Abstract
Background
The Movement Disorder Society‐Sponsored Revision of the Unified Parkinson's Disease Rating Scale (MDS‐UPDRS) is a commonly used tool to measure progression in patients with Parkinson's disease (PD). Longitudinal changes in MDS‐UPDRS scores in patients with de novo PD have not been established. The objective of this study was to determine progression rates of MDS‐UPDRS scores in de novo PD.
Methods
In total, 362 participants from the Parkinson's Progression Markers Initiative, a multicenter, longitudinal cohort study of de novo PD, were included. Longitudinal progression of MDS‐UPDRS total and subscale scores were modeled using mixed model regression.
Results
MDS‐UPDRS scores increased in a linear fashion over 5 years in patients with de novo PD. MDS‐UPDRS total scores increased an estimated 4.7 points per year, Part I scores increased 0.92 points per year, Part II scores increased 0.99 points per year, and Part III scores increased 2.4 points per year.
Conclusions
The expected average progression of MDS‐UPDRS scores in patients with de novo PD from this study can assist in clinical monitoring and provide comparative data for the detection of disease modification in treatment trials.
Keywords: biomarkers, disease progression, Movement Disorder Society‐Sponsored Revision of the Unified Parkinson's Disease Rating Scale (MDS‐UPDRS), Parkinson's disease
Parkinson disease (PD) is a progressive neurodegenerative disorder characterized by distinctive motor and non‐motor manifestations. Symptom severity and progression in PD can be evaluated using disease‐specific clinical rating scales, which offer benefits of low cost, ease of administration, and correlation with clinically important outcomes. Knowing the expected progression of rating scale scores is essential for counseling patients regarding disease prognosis and for planning and interpreting clinical trials of disease‐modifying therapies in PD.1
The Unified Parkinson's Disease Rating Scale (UPDRS), which was developed in the 1980s, has been the most widely used rating scale for tracking PD progression.2 The UPDRS is divided into 4 parts: Part I, Mentation, Behavior, and Mood (4 items); Part II, Activities of Daily Living (13 items); Part III, Motor Examination (27 items); and Part IV, Complications of Therapy (11 items). Each parkinsonian sign or symptom is rated on a 5‐point Likert‐type scale (ranging from 0 to 4), with higher scores indicating more severe impairment. The maximum total UPDRS score is 199, indicating the worst possible disability from PD. The UPDRS demonstrates good reliability and validity as well as sensitivity to change.2, 3, 4, 5, 6 Several studies have examined its ability to track symptom progression over time, reporting rather wide ranges for annual score increases (total score, 3.0–14.0 points per year; Part I, 0.09 points per year; Part II, 0.3–4.7 points per year; Part III, 1.4–8.9 points per year).7, 8, 9, 10, 11 This lack of precision is likely because of the inclusion of a range of disease duration and severity, but it also may be related to inherent ambiguities in the administration and scoring of the UPDRS.
In 2001, the Movement Disorder Society (MDS) sponsored a task force to address such weaknesses of the UPDRS, including insensitivity to early motor impairment and inability to capture symptomatic impacts on daily living.12 The MDS‐sponsored revision of the UPDRS (MDS‐UPDRS), published in 2008, retained the 4‐subscale structure and 5‐point severity scale, but reorganized the subscales and added several items13: Part I, Non‐Motor Aspects of Experiences of Daily Living (13 items); Part II, Motor Aspects of Experiences of Daily Living (13 items); Part III, Motor Examination (33 items); and Part IV, Motor Complications (6 items). The maximum MDS‐UPDRS score is higher, given the additional items and scores for each body area, with a maximum score of 272.
The MDS‐UPDRS has been used increasingly to rate motor and non‐motor symptom severity in PD; however, analyses of how this revised scale changes over the course of early PD have not been well reported. The expected progression of the MDS‐UPDRS in patients with de novo, untreated PD is of particular importance, because it could help inform future clinical trials investigating the effect of neuroprotective agents. We have analyzed longitudinal data from the Parkinson's Progression Markers Initiative (PPMI) to determine the rates of motor and non‐motor clinical progression as measured by the MDS‐UPDRS in early, initially untreated PD. Effects of initiation of dopaminergic therapy on MDS‐UPDRS progression also were evaluated, because the majority of PPMI participants start receiving treatment during the course of follow‐up.
Patients and Methods
Study Population
Data used in the preparation of this article were obtained from the PPMI database (for up‐to‐date information on the study, visit http://www.ppmi-info.org). The PPMI is an international, multicenter, prospective study designed to discover and validate biomarkers of disease progression in newly diagnosed PD participants (National Clinical Trials identifier NCT01141023). Each PPMI recruitment site received approval from an institutional review board or ethics committee on human experimentation before study initiation. Written informed consent for research was obtained from all individuals participating in the study. Inclusion criteria for the PPMI consisted of a clinical diagnosis of PD, age older than 30 years, Hoehn and Yahr Stage 1 or 2, diagnosis within 24 months, and an abnormal 123I‐ioflupane single‐proton emission computed tomography scan at screening.
MDS‐UPDRS Data Extraction
PPMI data were accessed on January 11, 2017. PPMI participants were included in our analysis if they had completed a baseline evaluation and had at least 1 annual follow‐up visit (n = 362). Scores on MDS‐UPDRS Parts I through III (off medication scores for Part III) were drawn from the baseline visit and at 12‐month, 24‐month, 36‐month, 48‐month, and 60‐month follow‐up visits, as available. According to the PPMI protocol, an off‐state evaluation was defined as more than 6 hours after the last dose of dopaminergic therapy. A secondary analysis was performed by splitting the PPMI cohort into medicated and unmedicated groups based on the recorded presence or absence of dopaminergic therapy at an annual follow‐up visit. If a participant was taking a dopaminergic medication at the 12‐month follow‐up visit and stayed on medication for the rest of their time in the study, then they were included in the medicated group (n = 192). If a participant remained off any dopaminergic therapies by the 36‐month follow‐up visit, then they were included in the unmedicated group (n = 17).
The MDS‐UPDRS Part IV score was not analyzed as an independent subscore, because no participants were taking dopaminergic medication at their baseline visit, and these data were often missing in subsequent visits. When a Part IV score was available, it was included in the MDS‐UPDRS total score calculation. When a Part IV score was missing, it was treated as zero for the purposes of calculating total scores.
Sample Size Estimations
Reporting a significant difference in the expected rate of change in MDS‐UPDRS scores over time could provide a means to support disease‐modifying effects of a candidate therapeutic intervention for PD. To estimate sample sizes that would be required to detect a significant change in symptomatic progression between treatment groups in a hypothetical, placebo‐controlled study, sample power analyses were performed using MDS‐UPDRS Part III data from all participants who completed a 12‐month follow‐up visit (n = 318). At this time point, 195 participants had started dopaminergic therapy, and 123 had remained off medications. The mean and standard deviation values for the progression of MDS‐UPDRS Part III scores were calculated for the PPMI participants who either started treatment with dopaminergic medications or remained untreated at their 12‐month follow‐up visit. The untreated group was considered analogous to a placebo control group in a clinical trial, and the standard deviation of the treated group was used to estimate the variance of an active treatment group.
Statistical Analysis
Data were analyzed on an available case basis at baseline and at annual follow‐up visits. Summary statistics were obtained and data were checked for outliers and skewness with histograms, QQplots, boxplots, and graphs. Longitudinal MDS‐UPDRS scores were modeled using mixed‐model regression, with separate models created in which time was treated as a categorical or continuous linear variable. The categorical time model was free to follow any time trajectory. The mixed models used maximum likelihood estimation and unstructured covariance matrices.
Sample means and model estimates were graphed with respect to time to assess agreement and linearity of the time effect. Likelihood ratio goodness‐of‐fit tests and statistics, including the Akaike information criterion (AIC) and the Bayesian information criterion (BIC), were used to compare the continuous linear time longitudinal model with the categorical time longitudinal model. Various linear combinations of the model parameters were estimated and tested with t and F tests. Statistical analyses were performed using SAS 9.4 (SAS Institute, Inc. Cary, NC).
Results
Participant Characteristics
The 362 PD participants generated a total of 1656 individual MDS‐UPDRS scale measurements during the 60‐month follow‐up period, with an average follow‐up duration of 3.9 years. There were 1653 usable observations for Part I, 1654 usable observations for Part II, 1656 usable observations for Part III, and 1653 usable observations for the total score. Part IV was recorded for 1058 observations and was assumed to be zero otherwise. Demographic and clinical characteristics of the population are summarized in Table 1.
Table 1.
Demographic and Clinical Characteristics of Included Parkinson's Progression Markers Initiative Study Participants
| Mean ± SD | ||||||
|---|---|---|---|---|---|---|
| Baseline, N = 362 | Month 12, N = 318 | Month 24, N = 312 | Month 36, N = 317 | Month 48, N = 240 | Month 60, N = 107 | |
| Age, y | 61.3 ± 9.8 | |||||
| Sex: Women, % | 33.7 | |||||
| Treatment with dopaminergic medications, % | 0.0 | 57.9 | 83.3 | 90.9 | 95.4 | 90.7 |
| MDS‐UPDRS score | ||||||
| Total | 31.75 ± 12.99 | 38.33 ± 15.96 | 42.34 ± 17.31 | 45.78 ± 18.89 | 52.00 ± 22.43 | 54.89 ± 23.36 |
| Part I | 5.38 ± 3.97 | 6.74 ± 4.60 | 7.30 ± 4.84 | 8.06 ± 5.34 | 9.38 ± 6.02 | 9.84 ± 6.31 |
| Part II | 5.67 ± 4.13 | 7.27 ± 4.93 | 7.84 ± 5.25 | 8.57 ± 5.42 | 10.04 ± 6.64 | 10.73 ± 6.92 |
| Part III | 20.72 ± 8.85 | 24.11 ± 10.27 | 26.70 ± 11.26 | 28.37 ± 12.06 | 31.38 ± 12.84 | 32.54 ± 14.65 |
| Part IV | NA | 0.36 ± 1.20 | 0.60 ± 1.61 | 0.87 ± 1.85 | 1.34 ± 2.30 | 1.96 ± 2.51 |
Abbreviations: SD, standard deviation; MDS‐UPDRS: Movement Disorder Society‐Sponsored Revision of the Unified Parkinson's Disease Rating Scale; NA, not applicable.
Longitudinal Model Selection
For all models of MDS‐UPDRS scores (Parts I, II, III, and total), there was a statistically significant change over time for the expected values (P < 0.0001). Graphically, the estimates of the continuous linear time longitudinal models aligned well with the estimates from the categorical time longitudinal models, with their standard error bars largely overlapping. Differences between the means estimated by the categorical time and continuous linear time longitudinal models were typically only a few percentage points of the estimated means. There was also qualitatively good agreement between the sample means and the predictions of both longitudinal models.
Quantitatively, the likelihood ratio goodness‐of‐fit tests found that none of the linear continuous longitudinal models were statistically significantly worse fits than their counterpart categorical time longitudinal models at a univariate α = 0.05, despite the use of 4 fewer fixed‐effects parameters in the former than the latter. The tests for Part III and total were marginally nonsignificant (P = 0.085 and P = 0.092, respectively; P > 0.10 for all other scales). Post hoc testing with the BIC, which tends to favor simpler models compared with the AIC, improved by between 15.4 and 19.6, 3.8–4.9 per parameter) for the continuous linear longitudinal models compared with the categorical time longitudinal models. For Part I and Part II, AIC favored the continuous linear time longitudinal models compared with the categorical time longitudinal models by between 1.8 and 6.3 (0.46–1.6 per parameter). For Part III and total scores, the AIC favored the categorical time longitudinal model compared with the continuous linear time longitudinal model by 0.18 and 0.019 (0.044 and 0.005 per parameter), respectively, which are trivial differences. On the whole, these analyses supported approximating the time trend for progression of MDS‐UPDRS scale scores with lines.
MDS‐UPDRS Progression
The continuous linear time longitudinal model predicted an expected annual increase of 4.68 points (95% confidence interval [CI], 4.22–5.13 points) for the MDS‐UPDRS total score (Fig. 1). For the MDS‐UPDRS subscales, the model predicted an annual increase of 0.92 points (95% CI, 0.80–1.05 points per year) for Part I, 0.99 points (95% CI, 0.86–1.13 points per year) for Part II, and 2.40 points (95% CI, 0.210–2.70 points per year) for Part III. Changes in the MDS‐UPDRS total score were largely driven by changes in the MDS‐UPDRS Part III score, with the estimated slope for Part III accounting for 51% of the estimated slope for the total score.
Figure 1.
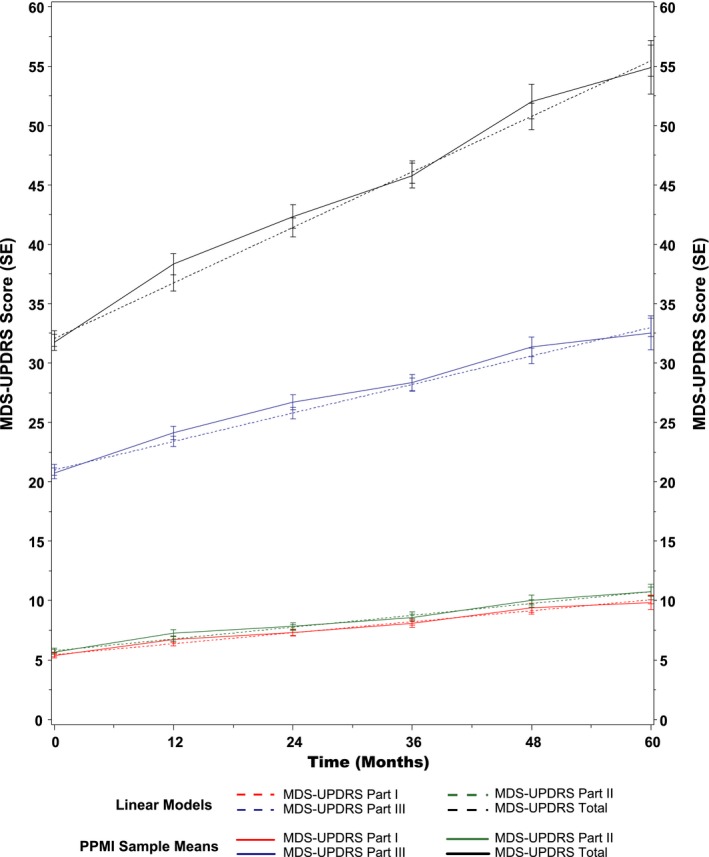
Progression of scores on Parts I, II , III , and total of the Movement Disorder Society‐Sponsored Revision of the Unified Parkinson's Disease Rating Scale ( MDS ‐ UPDRS ) in the Parkinson's Progression Markers Initiative ( PPMI ) cohort. SE indicates standard error.
Dopaminergic medication effects on MDS‐UPDRS Part III progression
The continuous linear time longitudinal model predicted an expected annual increase of 1.77 points (95% CI, 1.35–2.19 points per year) for MDS‐UPDRS Part III for the medicated group. For the unmedicated group, Part III scores were predicted to increase by 4.02 points per year (95% CI, 2.95–5.10 points per year). There was a statistically significant difference in the slopes for MDS‐UPDRS Part III progression between the medicated and unmedicated groups, with an estimated difference of 2.25 points per year (95% CI, 1.11–3.39 points per year). For the progression of both groups, there was no statistically significant deviation from linearity (medicated group, P = 0.80; unmedicated group, P = 0.33) (Fig. 2).
Figure 2.
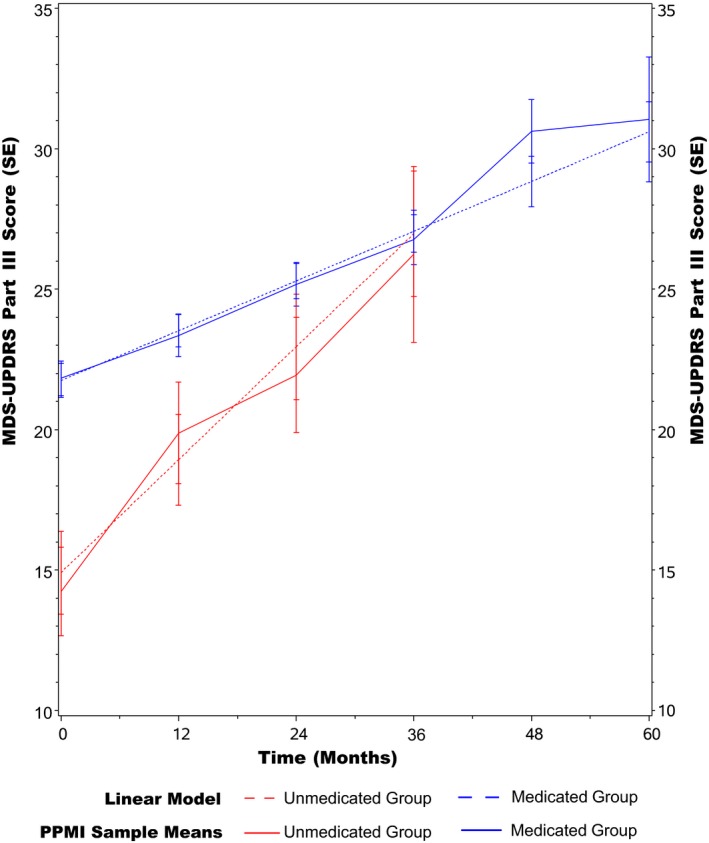
Progression of scores on Part III (motor part) of the Movement Disorder Society‐Sponsored Revision of the Unified Parkinson's Disease Rating Scale ( MDS ‐ UPDRS ) in the medicated and unmedicated Parkinson's Progression Markers Initiative ( PPMI ) groups. SE indicates standard error.
Sample size estimation for disease‐modifying therapy clinical trial
The mean MDS‐UPDRS Part III change over 1 year for those PPMI participants who were not receiving dopaminergic therapy at the 12‐month follow‐up visit (n = 123) was 6.35 ± 6.6 points. For the participants who were receiving dopaminergic therapy at the 12‐month follow‐up visit (n = 195), the mean change in MDS‐UPDRS Part III was 1.54 ± 9.0 points. As such, a significant change of less than 6.35 points at 1 year in a treated group might indicate a modification of motor symptoms. The minimal clinically important change in MDS‐UPDRS Part III scores, however, was recently defined as −3.3 points for detecting a significant improvement and +4.6 points for detecting a significant decline.14 Thus, detecting a mean change in MDS‐UPDRS Part III scores in a treated group of approximately 4 points in a clinical trial could support the investigated treatment as a clinically meaningful intervention. Based on these data, representative sample sizes for a hypothetical, 1‐year, placebo‐controlled clinical trial were calculated and are presented in Table 2, using an α of 0.05.
Table 2.
Sample Size Estimations for the Detection of Disease Modification in a Hypothetical 1‐Year Placebo‐controlled Clinical Trial
| Symptomatic Change in Treated Group | Mean Change in MDS‐UPDRS Part III in Treated Group at 1 Year (Treatment Effect, % Attenuation)* | Total Sample Size [Per Group] |
|---|---|---|
| Slowing of progression | +4 (−2.35, 37%) +2 (−4.35, 69%) | 480 [240] 142 [71] |
| Halting of progression | 0 (−6.35, 100%) | 68 [34] |
| Reversal of progression | −2 (−8.35, 131%) −4 (−10.35, 163%) | 40 [20] 28 [14] |
Abbreviations: MDS‐UPDRS: Movement Disorder Society‐Sponsored Revision of the Unified Parkinson's Disease Rating Scale.
Calculations were based on assumptions of 90% power; a mean ± standard deviation progression of 6.35 ± 6.66 points on MDS‐UPDRS Part III for the untreated (control) group, as observed in Parkinson's Progression Markers Initiative (PPMI) participants who were not taking dopaminergic medication at 1 year; and a standard deviation of 9.00 points on MDS‐UPDRS Part III for the treated group, as observed in PPMI participants who were taking dopaminergic medication at 1 year. Sample size was allocated equally to the treatment and control groups and assumed that data from all participants were valid and usable.
Discussion
In this study, we analyzed longitudinal data from the PPMI database to determine the progression of MDS‐UPDRS scores in a large cohort of patients with de novo PD who were followed for up to 5 years. The total MDS‐UPDRS and MDS‐UPDRS Parts I, II, and III scores each increased in a linear fashion, demonstrating a measured yet continual advancement of motor and non‐motor symptoms in the early years after PD diagnosis. On average, the MDS‐UPDRS total score increased by an estimated 4.7 points per year. Although our findings are consistent with the more conservative estimates of yearly progression from previous studies that used the older UPDRS scale,8, 9, 10 the rate of progression observed in the PPMI cohort was lower than that described in previous studies10, 15 that used UPDRS scores from the DATATOP (Deprenyl and Tocopherol Anti‐oxidative Therapy on Parkinsonism)16 and ELLDOPA (Earlier vs Later L‐DOPA)17 cohorts. Although both of those landmark studies and the current PPMI initiative enrolled newly diagnosed, initially untreated patients with PD, it has been nearly 30 years since the DATATOP findings were originally published. It is possible that, over the past several decades, advances have been made in overall public health and wellness that are impacting symptom progression in PD, separate from dopaminergic therapies. Another possibility is that the revised MDS‐UPDRS limits over‐estimation of disability through more detailed instructions and itemized scores.
In contrast to our findings, one 8‐year longitudinal study by Vu and colleagues indicated that a nonlinear mixed‐effects model for UPDRS scores was superior to a linear model.18 These differing results could stem from their inclusion of more advanced PD participants and the tendency of treated motor symptoms to trend toward a more stable state, or from differences between the UPDRS and the MDS‐UPDRS. Future evaluation of the PPMI cohort after more time has passed could help determine whether symptom severity progression continues in a linear manner beyond the first 5 years after diagnosis. However, in support of our results, another recent study reported a linear progression in MDS‐UPDRS scores over time.19 Gottipati and colleagues studied the PPMI cohort and utilized an Item Response Theory model to determine that a typical participant's MDS‐UPDRS total score (excluding Part IV) increases linearly by 1 standard deviation (estimated at 13.1 points) in 50 months.19 This equates to a change of 3.1 points per year for the MDS‐UPDRS total score, which lies close to our estimation using alternate methodology.
In those participants with PD who were taking dopaminergic medications at their 12‐month visit (the medicated group), a slower, yet still linear, expected MDS‐UPDRS Part III score progression of 1.8 points per year over 5 years was observed. Although the sample size was small, the PD participants who were not taking dopaminergic medications by their 36‐month visit (the unmedicated group) progressed at about 4 points per year on their MDS‐UPDRS Part III over their first 3 years after enrollment in the PPMI study. This more rapid progression in the unmedicated group could support the hypothesis that early dopaminergic therapy leads to slower disease progression. Importantly, however, the MDS‐UPDRS III data included in this analysis were all taken in the off medication state, which in the PPMI was defined as only more than 6 hours past the last dose of dopaminergic therapy. Therefore, the slower decline in the medicated group could simply stem from the use of dopaminergic medications with longer half‐lives or the well‐described long‐duration response to levodopa.20
Delineation of the expected change in MDS‐UPDRS Part III scores is vital in estimating effect sizes for future disease‐modification treatment trials, because this has increasingly become the motor outcome measure of choice in clinical trials. By using the PPMI database and separating PD participants who were taking dopaminergic medication at 12 months from those who remained untreated, we have calculated the sample sizes required to detect potential disease modification. Given an observed MDS‐UPDRS Part III progression of approximately 6 points over 1 year in the untreated PPMI cohort, and assuming a minimal clinically important difference in this scale of approximately 4 points,14 a mean change in the MDS‐UPDRS Part III score of +2 points at 1 year in a treated group could indicate that treatment led to a clinically meaningful slowing of disease progression. The sample size needed to accomplish this with 90% power would be 142 (71 per group). This information could be helpful in the design of future clinical trials aimed at slowing, or even reversing, the disease course in PD.
Strengths of our study include the large number of participants, including 362 participants who had de novo PD with longitudinal data available for inclusion. Our findings also are likely generalizable to the larger PD population, given the relatively limited exclusion criteria of the PPMI study. By tracking the progression of early, initially untreated PD and including only Part III scores in the off‐medication state, potential confounding from medication effects at baseline assessments has been reduced. Nevertheless, a potential limitation of our study is that over 90% of participants were taking dopaminergic medications by the 36‐month visit. We attempted to address this limitation by performing additional analyses on separate medicated and unmedicated groups. Another limitation to our study is that our results are not directly applicable to any single individual patient, because we did not perform additional subgroup analyses based on baseline characteristics, such as age, sex, sidedness of predominant symptoms, etc. Regardless, our group‐level analyses and medicated cohort subanalysis can be used to estimate symptom progression at the population level.
In conclusion, our findings demonstrate the expected progression of MDS‐UPDRS total and subscale scores over a 5‐year period in patients with de novo PD. Continuing work to define expected symptom progression with this increasingly utilized and validated scale could assist in the interpretation of MDS‐UPDRS scores for individual patients and may serve counseling and prognostication purposes.
Author Roles
1. Research Project: A. Conception, B. Organization, C. Execution; 2. Statistical Analysis: A. Design, B. Execution, C. Review and Critique; 3. Manuscript Preparation: A. Writing the First Draft, B. Review and Critique.
S.K.H: 1B, 1C, 2A, 3B
T.F.: 1B, 1C, 3A, 3B
S.H.S.: 2A, 2B, 3B
B.D.B: 1A, 1B, 1C, 2A, 3A, 3B
Disclosures
Ethical Compliance Statement: We confirm that we have read the Journal's position on issues involved in ethical publication and affirm that this work is consistent with those guidelines.
Funding Sources and Conflict of Interest: Samantha K. Holden has received research grant support from the Michael J. Fox Foundation for Parkinson's Research. Brian D. Berman has received research grant support from the National Institutes of Health (NIH) (NIH/National Center for Advancing Translational Sciences Colorado Clinical and Translational Sciences Institute grant KL2 TR001080), the Dystonia Coalition (which receives the majority of its support through NIH grant NS065701 from the Office of Rare Diseases Research in the National Center for Advancing Translational Science and National Institute of Neurological Disorders and Stroke), the Dana Foundation, and the Benign Essential Blepharospasm Research Foundation. Taylor Finseth and Stefan H. Sillau reported no sources of funding and no conflicts of interest.
Financial Disclosures for the previous 12 months: The authors report no sources of funding and no conflicts of interest.
Acknowledgments
We thank the Parkinson's Progression Markers Initiative, a public‐private partnership, which is funded by the Michael J. Fox Foundation for Parkinson's Research and its funding partners including AbbVie, Avid Radiopharmaceuticals, Biogen, Bristol‐Myers Squibb, Covance, GE Healthcare, Genentech, GlaxoSmithKline, Lilly, Lundbeck, Merck, Meso Scale Discovery, Pfizer, Piramal, Roche, Servier, and UCB.
Relevant disclosures and conflicts of interest are listed at the end of this article.
References
- 1. Katz R. Biomarkers and surrogate markers: an FDA perspective. NeuroRx 2004;1:189–195. [DOI] [PMC free article] [PubMed] [Google Scholar]
- 2. Ramaker C, Marinus J, Stiggelbout AM, Van Hilten BJ. Systematic evaluation of rating scales for impairment and disability in Parkinson's disease. Mov Disord 2002;17:867–876. [DOI] [PubMed] [Google Scholar]
- 3. Martinez‐Martin P, Gil‐Nagel A, Gracia LM, Gomez JB, Martinez‐Sarries J, Bermejo F. Unified Parkinson's Disease Rating Scale characteristics and structure. The Cooperative Multicentric Group. Mov Disord 1994;9:76–83. [DOI] [PubMed] [Google Scholar]
- 4. Rabey JM, Bass H, Bonuccelli U, et al. Evaluation of the Short Parkinson's Evaluation Scale: a new friendly scale for the evaluation of Parkinson's disease in clinical drug trials. Clin Neuropharmacol 1997;20:322–337. [PubMed] [Google Scholar]
- 5. Stebbins GT, Goetz CG, Lang AE, Cubo E. Factor analysis of the motor section of the Unified Parkinson's Disease Rating Scale during the off‐state. Mov Disord 1999;14:585–589. [DOI] [PubMed] [Google Scholar]
- 6. van Hilten JJ, van der Zwan AD, Zwinderman AH, Roos RA. Rating impairment and disability in Parkinson's disease: evaluation of the Unified Parkinson's Disease Rating Scale. Mov Disord 1994;9:84–88. [DOI] [PubMed] [Google Scholar]
- 7. Jankovic J, Kapadia AS. Functional decline in Parkinson disease. Arch Neurol 2001;58:1611–1615. [DOI] [PubMed] [Google Scholar]
- 8. Alves G, Wentzel‐Larsen T, Aarsland D, Larsen JP. Progression of motor impairment and disability in Parkinson disease: a population‐based study. Neurology 2005;65:1436–1441. [DOI] [PubMed] [Google Scholar]
- 9. Maetzler W, Liepelt I, Berg D. Progression of Parkinson's disease in the clinical phase: potential markers. Lancet Neurol 2009;8:1158–1171. [DOI] [PubMed] [Google Scholar]
- 10. Holford NH, Chan PL, Nutt JG, Kieburtz K, Shoulson I. Parkinson Study Group. Disease progression and pharmacodynamics in Parkinson disease–evidence for functional protection with levodopa and other treatments. J Pharmacokinet Pharmacodyn 2006;33:281–311. [DOI] [PubMed] [Google Scholar]
- 11. Aarsland D, Ballard C, Walker Z, et al. Memantine in patients with Parkinson's disease dementia or dementia with Lewy bodies: a double‐blind, placebo‐controlled, multicentre trial. Lancet Neurol 2009;8:613–618. [DOI] [PubMed] [Google Scholar]
- 12. Movement Disorder Society Task Force on Rating Scales for Parkinson's Disease . The Unified Parkinson's Disease Rating Scale (UPDRS): status and recommendations. Mov Disord 2003;18:738–750. [DOI] [PubMed] [Google Scholar]
- 13. Goetz CG, Tilley BC, Shaftman SR, et al. Movement Disorder Society‐sponsored revision of the Unified Parkinson's Disease Rating Scale (MDS‐UPDRS): scale presentation and clinimetric testing results. Mov Disord 2008;23:2129–2170. [DOI] [PubMed] [Google Scholar]
- 14. Horvath K, Aschermann Z, Acs P, et al. Minimal clinically important difference on the motor examination part of MDS‐UPDRS. Parkinsonism Relat Disord 2015;21:1421–1426. [DOI] [PubMed] [Google Scholar]
- 15. Chan PL, Nutt JG, Holford NH. Levodopa slows progression of Parkinson's disease: external validation by clinical trial simulation. Pharm Res 2007;24:791–802. [DOI] [PubMed] [Google Scholar]
- 16.[No authors listed.] DATATOP: a multicenter controlled clinical trial in early Parkinson's disease. Parkinson Study Group. Arch Neurol 1989;46:1052–1060. [DOI] [PubMed] [Google Scholar]
- 17. Fahn S. Parkinson disease, the effect of levodopa, and the ELLDOPA trial. Earlier vs Later L‐DOPA. Arch Neurol 1999;56:529–535. [DOI] [PubMed] [Google Scholar]
- 18. Vu TC, Nutt JG, Holford NH. Progression of motor and nonmotor features of Parkinson's disease and their response to treatment. Br J Clin Pharmacol 2012;74:267–283. [DOI] [PMC free article] [PubMed] [Google Scholar]
- 19. Gottipati G, Karlsson MO, Plan EL. Modeling a composite score in Parkinson's disease using item response theory. AAPS J 2017;19:837–845. [DOI] [PubMed] [Google Scholar]
- 20. Anderson E, Nutt J. The long‐duration response to levodopa: phenomenology, potential mechanisms and clinical implications. Parkinsonism Relat Disord 2011;17:587–592. [DOI] [PubMed] [Google Scholar]