

Abstract
Background
Historically, single port valveless pneumatic blood pumps have had a high incidence of thrombus formation due to areas of blood stagnation and hemolysis due to areas of high shear stress.
Methods
To ensure minimal hemolysis and favorable blood washing characteristics, Particle Image Velocimetry (PIV) and Computational Fluid Dynamics (CFD) were used to evaluate the design of a new single port, valveless counterpulsation device (Symphony). The Symphony design was tested in 6-hour acute (n=8), 5-day (n=8) and 30-day (n=2) chronic experiments in a calf model (Jersey, 76 kg). Venous blood samples were collected during acute (hourly) and chronic (weekly) time courses to analyze for temporal changes in biochemical markers and quantify plasma free hemoglobin. At the end of the study, animals were euthanized and the Symphony and end-organs (brain, liver, kidney, lungs, heart, and spleen) were examined for thrombus formations.
Results
Both the PIV and CFD showed the development of a strong moving vortex during filling phase and that blood exited the Symphony uniformly from all areas during ejection phase. The laminar shear stresses estimated by CFD remained well below the hemolysis threshold of 400 Pa inside the Symphony throughout filling and ejection phases. No areas of persistent blood stagnation or flow separation were observed. The maximum plasma free hemoglobin (< 10 mg/dl), average platelet count (pre-implant = 473 ± 56 K/μL and post-implant = 331 ± 62 K/μL), and average hematocrit (pre-implant = 31 ± 2 % and post-implant = 29 ± 2 %) were normal at all measured time-points for each test animal in acute and chronic experiments. There were no changes in measures of hepatic function (ALP, ALT) or renal function (creatinine) from pre-Symphony implantation values. The necropsy examination showed no signs of thrombus formation in the Symphony or end organs.
Conclusions
These data suggest that the designed Symphony has good washing characteristics without persistent areas of blood stagnation sites during the entire pump cycle, and has a low risk of hemolysis and thrombus formations.
Keywords: heart failure, counterpulsation device, flow visualization, CFD, PIV, hemolysis
I. Introduction
In patients with heart failure, mechanical circulatory support promotes favorable myocardial remodeling and prolongs life [1–3]. Counterpulsation devices such as the intraaortic balloon pump (IABP) provide afterload reduction, augment coronary artery perfusion, and decrease ventricular workload thereby improving overall cardiac function[4]. However, chronic IABP therapy is not feasible for long-term support because of vascular complications, limited patient mobility and quality of life during support[4]. Alternatively, pulsatile and continuous flow left ventricular assist devices (LVADs) directly unload the LV and transfer blood from the failing ventricle into the aorta to restore end-organ blood flow. However, LVADs require extensive surgery and ongoing close monitoring, and are associated with a variety of both short- and long-term complications [3, 5, 6]. Currently, LVADs are reserved as a final treatment option for patients with advanced, chronic end-stage heart failure in specialized centers as either a bridge-to-transplant (BTT) or destination therapy (DT) [7].
To address the paucity of mechanical circulatory support options available to patients with advanced heart failure, and as a potential means of promoting myocardial recovery in this patient population, we are developing a novel and minimally-invasive arterial counterpulsation device (Symphony, SCR Inc., Louisville, KY). The Symphony can be implanted and explanted with minimal trauma using a surgical approach that avoids the need to enter the thoracic cavity. The core component of the Symphony device is a valveless, single port 30 ml stroke volume polyurethane-lined blood chamber (Figure 1, right), which is designed to fit comfortably in a small subcutaneous pocket on the right side of the anterior chest (Figure 1, left) [8–11]. The valveless design of Symphony could be an advantage compared to pulsatile ventricular assist devices. Pulsatile blood pumps have a separate inflow and outflow cannula with valves. This may result in an area of blood stagnation near the inflow cannula during device ejection, and an area of blood stagnation near the outflow cannula during device filling. Valves may also cause areas of flow separation, turbulence, and local areas of high shear stress leading to hemolysis [12], which has led to numerous attempts to improve valve hemodynamics [13, 14]. The Symphony has no valves and a single graft that acts as both inflow and outflow. The bidirectional flow in the Symphony graft prevents blood stagnation in the cannula during the filling and ejection phases of the Symphony.
Figure 1.

The minimally invasive counterpulsation device (Symphony) is designed for the chronic treatment of heart failure and to promote myocardial recovery. The Symphony is implanted in a subcutaneous pocket in the right anterior chest contralateral to an implantable cardioverter defibrillator. A percutaneous driveline exits the anterior chest at the midclavicular line just below the right costal arch and attaches to an external pneumatic driver. The (1) counterpulsation blood chamber (right) fills during native systole and empties during native diastole through a (2) single, valveless ePTFE graft anastomosed to the subclavian artery. A polyurethane membrane in the air chamber is inflated/deflated by an (3) airline connected to an external pneumatic driver.
The pumping chamber is connected to the systemic circulation by a short ePTFE graft anastomosed to the right axillary artery. A percutaneous driveline runs from the blood chamber to a small wearable pneumatic external driver. During ventricular systole, the driver evacuates air from the air chamber, thus removing blood from the circulation and reducing cardiac work. During ventricular diastole, the Symphony ejects blood volume in the blood chamber retrograde into the circulation providing diastolic augmentation and improving coronary perfusion [8–11].
Minimizing risk of thrombosis and hemolysis is crucial in the design of any blood pump [15, 16]. Historically, single port valveless pneumatic blood pumps like the Symphony have had a high incidence of thrombus formation due to areas of blood stagnation (inadequate “washing out”) and hemolysis due to areas of high shear stress. To minimize complications associated with blood stasis and thrombosis, the Symphony has been designed to have a constant but moving vortex within the blood reservoir that continuously “washes” the inside of the Symphony. The valveless inflow/outflow graft connects seamlessly to the reservoir to reduce thrombus nucleation at the interface between the graft and the reservoir, and reinforcement rings line the graft to prevent kinking [8–11].
In this manuscript, the results of a particle image velocimetry (PIV) study, computational fluid dynamics (CFD) model, and acute and chronic animal experiments are presented. These test models were used to evaluate the flow dynamics and biocompatibility of the Symphony. CFD and PIV are standard tools of the fluid mechanics recommended for the development and optimization of artificial organs in the draft for combined International (ISO 5840) and European standards (EN 12006-1) for cardiovascular implants. Animal models validate flow visualization models and provide supporting evidence of artificial organ functionality, including hemolysis and thrombosis. The PIV study focused on the flow in the blood chamber, especially during pump ejection and filling in order to identify potential area(s) at risk for persistent blood stagnation that may promote thrombus formation. CFD was used primarily to assess order and regions of high shear stresses, with a primary focus in the graft where the highest shear stresses were anticipated. The PIV assessment of shear stress in the complex curved graft geometry was not performed due to the experimental complexity and measurement uncertainty. The risk of hemolysis and thrombosis for the Symphony design was quantified during 6-hour acute (n=8) and chronic 5-day (n=8) and 30-day (n=2) animal experiments in a bovine model.
II. Methods
Particle Image Velocimetry Study
The PIV study of the Symphony was performed in an instrumented mock circulation system assembled on an optical table, Figure 2. The Symphony was driven by a pneumatic driver (LB Engineering, Berlin, Germany) and connected with a graft to the mock circulation system to mimic a mean aortic pressure of 90 mmHg in the human circulatory system. We varied the support mode between 1:1 and 1:2 and used filling durations of 100ms, 250ms, 500ms and 850ms to analyze the influence of Symphony driving parameters.
Figure 2.

(a) Schematic of the experimental setup used to conduct the PIV studies: 1 – Mock circulation system (Windkessel), 2 – Symphony in the acrylic box filled with a fluid in order to adapt the refractive index and connected by a graft to the Windkessel. The graft was shaped as shown in Figure 3, 3 – laser light sheet of 1 mm thickness, and 4 – optic generating laser light sheet. P marks the pressure sensor measuring the Windkessel air pressure. H represents the hydrostatic pressure, which along with the Windkessel air pressure simulates the physiological arterial pressure of 90 mmHg.
(b) The thick black line shows the position of the 1 mm wide laser light sheet; the dotted line shows where the two halves of the blood pump are connected. To avoid optical distortion, the laser light sheet was placed 1 mm aside the center layer where the two halves of the blood pump are connected.
A blood analog solution consisting of a mixture of water (62.5%) and glycerin (37.5%) was used to simulate the Newtonian kinematic blood viscosity (3.5x10⁻⁶ m2/s of the test fluid measured at 22°C) and to approximate the refractive index of the fluid (n=1.45) to that of the blood pump (Polyurethane, n=1.47). Reflective, silver coated hollow ceramic spheres (CONDUCT-O-FIL AGSL 150-30 TRD, Potters Industries Inc., Carlstadt, USA) with a diameter of 75 μm were added to the blood analog solution for flow visualization. The particles with a density of 1.1 g/cm3 were neutrally buoyant in the blood analog solution. A Quantum laser at 0.65 W was applied to generate the laser sheet and a high speed camera (Redlake MotionPro X3, Integrated Design Tools Inc., Tallahassee, USA) with a frame rate of 2080 fps and a resolution of 1280x1024 pixels was used to assess the flow patterns. During the experiments an online-measurement of the pressure in the Windkessel was realized with a resolution of 0.048 ms via a LabView data acquisition setup (National Instruments Inc., Austin, Texas, USA). The same system was used to trigger the camera for a synchronization of images and pressure data.
The acquired images were post-processed by subtracting the background and the flow field was estimated using a cross-correlation algorithm with a descending window size (interrogation area) of 128x128 to 32x32 pixel in 3 iterations and a window overlap of 50% using DaVis 6.2 software (La Vision, Goettingen, Germany). The resulting vectors were averaged over five consecutive time steps (1/416 s) and imported into the flow visualization software (AMIRA™, Mercury Computer Systems Inc., Chelmsford, USA) to visualize and quantify magnitude and directions of the velocity vectors. Vector fields were used to represent the flow directions and magnitudes of the flow. Flow features were shown using line integrated convolution (LIC) technique to allow for visualization of flow streamlines and an extracting of flow features including stagnation points, lines, saddles, and vortices.
Computational Fluid Dynamics Study
The CFD study was performed using a simplified model simulating four discrete time-steps of the pump cycle without modeling the moving membrane. These quasi steady state simulations allow for an estimation of the flow behavior in the curved graft and the order of the maximum wall shear stress and turbulent kinetic energy, which are not assessed by PIV.
Geometry and Mesh Generation
The pouch lumen of the CPD model used in the CFD studies was generated from computer-aided design (CAD) manufacturing data (Figure 3), which was also used to manufacture CPDs used in the PIV and animal experiments. The positions of the membrane for four discrete time steps used in the quasi- steady state simulations are shown in Figure 3. In the two end positions the membrane touches the housing in the center of the device, but always leaves a circular flow path open along the periphery of the device. Between these two positions the center of the membrane shows a maximum travel distance (H) of 25 mm. Cadaver fit study data (n=12) were used to determine the graft length, the graft bend, and the anastomosis angle to the axillary artery. The axillary artery was simulated as a straight tube with an inner diameter of 7 mm. The curved graft with a length of 120 mm and an inner diameter of 10 mm connects the pouch to the axillary artery. An anastomosis angle of 50° between the graft and the vessel with an oval-shaped anastomosis has been modeled. The distance between the central axis of the outlet of the pouch and the central axis of the axillary artery was 29 mm.
Figure 3.

Geometry of the Symphony chamber with the graft anastomosed to the axillary artery and the pump membrane (blue surface) at nearly full empty position (top left) and full filled position (top right). A detailed view of the surface mesh generated for the blood chamber with the pre-processor Gambit® to conduct the CFD study (bottom left). Bottom right subfigure shows curves representing the membrane shapes for the fully emptied condition (red line) and for the fully filled condition (blue line). The dotted blue and red lines indicate the two membrane positions used for the CFD simulation. The blue dotted line shows the membrane position shortly after the start of emptying and shortly before the end of filling. The red dotted line shows the membrane position close to the end of emptying and shortly after start of filling. The black line represents the difference between two end positions of the membrane.
A computational mesh of the Symphony and the graft anastomosed to the axillary artery was generated using the pre-processor GAMBIT® (Ansys, Inc., Canonsburg, PA, USA) (Figure 3). The membrane was meshed with a node distance of 0.5 mm resulting in about 20,000 triangles meshing the membrane. The inner volumes of the blood chamber and pouch-graft anastomosis were meshed using 936,000 tetrahedral cells with 174,000 nodes for the end diastolic stage of the membrane (nearly fully filled) and using 517,500 cells with 106,000 nodes for the end systolic stage (nearly fully empty). The graft and axillary artery were meshed using 59,000 hexahedral cells in order to reduce the number of cells, while the graft-artery anastomosis was meshed using 50,000 tetrahedral cells. The total number of nodes used in the graft and artery were 74,000. The mesh quality was verified by measuring the cell skewness, which was below 0.75 in the worst cell indicating a very good mesh quality. The aspect ratio of cells in both generated meshes was less than 6.
CFD Simulation
Both the filling and ejection phases of the Symphony were simulated using a simplified CFD model. The moving membrane was simulated as an inlet-velocity boundary with imposed velocity profiles corresponding to the velocity of the moving membrane at respective time-points. The imposed velocity profile simulating the vertical movement of the membrane was equal to the black curve in Figure 3 (bottom right) representing the absolute difference between two membrane end-positions. Scaling this curve by a constant factor (positive for the ejection phase or negative for filling phase) allowed for the simulation of desired flow rates. Both ends of the axillary artery model were simulated with zero surface traction. Quasi steady CFD simulations were performed with four flow rate boundary conditions during the following phases of Symphony filling and ejection – (1) Initial filling phase – 15 ms after the start of filling – with a flow rate of 350 ml/s, (2) End of filling phase – 85 ms after the start of filling – with a flow rate of 270 ml/s, (3) Initial ejection phase – 15 ms after the start of ejection – with a flow rate of 350 ml/s, and (4) End of ejection phase – 85 ms after the start of ejection – with a flow rate of 270 ml/s. The Symphony output, calculated as the volume between two end positions of the membrane (red and blue lines in Figure 3) during 100 ms, indicates an average flow rate of 300 ml/s. The output volume of 30 ml was also equal to the volume integration of the black curve shown in Figure 3 (bottom right). The computations were performed using the CFD-Solver (FLUENT®) with a second order upwind discretization scheme for the convective terms of the Navier-Stokes equations. The SIMPLEC pressure-velocity correction method was used during steady simulations. The blood was modeled as a Newtonian fluid with a kinematic viscosity of ν=3.5x10⁻⁶ m2/s. As the local Reynolds number in the axillary artery may exceed 6,000, a standard k-ε turbulence model was used with a low turbulence intensity of 3%. A no-slip boundary condition was set at all solid boundaries. Mesh-independence of the CFD study was verified by doubling the number of cells. Importantly, there was no significant range for the variability of cell numbers in frames of turbulent model requirements for the near wall region. Mesh quality, choice of turbulence model and solution convergence of the CFD study followed the FLUENT Guide for good CFD practice: mesh near the wall was in the range of 1 < y+ < 5 (y+ is the height of the non-dimensional viscous sub-layer) as required by the turbulence model used in this simulation, which proves mesh independence. Convergence was based on balance of flow and integrated parameters. Convergence of velocities and pressures were demonstrated in addition to the convergence of residuals in the graft and the blood chamber.
Animal Study
All animals were handled humanely in accordance with NIH and University of Louisville animal care committee guidelines. Experimental procedures followed animal study protocols were approved by the University of Louisville Institutional Animal Care and Usage Committee.
Surgical Preparation
Male calves (Holstein and Jersey, weight 63–101 kg, mean: 76 kg) were anesthetized with isoflurane (3–5%) and room air, and anticoagulated with intravenous heparin (3mg/kg). Calves weighing ~80 kg were selected for this study because both the size of the carotid artery (8 mm) and the distance from the anastomosis to the aortic valve (14 cm) approximate human anatomical dimensions (axillary artery: 8 mm diameter, 12 cm distance to the aortic valve). Fluid-filled arterial and venous catheters were placed in the right carotid artery and jugular vein for blood sampling. A left thoracotomy was performed and the 4th and 5th ribs were resected. A 10 mm ePTFE vascular graft (Atrium) was anastomosed to the left carotid artery and attached to the 30mL Symphony with a quick-connect as previously described [8–11]. An ECG recorded from two intracardiac screw-in leads (Medtronic) installed in the anterolateral left ventricle triggered the Symphony. Output timing was adjusted according to the aortic blood pressure tracing to maximize diastolic arterial pressure augmentation. The Symphony was timed to fill during LV systole and eject during diastole immediately after the aortic dicrotic notch.
Measurements
Blood samples were drawn to analyze changes in biochemical markers and quantify plasma free hemoglobin, platelet count, and hematocrit during 6-hour acute (n=8), 5-day chronic (n=8), and 30-day chronic (n=2) experiments. Venous blood samples (5 ml) were collected at baseline (pre-cannulation), hourly (1, 2, 3, 4, 5, and 6 hrs) after initiating Symphony support (acute and chronic), daily (5-day chronic), and weekly (30-day chronic). Blood samples were centrifuged at 6000 rpm for 15 minutes to obtain serum samples for quantifying Plasma Free Hemoglobin (PFHb) using a Plasma Photometer (HemoCue, Mission Viejo, CA). Two blood samples taken at each time point, and all the final PFHb value for each time point was calculated as the average of the two PFHb values obtained from the blood samples at that time point. Blood samples were also used to quantify platelet count (PLT) and hematocrit (HCT) measured using CDC Mascot (CDC Technologies, Oxford, CT).
Necropsy
At the completion of the experiment, the Symphony and graft were removed, visually inspected for gross evidence of thrombus, fracture and other defects, and photographed. Peripheral organs (liver, brain, kidney, lungs, spleen, and heart) were removed, sectioned into 3 mm strips, and examined for gross evidence of thrombus-related vascular infarction.
III. Results
Particle Image Velocimetry
The results presented here focus on the 1:2 support mode with 250ms pump filling and a long pause between two pump cycles simulating a high risk condition for blood flow stagnation. Only one clinically relevant representative result is shown, as the variation of support mode and filling times showed no significant differences between flow patterns and regions of blood flow stagnation.
Figure 4 shows the marked time steps, pressures and tangential velocities of the Symphony pumping cycle during PIV. The period between each time step was 250ms with the 8th time step overlapping in the next pump cycle. During Symphony filling, PIV showed the development of a strong, steadily rotating vortex extending over the complete blood pump with a moving centre indicating adequate washout (Figure 5). Similar flow patterns were observed for other filling times, as shown in Figure 6 (time step 3). PIV results were not obtained for time step 2 because the Symphony membrane crosses the laser light sheet for a short time period (~10 ms - a small part of the combined ejection and filling phases). During this time interval reduced flow velocities were observed in the pump chamber with a small residual volume (~7 ml). The vorticity of the moving vortex in the Symphony declined very slowly after the completion of filling resulting in a prolonged washout of the Symphony without membrane movement. The vortex vorticity was quantified by the mean tangential velocity, which was the mean velocity in an annular area covering 60% to 90% of the pouch radius of 25.43 mm (Figure 7, left). A significant tangential velocity and an actively rotating vortex were observed in the Symphony even after 1.2 seconds of the completion of the Symphony filling, indicating adequate washout even in the 1:2 support mode (Figure 7, right). During the Symphony ejection, the fluid exited the Symphony uniformly from all areas, indicating good washing in the Symphony. Symphony ejection resulted in counter-rotating flow fields in the outer flow channel, inhibiting the development of a stable vortex in this area. Further, the flow generated by Symphony ejection disrupts the vortex formed during the Symphony filling phase.
Figure 4.

Upper image shows pressure curve in the Symphony during PIV study with marked time steps. Lower image shows an analysis of the mean tangential velocity (black line) with standard deviations (grey lines) during the pump cycle. Period between each time step is 250ms with the 8th time step overlapping in the next pump cycle.
Figure 5.

Velocity vectors (left), line integrated convolution pictures showing flow streamlines (center), and maximum-minimum images (right) obtained from PIV study during different phases. Selected time steps are shown in figure 4. The PIV data showed the formation of a large moving vortex during Symphony filling and uniform outflow during Symphony ejection, confirming the CFD calculations. Time step 2 is not presented, as the membrane crosses the laser light sheet and hence PIV results could not be obtained. The time steps 5–7 show a flow pattern very similar to step 4 with slowly declining velocities.
Figure 6.

PIV study results with line integrated convolution showing flow streamlines for time step 3 (see figure 4) at different filling time settings (200 ms – A, 300 ms – B, 500 ms – C, and 850 ms – D).
Figure 7.

Left: definition of region of interest in PIV vector data used to calculate rotational frequency of the blood chamber filling vortex. Right: Time courses of rotational frequencies calculated for four different filling time settings (200 ms – A, 300 ms – B, 500 ms – C, and 850 ms – D).
Computational Fluid Dynamics
As the CFD primarily focuses on the assessment of regions of high shear stresses in the graft, a 1:1 support mode with short filling period was calculated, simulating a high risk condition for hemolysis due to the higher velocities and shear rates. During the initial filling phase of the Symphony, the tangential placement of the graft interface generates a jet that washes approximately 75% of the toroidal lumen formed by housing and membrane. Areas of low flow and low wall shear stresses were observed close to the inflow of the pouch and at the centre of the pouch (Figure 8, top). However, there was no strong flow vortex right at the beginning of the filling as indicated by a majority of velocity magnitudes less than 2 m/s inside the Symphony sac. The curved graft generated a helical flow pattern, which is considered to be ideal for good washout in artificial grafts and anastomosis (figure 10) [17]. Velocity magnitudes greater than 7 m/s and wall shear stresses of up to 300 Pa were observed within the graft at the anastomosis (figure 10, left). These calculated wall shear stress values represent the maximum values of shear stress found in the pouch-graft volume. The region with maximum velocity magnitudes corresponds to the region of maximum turbulent kinetic energy (3.8 m2/s2) and maximum Reynolds shear stress values (7,600 Pa).
Figure 8.

Velocity vectors at the central cross sectional plane colored by velocity magnitudes (left) and contours of wall shear stress (right). The two pictures on the top show the flow characteristics at the end of the filling phase, the pictures on the bottom show the flow characteristics at the end of ejection phase of the counterpulsation device (Symphony). These data show the formation of a large vortex during the filling phase that provides excellent washing of the Symphony, and no areas of flow separation were observed. During Symphony ejection these data show an even flow towards the graft. The flow pattern indicated uniform flow around the rounded outflow edges without flow separation, avoiding areas of stagnant flow at the outflow intersection. The laminar wall shear stresses in the Symphony remain for both flow situations significantly below the hemolysis threshold of 400 Pa.
Figure 10.

Path lines for the complete geometry with graft and axillary artery at the end of the filling phase (left) and at the end of ejection phase (right). At the end of filling phase a well developed secondary helical flow appears in the graft with maximum velocities near the graft-artery anastomosis. A helical, but less pronounced flow in the graft can be identified with maximum velocities in the anastomosis. The anastomosis is also the region with maximal Reynolds shear stress.
During the end of filling phase of the Symphony, the formation of a large fully developed 2D-vortex indicative of good washing was observed (Figure 8, bottom right). Areas of low flow and low shear stress observed during the initial filling phase were no longer observed due to the fully developed vortex. The helical flow pattern was maintained within the graft. The graft has higher velocities of up to 5 m/s and higher wall shear stress values compared to the Symphony sac in the same regions as in the beginning of the filling phase. Path lines visualizing the flow in the pouch clearly show two-dimensional vortex behavior with minor secondary flow (helicity) patterns (see Figure 8, right). This vortex behavior is considered favorable for the washing of the Symphony sac, especially for the region at the interface between the membrane and the pump housing.
During the initial emptying phase of the Symphony, the moving vortex formed during the filling of the Symphony is destroyed and an even flow towards the graft was observed (Figure 9). The flow pattern indicated uniform flow around the rounded outflow edges without flow separation, avoiding areas of stagnant flow. The maximum flow velocities inside the Symphony sac was 1 m/s, but maximum velocities in the graft were much higher reaching up to 5 m/s. Wall shear stresses in the graft and in the area of the outflow reached up to 200 Pa.
Figure 9.

Path lines colored by velocity magnitudes during initial filling phase (left) and end of filling phase (right). This visualization again shows the formation of a large shifting mainly 2D-vortex during the early filling phase providing excellent washing of the blood chamber.
During the end of the emptying phase of the Symphony, the low residual volume of this pouch geometry results in better washout compared to the initial emptying phase. The flow is uniform, rounded and is guided along the circumferential gap formed by membrane and housing (Figure 10). No flow separation was observed. In the Symphony sac maximum flow velocities are below 2 m/s, while flow velocities in the graft and artery are higher with up to 7 m/s. These regions correlate also with the region of maximum turbulent kinetic energy with 2.65 m2/s2 corresponding to the Reynolds shear stress of 5,300 Pa. It should be noted that Reynolds shear stress is a virtual statistical parameter which has no relationship to the laminar shear stress.
Animal Study
There were no device or driver failures with the 30 ml Symphony and portable pneumatic driver during the 6-hour acute, 5-day chronic, and 30-day chronic experiments and all calves were electively euthanized. The maximum plasma free hemoglobin (< 10 mg/dl), average platelet count (pre-implant = 473 ± 56 K/μL and post-implant = 331 ± 62 K/μL), and average hematocrit (pre-implant = 31 ± 2 % and post-implant = 29 ± 2 %) were normal at all measured time-points for each test animal during acute and chronic experiments. There were no changes in measures of hepatic (ALP, ALT) or renal function (creatinine) from pre-Symphony implantation values. The necropsy examination showed no thrombus in the Symphony, graft, or end organs (liver, brain, kidney, spleen, heart, and lungs) (Figure 11).
Figure 11.
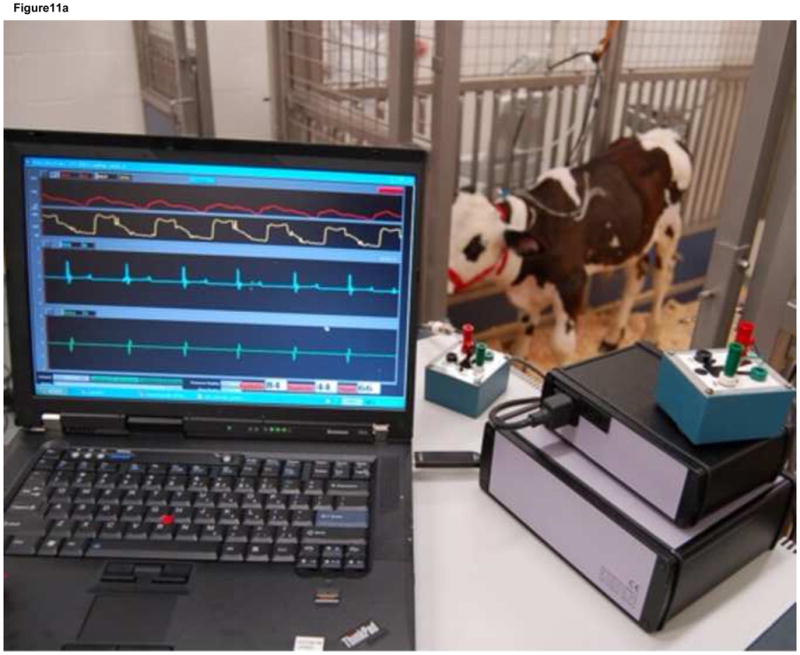

During the acute and chronic animal experiments (top), the maximum plasma free hemoglobin (< 10 mg/dl), average platelet count (pre-implant = 473 ± 56 K/μL and post-implant = 331 ± 62 K/μL), and average hematocrit (pre-implant = 31 ± 2 % and post-implant = 29 ± 2 %) were normal at all measured timepoints for each test animal indicating minimal hemolysis. The necropsy examination showed no thrombus in the Symphony (middle and bottom) or end organs (liver, brain, kidney, spleen, lungs, and heart).
IV. Discussion
Hemocompatibility is crucial to the clinical success of any chronic blood pump. The requirements for hemocompatibility are: low risk for hemolysis and thrombosis and adequate washing characteristics inside the device. Adequate washing implies the absence of a region persistently exposed to flow stagnation during the whole device cycle. Areas of blood stagnation are associated with increased blood residence time that increases the probability of activated platelets to adhere to the surface of the device. CFD and PIV are standard tools used for rapid evaluation of a blood pump design for hemocompatibility, allowing for faster blood pump design optimization before commencing expensive in-vivo trials [15, 16, 18, 19]. In-vivo acute and chronic animal testing are essential to evaluate the hemocompatibility of the blood pump design as it allows for direct measurements of hemocompatibility. PIV and CFD testing was performed to evaluate the hemocompatibility of the Symphony, which was later tested in acute and chronic (5-day and 30-day) large animal trials.
Particle Image Velocimetry
The PIV study enabled the characterization of Symphony washing behavior. The design goal was to generate a vortex in the Symphony sac due to the inflow jet to achieve adequate washout [20, 21]. The 1:2 mode was investigated because it represents the worst case scenario for washing as there is a long time interval between two ejection cycles when no membrane movement occurs. The washing in the Symphony sac during this time is caused solely due to the inertia of the rotating blood. PIV studies demonstrated that the Symphony developed a large 2D-vortex that was sustained for over 1.2 seconds after the completion of Symphony filling, providing adequate washing even in a 1:2 support mode (Figures 4–7). There is an exponential decrease of the vortex rotating frequency (Figure 7) over time. The initial vortex rotation frequency in the Symphony is determined by the Symphony filling time. The Symphony pneumatic driver is programmed to have appropriate Symphony filling times needed to sustain adequate washout in the Symphony sac in 1:2 mode. The center of the vortex is an area of low shear stress that may be a potential area for blood stagnation. However, the center of the vortex shifts constantly during and after Symphony filling, avoiding blood stagnation at a single location that should minimize the risk of thrombosis in the Symphony sac (Figure 12).
Figure 12.

Schematic representation of blood stagnation areas that could be prone to thrombus formation identified during the study for filling phase and pause (left) and for ejection phase (right). Importantly, the area of flow stagnation during Symphony filling is different from the area of flow stagnation during Symphony ejection, reducing the potential for thrombus formation. Arrows show flow direction of the blood.
The PIV study also demonstrated the destruction of this vortex and the low shear stress area within the vortex ~10 ms after initiation of Symphony ejection. During ejection, blood migrates uniformly from all areas of the Symphony sac (Figure 5), and resulted in counter-rotating flow fields in the circumferential gap formed by membrane and housing, thereby inhibiting the development of a stable vortex in this area. The inability to develop a stable vortex after ejection necessitates the immediate filling of the Symphony after the completion of Symphony ejection to maintain good washing. The Symphony pneumatic driver is programmed to ensure that Symphony filling occurs immediately after Symphony ejection. However, PIV studies investigating the velocity field in a cross-section do not allow a full representation of flow field in the blood chamber during the whole pump cycle, as the membrane separating the test fluid and air with different refraction indexes passes the laser light sheet resulting in optical distortion (especially at time step 2, Figure 5).
Computational Fluid Dynamics
Experimental assessment of shear stress in the complex curved geometry of the graft using PIV is complex. Thus, a simplified Computational Fluid Dynamics (CFD) study of the Symphony with a Newtonian blood model was performed to characterize the Symphony flow, with the graft being the primary focus of the CFD study. Blood is non-Newtonian at low shear rates. However, at high shear rates (>100 s−1) blood can be approximated to a Newtonian fluid. The viscous boundary layer may have non-Newtonian blood behaviour, but the size of the cells near the boundary are approximately five times the size of the viscous boundary layer, which is the appropriate cell size for the turbulence model used in this simulation. Due to the significantly large size of the cells near the wall compared to the viscous boundary layer, a Newtonian blood approximation was used. The use of a Newtonian blood model is consistent with CFD study of current mechanical circulatory support devices including VAD in literature [22]. In the graft, maximal flow velocities and gradients were studied in detail, as they are primary factors for red blood cell and platelet damage and activation. Hence flow in quasi-steady state conditions was simulated at four time steps of the Symphony cycle in the 1:1 support mode with the shortest applying filling and ejection phases of 100ms. The shortest filling and ejection phases will have the maximal flow velocities and gradients in the graft, and represents the worst case scenario for hemolysis due to shear.
The CFD study demonstrated the development of a helical flow pattern in the curved Symphony graft, which is considered to be ideal for good washout in artificial grafts. Higher shear stresses and flow velocities were observed in the Symphony graft compared to the Symphony chamber, while the laminar shear stresses remained well below the hemolysis threshold of 400 Pa inside the Symphony throughout the Symphony filling and ejection cycles [23]. The estimated Reynolds shear stress was approximately an order of magnitude higher than the laminar shear stress. The correlation of Reynolds shear stress blood cell damage is controversial [24, 25] as the Reynolds shear stress is a statistical quantity, which has no link to the real force experienced by a traveling blood cell. Finally, potential negative hemocompatibility effects caused by the turbulence may only be evaluated in animal models.
More complex unsteady flow simulations with a moving boundary, such as fluid-structure interaction (FSI) simulations, would be time consuming and cost prohibitive. Further, these studies are currently restricted to significant simplifications of VAD modeling (eg. laminar flow modeling) and have many significant limitations [26, 27]. The focus of this study was the vortex flow, especially between two Symphony ejections when there is no membrane movement using PIV, and the evaluation of high shear stress in the graft using CFD. Graft flow is driven by membrane movement, but these dynamic effects do not significantly affect the evaluation of high shear stress found far downstream in the vessel/graft anastomosis. In this study, non-pulsatile arterial flow was modeled. The arterial flow velocity pulsatility would not have significant impact on the results as Symphony flow velocities (3–7 m/s) are significantly greater than arterial flow velocities (~0.2 m/s). There is a potential for the membrane to come in contact with housing briefly during device ejection, which may cause blood trauma and hemolysis due to the ‘squeezing’ of the blood between the membrane and the housing. The ‘squeezing’ effect was not modeled in the CFD. However, all animal experiments clearly and repeatedly demonstrated low levels of hemolysis, which are well-below clinical thresholds. These findings are consistent with results of others [28], which suggest that any ‘squeezing effect’ has minimal (or no significant) impact resulting in blood damage for membrane pumps.
The major findings of PIV and CFD tests are identification of areas with persistent stagnant flow and high shear stresses in the Symphony sac (Figure 12) and the graft, respectively. The junction between the graft and the sac, and the graft and the artery are regions where highest shear stresses and turbulence occur. Additionally, the exponential decrease of the vortex rotating frequency (Figure 7) as a function of time due to Symphony filling time allows for optimization of the Symphony hemocompatibility if animal tests indicated additional modifications - increased Symphony filling time or graft diameter would reduce the danger of hemolysis in the graft, but would also reduce the inlet velocity and the energy of the vortex rotating in the pouch during Symphony filling, potentially increasing the risk of thrombosis.
Animal Study
Acute and chronic animal experiments demonstrated the excellent hemocompatibility of the Symphony design predicted by CFD and PIV. In humans, the Symphony is designed to be anastamosed to the axillary artery. However, in a calf model, due to anatomic and size restrictions, the Symphony was anastomosed to the carotid artery as it was of a similar size as the human axillary artery. Further, the distance from the device anastomosis site in the calf carotid artery to the aortic root was similar to the distance between the human axillary artery and the aortic root. During the animal experiments, the plasma free hemoglobin, which is a direct measure of hemolysis, was less than 10 mg/dl at all measured timepoints for each test animal. In comparison, the use of several clinically approved blood pumps results in plasma free hemoglobin levels of 30–100 mg/dl or higher [29–31]. No thrombus was observed in the Symphony or end organs during necropsy examinations, indicating a low risk of thrombogenesis with the Symphony. Histopathological analyses showed no evidence of vascular injury in the carotid artery due to the flow stream generated by the Symphony. The animal study has some inherent variability due to differences between animals but represents a more realistic and clinically relevant model for Symphony evaluation. The animal studies cannot be used to measure shear stresses and velocity vectors to directly compare the CFD and PIV results, but can provide direct measurement/indication of hemolysis and thrombogenesis and support the CFD and PIV predictions.
V. Conclusions
PIV and CFD studies were used to predict and evaluate the hemocompatibility of a novel single port valveless counterpulsation device. The hemocompatibility of the Symphony was tested in acute and chronic (5-day and 30-day) large animal trials. PIV and CFD demonstrated that the Symphony has good washing characteristics, no areas of flow stagnation or separation, and favorable range of shear stresses. Animal experiments demonstrated a low risk of hemolysis or thrombosis suggesting that the device may be suitable for human implantation.
Acknowledgments
Funding for this project was provided by National Institutes of Health (NIH) Heart, Lung, and Blood Institute (HLBI) Small Business Investigative Research (SBIR) grant number R44HL083586-02.
Footnotes
Publisher's Disclaimer: This is a PDF file of an unedited manuscript that has been accepted for publication. As a service to our customers we are providing this early version of the manuscript. The manuscript will undergo copyediting, typesetting, and review of the resulting proof before it is published in its final citable form. Please note that during the production process errors may be discovered which could affect the content, and all legal disclaimers that apply to the journal pertain.
References
- 1.Rose EA, et al. Long-Term Use of a Left Ventricular Assist Device for End-Stage Heart Failure. N Engl J Med. 2001;345(20):1435–43. doi: 10.1056/NEJMoa012175. [DOI] [PubMed] [Google Scholar]
- 2.Burkhoff D, Klotz S, Mancini DM. LVAD-induced reverse remodeling: basic and clinical implications for myocardial recovery. J Card Fail. 2006;12(3):227–39. doi: 10.1016/j.cardfail.2005.10.012. [DOI] [PubMed] [Google Scholar]
- 3.Goldstein DJ, Oz MC, Rose EA. Implantable left ventricular assist devices. N Engl J Med. 1998;339(21):1522–33. doi: 10.1056/NEJM199811193392107. [DOI] [PubMed] [Google Scholar]
- 4.Trost JC, Hillis LD. Intra-aortic balloon counterpulsation. Am J Cardiol. 2006;97(9):1391–8. doi: 10.1016/j.amjcard.2005.11.070. [DOI] [PubMed] [Google Scholar]
- 5.Birks EJ, et al. The role of bridge to transplantation: should LVAD patients be transplanted? Curr Opin Cardiol. 2004;19(2):148–53. doi: 10.1097/00001573-200403000-00015. [DOI] [PubMed] [Google Scholar]
- 6.Chinn R, et al. Multicenter experience: prevention and management of left ventricular assist device infections. ASAIO J. 2005;51(4):461–70. doi: 10.1097/01.mat.0000170620.65279.aa. [DOI] [PubMed] [Google Scholar]
- 7.Mancini D, Burkhoff D. Mechanical device-based methods of managing and treating heart failure. Circulation. 2005;112(3):438–48. doi: 10.1161/CIRCULATIONAHA.104.481259. [DOI] [PubMed] [Google Scholar]
- 8.Giridharan GA, et al. Predicted hemodynamic benefits of counterpulsation therapy using a superficial surgical approach. ASAIO J. 2006;52(1):39–46. doi: 10.1097/01.mat.0000196522.29376.96. [DOI] [PMC free article] [PubMed] [Google Scholar]
- 9.Koenig SC, et al. Development and early testing of a simple subcutaneous counterpulsation device. ASAIO J. 2006;52(4):362–7. doi: 10.1097/01.mat.0000227729.70008.66. [DOI] [PMC free article] [PubMed] [Google Scholar]
- 10.Koenig SC, et al. Hemodynamic and left ventricular pressure-volume responses to counterpulsation in mock circulation and acute large animal models. Conf Proc IEEE Eng Med Biol Soc. 2004;5:3761–4. doi: 10.1109/IEMBS.2004.1404055. [DOI] [PubMed] [Google Scholar]
- 11.Koenig SC, et al. Acute hemodynamic efficacy of a 32-ml subcutaneous counterpulsation device in a calf model of diminished cardiac function. ASAIO J. 2008;54(6):578–84. doi: 10.1097/MAT.0b013e318186891f. [DOI] [PMC free article] [PubMed] [Google Scholar]
- 12.Billy GG, et al. Hemolytic differences among artificial cardiac valves used in a ventricular assist pump. Artif Organs. 1995;19(4):339–43. doi: 10.1111/j.1525-1594.1995.tb02338.x. [DOI] [PubMed] [Google Scholar]
- 13.Noon G. Clinical use of cardiac assist devices. In: Akutsu To, Koyanagi H., editors. Heart replacement: artificial heart 4. Springer-Verlag; Tokyo; New York: 1993. pp. 195–204. [Google Scholar]
- 14.Goubergrits L, Affeld K, Kertzscher U. Innovative developments of the heart valves designed for use in ventricular assist devices. Expert Rev Med Devices. 2005;2(1):61–71. doi: 10.1586/17434440.2.1.61. [DOI] [PubMed] [Google Scholar]
- 15.Mitamura Y, et al. Prediction of hemolysis in rotary blood pumps with computational fluid dynamics analysis. J Congest Heart Fail Circ Support. 2001;1(4):331–6. [Google Scholar]
- 16.Arvand A, Hormes M, Reul H. A validated computational fluid dynamics model to estimate hemolysis in a rotary blood pump. Artif Organs. 2005;29(7):531–40. doi: 10.1111/j.1525-1594.2005.29089.x. [DOI] [PubMed] [Google Scholar]
- 17.Huijbregts HJ, et al. A helical PTFE arteriovenous access graft to swirl flow across the distal anastomosis: results of a preliminary clinical study. Eur J Vasc Endovasc Surg. 2007;33(4):472–5. doi: 10.1016/j.ejvs.2006.10.028. [DOI] [PubMed] [Google Scholar]
- 18.Day SW, et al. Particle image velocimetry measurements of blood velocity in a continuous flow ventricular assist device. ASAIO J. 2001;47(4):406–11. doi: 10.1097/00002480-200107000-00021. [DOI] [PubMed] [Google Scholar]
- 19.Mussivand T, Day KD, Naber BC. Fluid dynamic optimization of a ventricular assist device using particle image velocimetry. ASAIO J. 1999;45(1):25–31. doi: 10.1097/00002480-199901000-00007. [DOI] [PubMed] [Google Scholar]
- 20.Deutsch S, et al. Experimental fluid mechanics of pulsatile artificial blood pumps. Annual Review of Fluid Mechanics. 2006;38:65–86. [Google Scholar]
- 21.Shu FJ, et al. Multimodal Flow Visualization and Optimization of Pneumatic Blood Pump for Sorbent Hemodialysis System. Artificial Organs. 2009;33(4):334–45. doi: 10.1111/j.1525-1594.2009.00724.x. [DOI] [PubMed] [Google Scholar]
- 22.Behbahani M, et al. A review of computational fluid dynamics analysis of blood pumps. European Journal of Applied Mathematics. 2009;20:363–97. [Google Scholar]
- 23.Paul R, et al. Shear stress related blood damage in laminar couette flow. Artif Organs. 2003;27(6):517–29. doi: 10.1046/j.1525-1594.2003.07103.x. [DOI] [PubMed] [Google Scholar]
- 24.Ge L, et al. Characterization of hemodynamic forces induced by mechanical heart valves: Reynolds vs. viscous stresses. Ann Biomed Eng. 2008;36(2):276–97. doi: 10.1007/s10439-007-9411-x. [DOI] [PubMed] [Google Scholar]
- 25.Antiga L, Steinman DA. Rethinking turbulence in blood. Biorheology. 2009;46(2):77–81. doi: 10.3233/BIR-2009-0538. [DOI] [PubMed] [Google Scholar]
- 26.Doyle MG, et al. Numerical simulations of blood flow in artificial and natural hearts with fluid-structure interaction. Artif Organs. 2008;32(11):870–9. doi: 10.1111/j.1525-1594.2008.00644.x. [DOI] [PubMed] [Google Scholar]
- 27.Avrahami I, et al. Numerical model of flow in a sac-type ventricular assist device. Artif Organs. 2006;30(7):529–38. doi: 10.1111/j.1525-1594.2006.00255.x. [DOI] [PubMed] [Google Scholar]
- 28.Imachi K. Artificial heart research and present status of clinical application in Japan. ASAIO Journal. 2006;52(1):9–16. doi: 10.1097/01.mat.0000196711.98042.12. [DOI] [PubMed] [Google Scholar]
- 29.Grinda JM, et al. Bridge to transplantation with the DeBakey VAD axial pump: a single center report. Eur J Cardiothorac Surg. 2002;22(6):965–70. doi: 10.1016/s1010-7940(02)00612-7. [DOI] [PubMed] [Google Scholar]
- 30.Ohashi Y, de Andrade A, Nose Y. Hemolysis in an electromechanical driven pulsatile total artificial heart. Artif Organs. 2003;27(12):1089–93. doi: 10.1111/j.1525-1594.2003.07088.x. [DOI] [PubMed] [Google Scholar]
- 31.Luckraz H, Woods M, Large SR. And hemolysis goes on: ventricular assist device in combination with veno-venous hemofiltration. Ann Thorac Surg. 2002;73(2):546–8. doi: 10.1016/s0003-4975(01)03326-4. [DOI] [PubMed] [Google Scholar]