Abstract
Study Design:
Retrospective database study.
Objectives:
Analysis of economic and demographic data concerning lumbar disc arthroplasty (LDA) throughout the United States to improve value-based care and health care utilization.
Methods:
The National Inpatient Sample database was queried for patients who underwent primary or revision LDA between 2005 and 2013. Demographic and economic data included total surgeries, costs, length of stay, and frequency of routine discharge. The National Inpatient Sample database represents a 20% sample of discharges from US hospitals weighted to provide national estimates.
Results:
Primary LDA decreased 86% from 3059 to 420 from 2005 to 2013. The mean total cost of LDA increased 33% from $17 747 to $23 804. The mean length of stay decreased from 2.8 to 2.4 days. The mean routine discharge (home discharge without visiting nursing care) remained constant at 91%. Revision procedures (removal, supplemental fixation, or reoperation at the treated level) declined 30% from 194 to 135 cases over the study period. The mean revision burden, defined as the ratio of revision procedures to the sum of primary and revision procedures, was 12% (range 6% to 24%). The mean total cost of revisions ranged from $12 752 to $22 282.
Conclusions:
From 2005 to 2013, primary LDA significantly declined in the United States by 86% despite several studies pointing to improved efficacy and cost-efficiency. This disparity may be related to a lack of surgeon reimbursement from insurance companies. Congruently, the number of revision LDA cases has declined 30%, while revision burden has risen from 6% to 24%.
Keywords: arthroplasty, lumbar disc arthroplasty, LDA, lumbar, disc replacement, degenerative disc disease
Introduction
Lower back pain is one of the most common causes of disability in the United States.1 Although the vast majority of lower back pain is successfully managed with conservative modalities, spinal arthrodesis of the lumbar spine is frequently performed when surgical treatment is indicated. Recent studies have shown significant increases in the use of fusion procedures over the past decade2,3; however, complications such as adjacent-level disease, pseudarthrosis, and persistent pain have resulted in 5-year reoperation rates of more than 19%.4
Lumbar disc arthroplasty (LDA) was introduced in the mid-2000s as an alternative to spinal fusion with preservation of joint mobility and a potentially decreased risk of complications. LDA was expected to transform the landscape of lumbar spinal surgery; however, despite clinical studies showing comparable or better clinical outcomes, there has been a progressive decline in the use of LDA since its approval by the US Food and Drug Administration.5–14 Awe and colleagues found that at its peak, post Food and Drug Administration approval, the volume of LDA procedures was only 3% of the number of posterolateral fusion performed that year.5 Although surgical treatment accounts for a relatively small part of total hospital costs, a number of studies have reported the increasing use of surgical interventions for lower back pain over the past decade.2,15 Furthermore, the United States has the highest rate of spinal surgery worldwide.3 Given the changes in the health care system and the increasing focus on health care utilization and value-based care, it has become increasingly important to understand the patterns of surgical treatment for lower back pain, as it accounts for a growing proportion of total health care costs.
The purpose of this study was to determine the trends in primary and revision LDA over the recent decade and evaluate the unexpected decline in procedure utilization. By performing a longitudinal analysis of an administrative inpatient database, we may understand the yearly trends and economic data surrounding LDA and revision LDA. An appreciation for the yearly national aggregate cost of the procedure is of significant importance to surgeons, policy makers, and hospital administrators. Thus, in this study, we utilized data from the National Inpatient Sample (NIS) database to compare a large, national cohort of patients who underwent primary and revision LDA from 2005 to 2013.
Methods
Data Source
Data was collected from the NIS database between 2005 and 2013 across 44 states. The NIS database was developed for the Healthcare Cost and Utilization Project and constitutes the largest all-payer inpatient database in the United States. The database represents a 20% sample of discharges from US hospitals (excluding rehabilitation and long-term acute care hospitals), which is weighted to provide national estimates.
Patient Selection and Characteristics
The NIS database was queried for primary LDA and revision LDA from 2005 to 2013 using the International Classification of Diseases, Ninth Revision, Clinical Modification (ICD-9 CM) codes 84.65 and 84.68, respectively. There were no additional criteria for patient exclusion. Revision LDA data from 2009 was not available since the relative standard error (SE; [standard error/weighted estimate]) for those years was more than 0.3, indicating that the number of patients was too low to reliably extrapolate national statistics.
Demographic and economic data were obtained for both primary and revision LDA. Insurance types included Medicare, Medicaid, private, uninsured, and other. The “other” category included workman’s compensation, TRICARE/CHAMPUS, CHAMPVA, Title V, and a number of other government programs. The annual number of surgeries, patient age, sex, total charges, total costs (in then-year dollars), insurance type, length of stay (LOS), location, and frequency of routine discharge, defined as home discharge without visiting nursing care, were recorded. Revision burden was defined as the ratio of revision procedures (removal, revision, supplemental fixation, or reoperation at the index level) to the sum of primary and revision procedures. Aggregate charges or the “national bill” was defined as the sum of all charges for all hospital stays in the United States. Total charges were converted to costs using cost-to-charge ratios based on hospital accounting reports from the Centers for Medicare and Medicaid Services. Costs reflect the actual costs of production, while charges represent what the hospital billed for the case. Because cost data was not available in 2005, our cost analysis was restricted to 2006 through 2013.
Descriptive statistics were performed to compare variables. Two-sample Student’s t test was employed to analyze the difference in continuous variables, and χ2 test or Fisher’s exact test was employed for categorical variables. Findings were considered statistically significant when P < .05. Analysis was conducted using IBM SPSS Statistics Version 24. The NIS database is de-identified and was therefore deemed exempt by our institutional review board.
Results
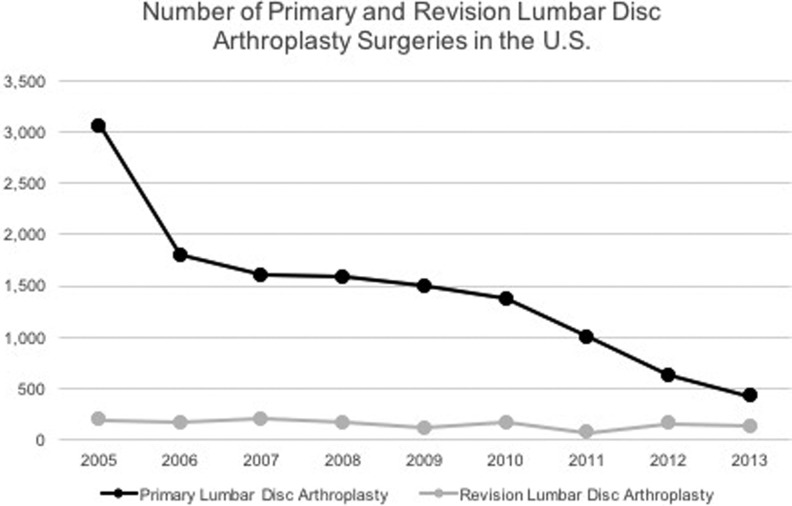
An estimated 12 957 patients (SE = 1618) underwent primary LDA and 1378 patients (SE = 119) underwent revision LDA in the United States from 2005 to 2013. The annual total number of procedures for primary LDA progressively declined over the 9-year period, while the number of revision procedures fluctuated. The annual number of primary LDA procedures decreased 86% from 3059 cases in 2005 to 420 cases in 2013 (mean = 1440; range = 420-3059). The most dramatic decline for annual primary LDA procedures over a single year was 41.3% from 3059 cases in 2005 to 1796 cases in 2006. During the same 9-year period, the annual total number of revision LDA procedures increased 30.4% from 194 cases in 2005 to 135 cases in 2013 (mean = 153; range = 71-205). Unlike primary procedures, the trend in revision LDA was nonlinear. Revision LDA procedures peaked in 2007 with 205 cases and decreased 65.4% to a minimum of 71 cases in 2011 (Figure 1).
Figure 1.
Annual number of primary and revision LDA surgeries in the United States from 2005 to 2013.
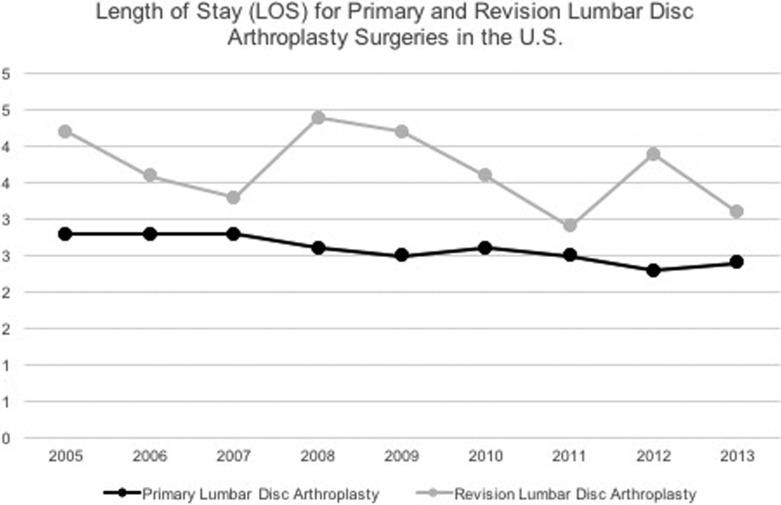
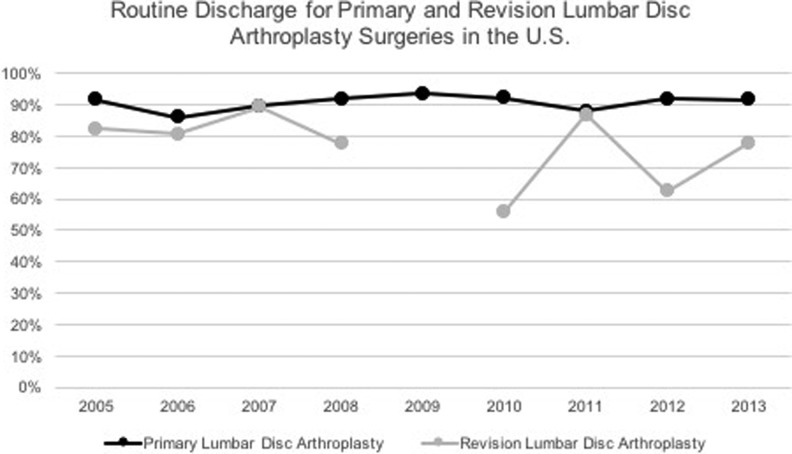
Primary LDA patients had a shorter LOS and a higher rate of routine discharges, defined as discharge home without home nursing care. The mean LOS for primary LDA over the 9-year period was 2.6 days (SE = 0.06; range = 2.3-3.3 days), while mean LOS for revision LDA was 3.7 days (SE = 0.2; range = 2.9-4.4 days; P = .0003; Figure 2). The mean percentage of patients with routine discharge after primary LDA was 91% (SE = 1.0%; range = 86% to 94%) compared to 77% after revision LDA (SE = 2.4%; range = 56% to 89%; P = .02; Figure 3). The LOS and routine discharges for primary LDA did not widely vary each year; however, there were large fluctuations in revision LDA.
Figure 2.
Average length of stay for primary and revision LDA surgeries in the United States from 2005 to 2013.
Figure 3.
Average routine discharge for primary and revision LDA surgeries in the United States from 2005 to 2013. Data unavailable for revision LDA in 2009.
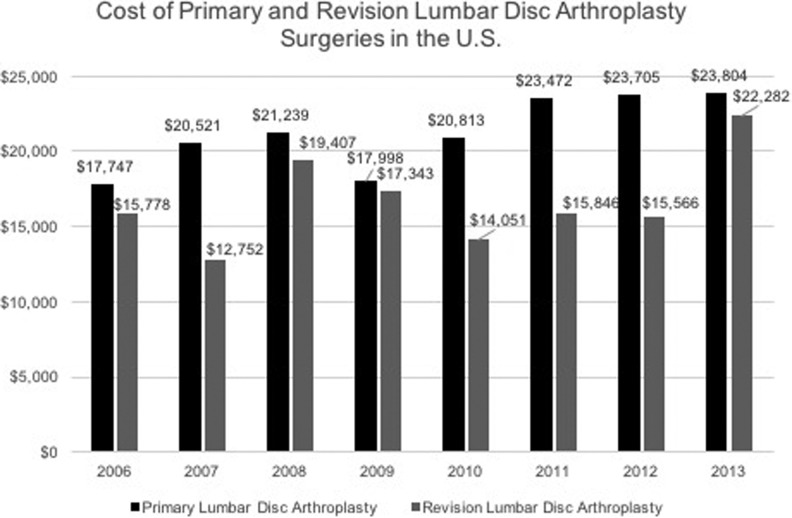
The mean total hospital cost for both primary and revision LDA showed gradual increase from 2006 to 2013. The mean total cost of primary LDA increased from $17 747 per case in 2006 to $23 804 per case in 2013 (mean = $21 162; SE = $400; range = $17 747 to $23 804). The mean total cost of revision LDA also increased from $15 778 per case in 2006 to $22 282 per case in 2013 (mean = $16 628; SE = $811; range = $12 752 to $22 282; Figure 4). Over the 8-year period, the mean cost per primary LDA procedure was significantly more expensive than the mean cost per revision LDA ($21 162 vs $16 628, respectively; P = .006).
Figure 4.
Average cost of primary and revision LDA surgeries in the United States from 2006 to 2013.
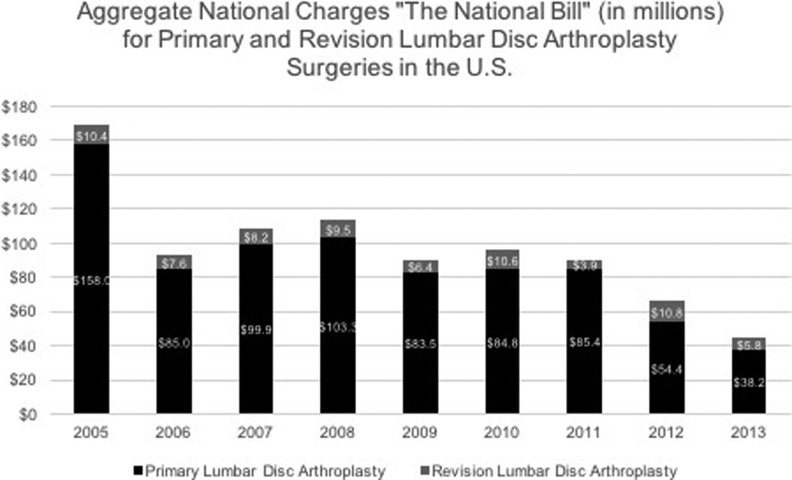
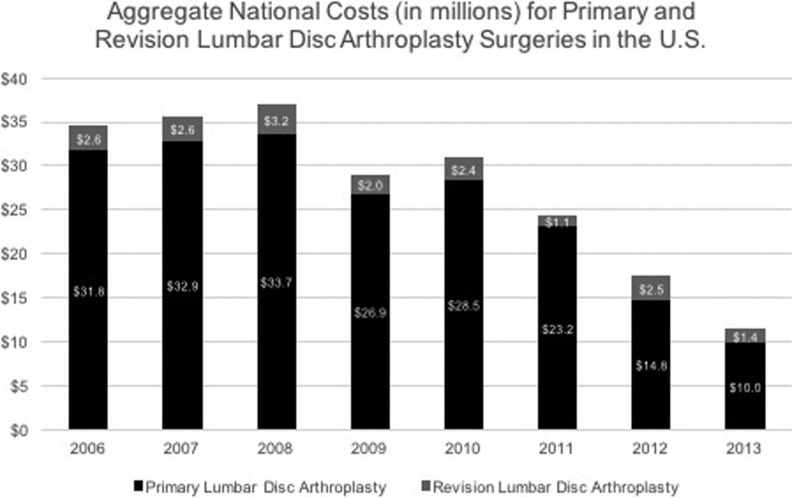
The aggregate national charges, or the “national bill,” decreased over the study period for primary LDA and totaled $792 497 942 (mean = $88 055 327; SE = $8 791 944; range = $38 199 246 to $157 993 901). The aggregate national charges for revision LDA over the same period fluctuated, but totaled $73 207 254 (mean = $8 134 139; SE = $953 948; range = $3 895 179 to $10 849 879; Figure 5). After initially increasing, aggregate national cost for primary LDA initially increased to $33 694 957 until 2008 and then decreased 70% from $33 694 957 in 2008 to $9 957 649 in 2013. The total aggregate national costs for primary LDA totaled $201 864 049 (mean = $25 233 006; SE = $2 552 371; range: $9 957 649 to $33 694 957). Total aggregate national costs for revision LDA mirrored aggregate national charges in its fluctuation with a total of $17 750 983 (mean = $2 218 873; SE = $212 175; range: $1 094 365 to $3 170 303; Figure 6).
Figure 5.
Aggregate national charges, “The National Bill” (in millions), for primary and revision LDA surgeries in the United States from 2006 to 2013.
Figure 6.
Aggregate national costs (in millions) for primary and revision LDA surgeries in the United States from 2006 to 2013.
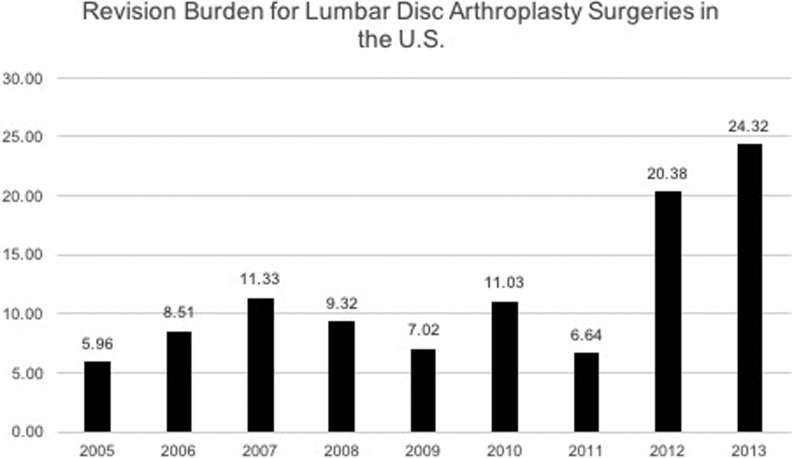
The majority of patients receiving primary LDA were between the ages of 18 and 44 years (68%) and 45 and 64 years (30%). Males received a significantly larger portion of primary LDA procedures as compared to females (54% and 44%, respectively; P = .0009). Private insurance accounted for 52% of payer types for primary LDA, while “other” accounted for 35%. There was an even distribution of primary LDA cases performed at teaching and nonteaching hospitals (52% vs 48%, respectively; P < .05). The LDA mean revision burden was 11.6% (range = 6.0% to 24.3%; Figure 7). The largest yearly increase in revision burden was 6.6% in 2011 to 20.4% in 2012.
Figure 7.
Revision burden for LDA surgeries in the United States from 2005 to 2013. Revision burden is defined as the number of revision procedures divided by the sum of primary and revision procedures per year.
Discussion
The trends observed in the current analysis of the NIS database corroborate the current literature. Yoshihara and colleagues retrospectively analyzed the NIS from 2000 to 2009, collecting data for patients 18 years or older with a primary diagnosis of lumbar degenerative disc disease (DDD). The authors found that surgical treatment for lumbar DDD increased 2.4-fold in the United States over the study period, with a decrease in LDA and an increase in fusion procedures.2 Similarly, Awe and colleagues analyzed the NIS database from 2000 to 2008. The authors reported steady growth in lumbar spinal fusion with a 28% decrease in the number of lumbar arthroplasty procedures. In this study, LDA comprised less than 2% of lumbar spine stabilization procedures—a minimal impact on the overall spine market.5
The decreasing use of LDA has been attributed to a narrow specificity of indications necessary to promote successful outcomes, limited data on long-term outcomes and complications, and most significantly insurance coverage.16 Although many surgeons share enthusiasm for LDA17 and long-term studies have shown equivalence or, in some instances, superiority to fusion, insurers have been reluctant to reimburse for such procedures.10 The Centers for Medicare and Medicaid Services does not cover LDA in the Medicare population over 60 years of age.18 Similarly most private insurance companies in the United States do not provide coverage. The lack of coverage and reimbursement is undoubtedly contributed to the decline in procedural volume.
Another issue related to the low rates of adoption for LDA is the contentious indication for the procedure: degenerative disc disease (DDD). Because of the lack of consensus regarding the validity of the diagnosis in the setting of back pain, it becomes increasingly difficult to receive reimbursement for the procedure. This may have lead to the low procedural volume for LDA. Additionally, the complexity of the surgical procedure along with the fear of complications may have also played a role in the declining use of LDA. The combination of all of these factors have likely led to the reduction in procedural volume found in the current study.
Correspondingly, the decline in LDA comes at a time when total spinal fusion procedures in the United States are increasing.2,3,19 Jancuska and colleagues reported that the number of fusions per year increased 55% from 2005 to 2014, with the ratio of fusion to nonfusion surgeries increasing from 0.88 to 2.67 at high-volume hospitals, from 0.84 to 2.30 at medium-volume hospitals, and from 0.66 to 1.52 at low-volume hospitals.19 In terms of specific procedures, Yoshihara et al utilized the NIS database and found anterior-posterior lumbar fusions increased 3.0-fold and posterior lumbar fusions increased 2.8-fold between 2000 and 2009.2 Similarly, Pannell and colleagues reported a significant increase in posterior lumbar interbody fusions (P < .0001), posterior lumbar fusions (P = .012), and anterior lumbar interbody fusions (P < .0001) from 2004 to 2009 within the NIS database.3 These studies demonstrate that the overall increase in spinal fusions is, at least partially, compensating for the decline in LDA observed in the current study.
Since the introduction of LDA, numerous well-designed studies have shown that these devices are noninferior when compared with spinal fusion procedures.5–14 In a recent study, Park and colleagues reported that LDA had clinical success rates of 76.9% and satisfaction rates of 87.2% at 10-year follow-up, emphasizing a strict patient selection process mandatory for success.16 Moreover, a meta-analysis of randomized controlled trials reported that total disc replacement showed significant superiority to fusion for the treatment of lumbar DDD in terms of Oswestry Disability Index scores, patient satisfaction, Visual Analog Scale satisfaction, narcotic use, overall success rate, and complications.20 However, the narrower surgical indications, absence of health insurance support, and technical surgical challenges have likely contributed to the poor adoption of LDA.5
Understanding the cost-effectiveness of LDA in the context of the US health care system is critical in delivering value-based care. Levin and colleagues reported that patients undergoing 1-level ProDisc total disc replacement spent significantly less time in the operating room and had less estimated blood loss than patients who had circumferential fusions. Furthermore, charges were significantly lower for the total disc replacement group compared to the fusion group, resulting in overall cost savings.21 Similarly, in 3-level spinal procedures, LDA patients benefited from 49% lower in-hospital costs compared with patients undergoing arthrodesis.22 Understanding the current trends, economic data, and clinical outcomes for LDA is critical in the determination of cost-effectiveness and appropriate allocation of health care resources. These issues raise an important concern for the ability of payers to limit a procedure with confirmed value and cost-effectiveness, thereby limiting patients access to care. Although aggregate expenditure on LDA have decreased over the past decade, overall costs for the treatment of LBP have increased significantly, suggesting that payer denial of LDA has not impacted costs overall.
The current study, which is a longitudinal analysis of an administrative inpatient database, is not designed to determine the cause of the observed trends, such as the increased cost of LDA procedures. Although this study was not designed to determine the cause of the increased inpatient cost over the study period, it is important to keep in mind that health care industry trend rates are much higher than the national inflation rate. In 2016, the global average medical trend rate was 8.1% per year compared to the global inflation rate of 2.9%.23
Revision burden is a critical element in the analysis of a surgical implant. During the study period the overall revision burden increased, while disc replacements decreased overall. Several factors may have influenced this trend, including the decline in primary procedures. The decline in primary LDA would account for the increase in revision burden through the ratio calculation. The increase in revision burden may also be explained by an increasing proportion of revision procedures. Revision procedures may have increased over time because of the accumulation of primary surgeries requiring reoperation, as LDA is a relatively new procedure.
Many of the limitations of this study are due to the intrinsic limitations of large patient databases. The NIS database does not include physician-based fees and costs are calculated from hospital-specific cost-to-charge ratios, which may exaggerate surgical cases. Still these hospital-specific cost-to-charge ratios have been internally validated by the Agency for Healthcare Research and Quality. Inherent to a large study, the surgeries were performed by a large variety of surgeons, allowing for differences in surgical technique and potential indication bias. Furthermore, there can be potential inaccuracies of ICD-9 CM billing records, errors transferring data from hospital records to administrative records, underreporting of procedures, or exclusion of missing cases in the NIS database.
In this analysis of the NIS database, the rate of primary LDA and revision LDA progressively declined over a recent decade. In addition, mean hospital costs increased, while aggregate national charges decreased for primary LDA. Our findings corroborate the trend in LDA usage in the current literature, which may be a direct consequence of limited coverage from public and private insurance companies. Although many studies have reported noninferior clinical outcomes and cost-effectiveness of LDA in comparison to lumbar arthrodesis, prospective randomized trials are necessary to more rigorously evaluate the long-term outcomes and cost-effectiveness of LDA from a national health care perspective.
Footnotes
Declaration of Conflicting Interests: The author(s) declared no potential conflicts of interest with respect to the research, authorship, and/or publication of this article.
Funding: The author(s) received no financial support for the research, authorship, and/or publication of this article.
References
- 1. Ma VY, Chan L, Carruthers KJ. Incidence, prevalence, costs, and impact on disability of common conditions requiring rehabilitation in the united states: stroke, spinal cord injury, traumatic brain injury, multiple sclerosis, osteoarthritis, rheumatoid arthritis, limb loss, and back pain. Arch Phys Med Rehabil. 2014;95:986–995. doi:10.1016/j.apmr.2013.10.032. [DOI] [PMC free article] [PubMed] [Google Scholar]
- 2. Yoshihara H, Yoneoka D. National trends in the surgical treatment for lumbar degenerative disc disease: United States, 2000 to 2009. Spine J. 2015;15:265–271. doi:10.1016/j.spinee.2014.09.026. [DOI] [PubMed] [Google Scholar]
- 3. Pannell WC, Savin DD, Scott TP, Wang JC, Daubs MD. Trends in the surgical treatment of lumbar spine disease in the United States. Spine J. 2015;15:1719–1727. doi:10.1016/j.spinee.2013.10.014. [DOI] [PubMed] [Google Scholar]
- 4. Radcliff K, Spivak J, Darden B, Janssen M, Bernard T, Zigler J. Five-year reoperation rates of 2-level lumbar total disk replacement versus fusion: results of a prospective, randomized clinical trial [published online December 21, 2016]. Clin Spine Surg. doi:10.1097/BSD.0000000000000476. [DOI] [PubMed] [Google Scholar]
- 5. Awe OO, Prasad S, Maltenfort MG, Harrop JS, Ratliff J. Impact of total disc arthroplasty on the surgical management of lumbar degenerative disc disease: analysis of the Nationwide Inpatient Sample from 2000 to 2008. Surg Neurol Int. 2011;2:139 doi:10.4103/2152-7806.85980. [DOI] [PMC free article] [PubMed] [Google Scholar]
- 6. Blumenthal S, McAfee PC, Guyer RD, et al. A prospective, randomized, multicenter Food and Drug Administration investigational device exemptions study of lumbar total disc replacement with the CHARITE artificial disc versus lumbar fusion: part I: evaluation of clinical outcomes. Spine (Phila Pa 1976). 2005;30:1565–1575. doi:10.1097/01.brs.0000170561.25636.1c. [DOI] [PubMed] [Google Scholar]
- 7. Delamarter RB, Fribourg DM, Kanim LE, Bae H. ProDisc artificial total lumbar disc replacement: introduction and early results from the United States clinical trial. Spine (Phila Pa 1976). 2003;28:S167–S175. doi:10.1097/01.BRS.0000092220.66650.2B. [DOI] [PubMed] [Google Scholar]
- 8. Le Huec JC, Mathews H, Basso Y, et al. Clinical results of Maverick lumbar total disc replacement: two-year prospective follow-up. Orthop Clin North Am. 2005;36:315–322. doi:10.1016/j.ocl.2005.02.001. [DOI] [PubMed] [Google Scholar]
- 9. Park CK, Ryu KS, Lee KY, Lee HJ. Clinical outcome of lumbar total disc replacement using ProDisc-L in degenerative disc disease: minimum 5-year follow-up results at a single institute. Spine (Phila Pa 1976). 2012;37:672–677. doi:10.1097/BRS.0b013e31822ecd85. [DOI] [PubMed] [Google Scholar]
- 10. Siepe CJ, Mayer HM, Wiechert K, Korge A. Clinical results of total lumbar disc replacement with ProDisc II three-year results for different indications. Spine (Phila Pa 1976). 2006;31:1923–1932. doi:10.1016/S0276-1092(08)70241-4. [DOI] [PubMed] [Google Scholar]
- 11. Chung SS, Lee CS, Kang CS. Lumbar total disc replacement using ProDisc II: a prospective study with a 2-year minimum follow-up. J Spinal Disord Tech. 2006;19:411–415. doi:10.1097/00024720-200608000-00007. [DOI] [PubMed] [Google Scholar]
- 12. Putzier M, Funk JF, Schneider SV, et al. Charité total disc replacement—clinical and radiographical results after an average follow-up of 17 years. Eur Spine J. 2006;15:183–195. doi:10.1007/s00586-005-1022-3. [DOI] [PMC free article] [PubMed] [Google Scholar]
- 13. Lemaire JP, Carrier H, Sariali el-H, Skalli W, Lavaste F. Clinical and radiological outcomes with the Charité artificial disc: a 10-year minimum follow-up. J Spinal Disord Tech. 2005;18:353–359. doi:00024720-200508000-00010. [DOI] [PubMed] [Google Scholar]
- 14. David T. Long-term results of one-level lumbar arthroplasty: minimum 10-year follow-up of the Charite artificial disc in 106 patients. Spine (Phila Pa 1976). 2007;32:661–666. doi:10.1097/01.brs.0000257554.67505.45. [DOI] [PubMed] [Google Scholar]
- 15. Fritzell P, Berg S, Borgström F, Tullberg T, Tropp H. Cost effectiveness of disc prosthesis versus lumbar fusion in patients with chronic low back pain: randomized controlled trial with 2-year follow-up. Eur Spine J. 2011;20:1001–1011. doi:10.1007/s00586-010-1607-3. [DOI] [PMC free article] [PubMed] [Google Scholar]
- 16. Park SJ, Lee CS, Chung SS, Lee KH, Kim WS, Lee JY. Long-term outcomes following lumbar total disc replacement using ProDisc-II: average 10-year follow-up at a single institute. Spine (Phila Pa 1976). 2016;41:971–977. doi:10.1097/BRS.0000000000001527. [DOI] [PubMed] [Google Scholar]
- 17. Whang PG, Simpson AK, Rechtine G, Grauer JN. Current trends in spinal arthroplasty: an assessment of surgeon practices and attitudes regarding cervical and lumbar disk replacement. J Spinal Disord Tech. 2009;22:26–33. doi:10.1097/BSD.0b013e3181659804. [DOI] [PubMed] [Google Scholar]
- 18. Phurrough S, Salive ME, Connor D, Schafer J. Decision memo for lumbar artificial disc replacement (LADR) (CAG-00292R). https://www.cms.gov/medicare-coverage-database/details/nca-decision-memo.aspx?NCAId%20=%20197&NcaName%20=%20Lumbar+Artificial+Disc+Replacement+(LADR)&ver%20=%2018&DocID%20=%20CAG-00292R&bc%20=%20gAAAAAgAIAAA&. Published August 14, 2007. Accessed August 3, 2017.
- 19. Jancuska JM, Hutzler L, Protopsaltis TS, Bendo JA, Bosco J. Utilization of lumbar spinal fusion in New York State: trends and disparities. Spine (Phila Pa 1976). 2016;41:1508–1514. [DOI] [PubMed] [Google Scholar]
- 20. Nie H, Chen G, Wang X, Zeng J. Comparison of total disc replacement with lumbar fusion: a meta-analysis of randomized controlled trials. J Coll Physicians Surg Pak. 2015;25:60–67. doi:01.2015/JCPSP.6067. [PubMed] [Google Scholar]
- 21. Levin DA, Bendo JA, Quirno M, Errico T, Goldstein J, Spivak J. Comparative charge analysis of one- and two-level lumbar total disc arthroplasty versus circumferential lumbar fusion. Spine (Phila Pa 1976). 2007;32:2905–2909. doi:10.1097/BRS.0b013e31815b84ae. [DOI] [PubMed] [Google Scholar]
- 22. Buttacavoli FA, Delamarter RB, Kanim LE. Cost comparison of patients with 3-level artificial total lumbar disc replacements versus 360° fusion at 3 contiguous lumbar vertebral levels: an analysis of compassionate use at 1 site of the US investigational device exemption clinical trial. SAS J. 2010;4:107–114. doi:10.1016/j.esas.2010.07.002. [DOI] [PMC free article] [PubMed] [Google Scholar]
- 23. Hewitt Aon. 2017. Global medical trend rates. http://www.aon.com/attachments/human-capital-consulting/2017_GB_Trends_brochure_20170105.pdf. Accessed August 3, 2017.


