Abstract
We have characterized transcripts for nine major intrinsic proteins (MIPs), some of which function as water channels (aquaporins), from the ice plant Mesembryanthemum crystallinum. To determine the cellular distribution and expression of these MIPs, oligopeptide-based antibodies were generated against MIP-A, MIP-B, MIP-C, or MIP-F, which, according to sequence and functional characteristics, are located in the plasma membrane (PM) and tonoplast, respectively. MIPs were most abundant in cells involved in bulk water flow and solute flux. The tonoplast MIP-F was found in all cells, while signature cell types identified different PM-MIPs: MIP-A predominantly in phloem-associated cells, MIP-B in xylem parenchyma, and MIP-C in the epidermis and endodermis of immature roots. Membrane protein analysis confirmed MIP-F as tonoplast located. MIP-A and MIP-B were found in tonoplast fractions and also in fractions distinct from either the tonoplast or PM. MIP-C was most abundant but not exclusive to PM fractions, where it is expected based on its sequence signature. We suggest that within the cell, MIPs are mobile, which is similar to aquaporins cycling through animal endosomes. MIP cycling and the differential regulation of these proteins observed under conditions of salt stress may be fundamental for the control of tissue water flux.
The physiology of plant water relations is receiving renewed attention following the detection of a superfamily of “major intrinsic proteins” (MIPs) (Reizer et al., 1993), which function as channels facilitating the movement of water and/or uncharged, low-Mr solutes (Maurel, 1997; Agre et al., 1998; Biela et al., 1999; Gerbeau et al., 1999). MIPs are called water channels or aquaporins once their ability to facilitate water flux has been demonstrated. Although their existence is irrefutable, conceptual reservations exist as to whether they are important conduits for water flux or minor players in plant water relations (Steudle, 1997; Tyerman et al., 1999). Information about the size of the Mip gene family, transcript expression, and the regulation of expression is available, but less is known about proteins and their dynamic behavior under normal conditions or conditions that force changes in water status.
Plant genomes include a large number of Mip genes (Chrispeels et al., 1999). In Arabidopsis, for example, at least 23 different transcripts are found, and an analysis of corn expressed sequence tags indicates that more than 30 Mip genes should be present (Weig et al., 1997; Barrieu et al., 1998; Tyerman et al., 1999). Plant Mip genes can be grouped into three subfamilies based on phylogenetic analysis (Yamada et al., 1995; Weig et al., 1997). The two major groups divide MIPs according to location in either the plasma membrane (PM) or tonoplast and, possibly, according to functions (Daniels et al., 1994; Kammerloher et al., 1994; Yamada et al., 1995; Maurel, 1997; Tyerman et al., 1999).
Mip transcripts have been detected in every tissue analyzed. They may be abundant or rare, and some are under developmental control. Mip genes are seed, root, and leaf specific, and are associated with leaf expansion, root tip elongation, or seedling development (Guerrero et al., 1990; Yamamoto et al., 1991; Höfte et al., 1992; Jones and Mullet, 1995; Fukuhara et al., 1999). Cell specificity has been reported for some Mip genes based on in situ hybridizations or by monitoring Mip-promoter-controlled uidA (β-glucuronidase [GUS]) activity (Yamamoto et al., 1991; Jones and Mullet, 1995; Kaldenhoff et al., 1995; Yamada et al., 1995, 1997; Barrieu et al., 1998; Chaumont et al., 1998). Studies on Mip expression have indicated regulation by environmental factors such as drought, salinity, or temperature (Yamaguchi-Shinozaki et al., 1992; Jones and Mullet, 1995; Yamada et al., 1995; Maurel, 1997; Johansson et al., 1998).
The only large-scale analysis of Mip transcripts has been conducted with Arabidopsis (Weig et al., 1997). Based on PCR amplification, this study provided evidence for dramatic differences in transcript abundance between Mip expressed in various organs. Studies on water channel activity are based on the expression of Mip RNA in Xenopus oocytes. Measurements of volume changes and water permeability in oocytes expressing plant Mip show water channel activity upon changes in the external osmoticum (Maurel et al., 1993; Daniels et al., 1994; Kammerloher et al., 1994; Yamada et al., 1995). However, even for Arabidopsis, activity has been tested only for a minority of the presumptive aquaporins. A few studies indicate that MIPs are also active in water flux in planta (Kaldenhoff et al., 1995, 1998). In transgenic plants, antisense expression of a MIP-coding region reduced the number of water channels. When protoplasts were isolated from these plants and transferred to medium with lower osmolarity, they resisted water influx longer and burst later than protoplasts from non-transformed plants.
Missing in the analysis of plant MIPs are comparative studies of proteins and their distribution in individual cells and tissues. Following initial studies on Mip transcript expression in the ice plant Mesembryanthemum crystallinum (Yamada et al., 1995), we focused on the proteins to explore cell specificity, because location might provide further clues about function. With antibodies directed against peptides selected to distinguish different MIPs, we were able to identify several proteins. Most antibodies identify proteins in more than one organ, but show remarkable diversity in the amount present in different cells of a tissue. MIP-A, MIP-B, and MIP-C can be identified by signature cells in tissues in which they are highly expressed, while the tonoplast-located MIP-F seems to be ubiquitously present albeit with different amounts in different cell types. In addition, we present evidence for differential regulation of MIP under salt stress and the localization of PM MIP in internal membranes, suggesting endosomal trafficking of these proteins.
RESULTS
Peptide Antibodies against M. crystallinum MIP
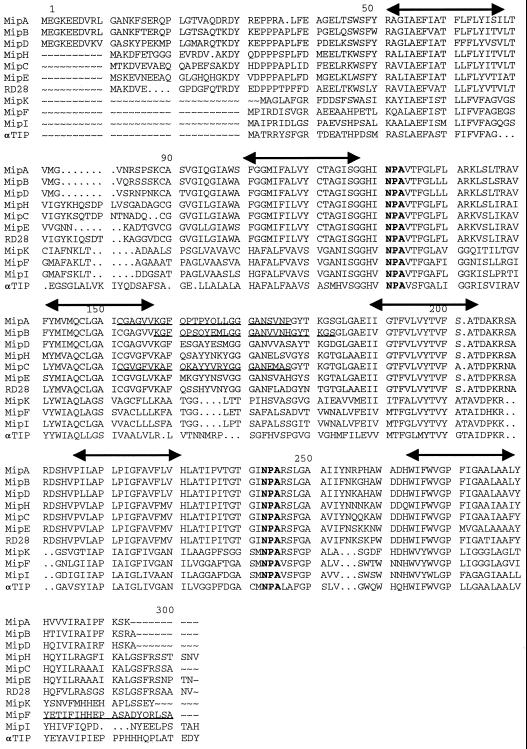
We previously characterized three transcripts putatively encoding MIPs in M. crystallinum (Yamada et al., 1995). Functional analysis of two of the encoded proteins was carried out by injection of cRNA into Xenopus oocytes. Expression of both transcripts facilitated water movement to some degree, but much less actively than the control aquaporin used, γ-tonoplast intrinsic protein (γ-TIP) from Arabidopsis (Yamada et al., 1995). We have since characterized a total of 14 transcripts encoding different members of the MIP family in M. crystallinum. Figure 1 presents the deduced amino acid sequences of the nine full-length putative water channel proteins that have been isolated: MIP-A to MIP-F, and MIP-H, MIP-I, and MIP-K. We compared these sequences with the Arabidopsis PM-MIP RD28 (Yamaguchi-Shinozaki et al., 1992) and the α-TIP from bean (Johnson et al., 1990).
Figure 1.
Deduced protein sequences of two authentic aquaporins (MIP-A and MIP-B) and seven putative PM- and tonoplast-MIPs from M. crystallinum are compared with Arabidopsis RD28 and bean α-TIP. Three of the nine sequences have been reported previously (Yamada et al., 1995; accession nos: MIP-A, L36095; MIP-B, L36097; MIP-C, U73466; MIP-D, U26537; MIP-E, U73467; MIP-F, U43291; MIP-H, AF133530;MIP-I, AF133531; and MIP-K,AF133532). Putative transmembrane regions are marked by double arrows above the sequences. The signature motifs (NPA) for aquaporins are shown in bold. Sequences used for oligopeptide synthesis are underlined. Cys residues were added to the amino termini of MIP-F oligopeptides. Cys were acetylated for conjugation to agarose prior to affinity purification of the crude serum. The other oligopeptides utilized a Cys that was present in the sequences.
By sequence homology, parsimony analysis (Yamada et al., 1995; Weig et al., 1997), and comparison with other MIPs of known subcellular location (Maurel, 1997), six of the proteins (MIP-A to MIP-E and MIP-H) should be located in the PM, while the MIP-F, MIP-I, and MIP-K sequences align with tonoplast-located MIP. Identity between the ice plant PM-MIP ranges from 70.1% to 88.0%, while MIP-F, for example, is 55.7% identical to the α-TIP from bean (Johnson et al., 1990). Underlined in Figure 1 are sequences of peptides synthesized to generate antibodies against MIP-A, MIP-B, MIP-C, and MIP-F. For MIP-A, MIP-B, and MIP-C, the region chosen for antibody production, represents the second extracellular loop (Jung et al., 1994). For MIP-F, the carboxy-terminal end of the protein was selected. All antisera were specific for the peptide against which they were raised, and did not react with the other peptides (data not shown).
Immunocytological Localization
Several figures present data on the location of MIP in different tissues. In general, the MIP antisera highlight different cell types, and each MIP can be identified by signature cells in which they show strong signals, although there were low-intensity, possibly background, reactions with other cell types. This may also represent signals based on recognition of more than one MIP in addition to the reaction with the protein carrying the chosen peptide sequence.
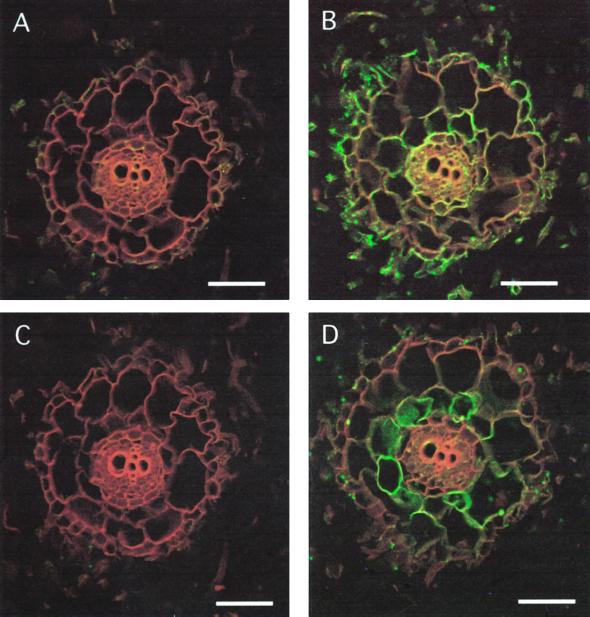
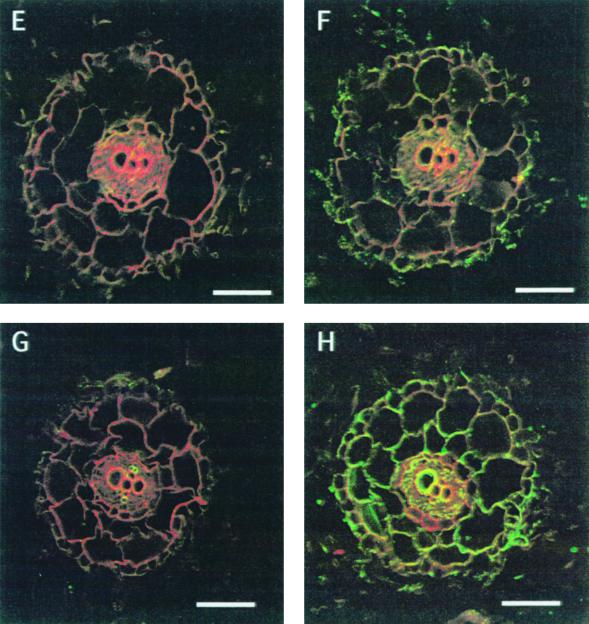
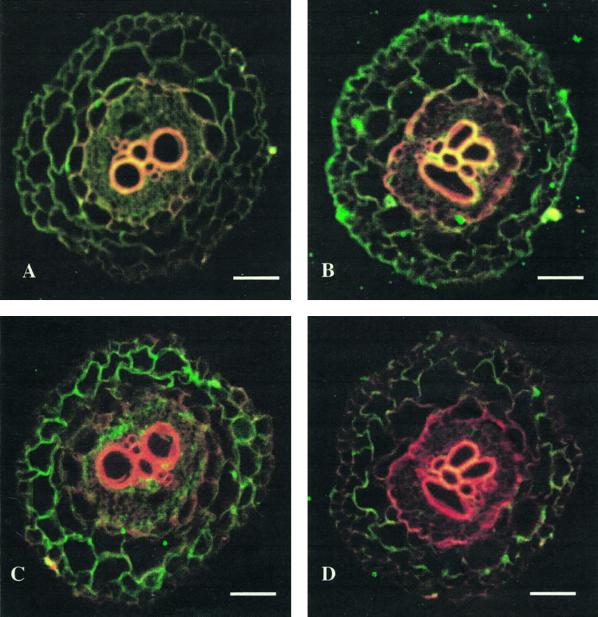
In roots, MIPs show a characteristic expression pattern (Figs. 2 and 3). We include cross-sections using the antisera against MIP-A, MIP-B, MIP-C, and MIP-F. For each antiserum, the preimmune serum response is shown (Fig. 2, A, C, E, and G). MIP-A (derived from the most abundant Mip transcript isolated) is most strongly expressed in the epidermis of the young root, including the root hairs (which appear as green dots in Fig. 2B). Less expression is found in the cortex, but the signal increases toward the center such that the innermost cortex cell layer shows a clear signal that persists in the endodermis and the vasculature (Fig. 2B). MIP-B antiserum shows a weak signal in root hairs, but highlights very strongly the innermost cortex cell layer (Fig. 2D). MIP-C (Fig. 2F) is a root-specific MIP absent from aerial parts of the plant. Immunolocalization of MIP-C indicated that it is present in all cells of the immature root coinciding with the elongation zone close to the root tip, most strongly in the epidermis (Fig. 2F).
Figure 2.
Immunolocalization of MIP-A, MIP-B, MIP-C, and MIP-F in immature roots of M. crystallinum. Fixed cross-sections (8–10 μm) of minor immature roots within 3 mm of the meristem were incubated with anti-MIP antibodies followed by goat anti-rabbit IgG coupled to Cy-5. Individual images for the emission of autofluorescence and for the Cy-5 fluorochrome were collected sequentially from the same optical section of the tissue, pseudocolored, and merged. Red/orange represents autofluorescence and green identifies MIP localization. Co-localization of the Cy-5 and tissue fluorescence is represented by yellow. The section shown in A and C was successively stained with MIP-A and MIP-B preimmune serum. A, C, E, and G represent images after staining with preimmune serum for MIP-A, MIP-B, MIP-C, and MIP-F, respectively. B, D, F, and H are stained with serum to MIP-A, MIP-B, MIP-C, and MIP-F, respectively. The bars represent 150 μm.
Figure 3.
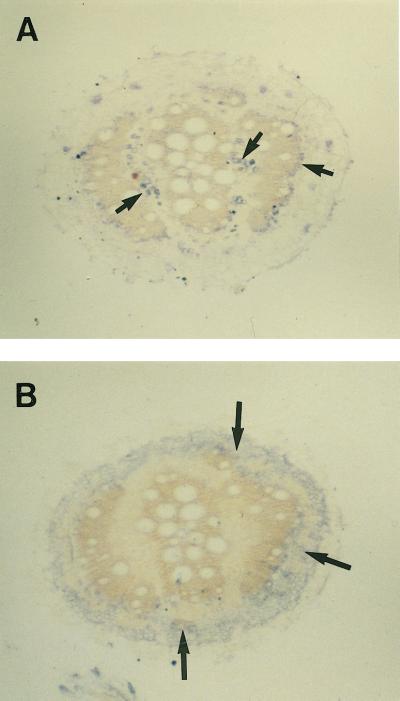
MIP-A (A) and MIP-F (B) antibodies show differential localization in mature roots. Sections more than 10 cm from the root tip were incubated with anti-MIP antibodies followed by goat anti-rabbit IgG coupled to peroxidase. The signals reflecting the localization of the protein are seen as gray to bluish spots. A, Anti-MIP-A antibodies stain patches of phloem (small arrows) surrounding xylem rings that develop in the mature root. B, Anti-MIP-F antibodies stain a region surrounding the outermost xylem ring (large arrows) in the cortex of the root. The bars represent 500 μm.
Similarly, the tonoplast MIP-F is detected in all root cells (Fig. 2H). Examples for the expression of MIP in mature roots are shown in Figure 3. The expression of MIP-A (Fig. 3A) is confined to distinct areas, which at higher magnification are shown to coincide with islands of phloem-associated cells. A very different distribution is observed with antiserum against MIP-F (Fig. 3B). MIP-F is present in a ring that is many cell layers wide surrounding the xylem layers, which in mature roots can amount to three rings of xylem bands.
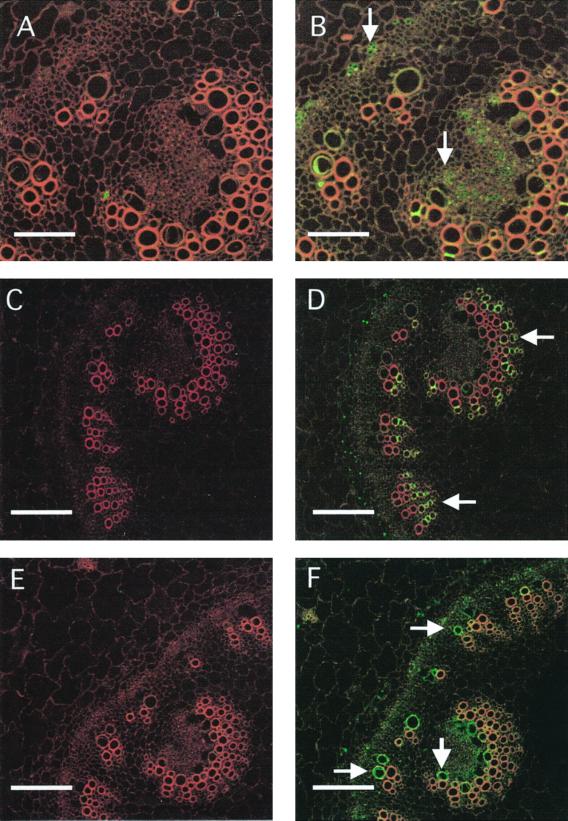
Signals for MIP-A, MIP-B, and MIP-F developed with preimmune serum and antiserum reactions are shown for equivalent sections of the stem, including petiole vascular traces (Fig. 4). MIP-A produced the strongest signals with the phloem companion cells, and to some degree with sieve element cells (Fig. 4B). Less intense were signals that highlighted the youngest developing xylem vessels that still contained cytoplasm and—infrequently—connected cell walls between some large xylem vessels. MIP-B showed a different distribution of signals and, like MIP-A, highlighted two different cell types (Fig. 4D). The strongest signal was with cells of the central part of the xylem vessels. Another cell type that contained the signal was a layer of cells outside the phloem ring that surrounds the central vascular structure of the stem. MIP-F is strongly expressed in cells between the xylem and phloem (both in petiole and stem), less in phloem cells, and strong again in the still-developing xylem vessels of petiole and stem vasculature (Fig. 4F).
Figure 4.
Cell-specific expression of MIP-A, MIP-B, and MIP-F in stem sections. Fixed cross-sections (8–10 μm) of stems were used and treated as described in Figure 2. A, C, and E represent images after staining with preimmune serum for MIP-A, MIP-B, and MIP-F, respectively. B, D, and F are stained with serum against MIP-A, MIP-B, and MIP-F, respectively. Bars in A and B represent 70 μm, and in C through F, 150 μm. Arrows in B point to phloem elements, arrows in D to old xylem vessels and xylem parenchyma, and arrows in F to developing xylem vessels.
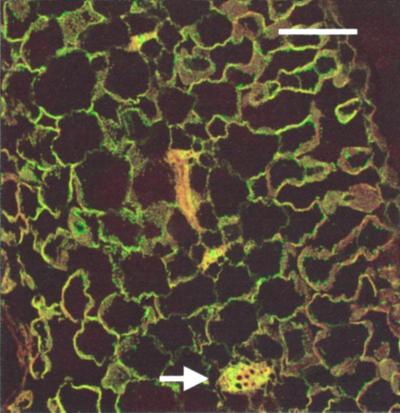
In Figure 5, we include staining in mesophyll cells using MIP-F. No staining of mesophyll cells was obtained with MIP-A or MIP-B, indicating that if these MIP were present at all, they remained below the detection limit for the antibodies. The anti-MIP-F antiserum produces a signal with mesophyll cells, but it is much weaker than the signal observed with cells of the vasculature. At higher magnification (not shown), the signal dissolves into discrete patches, which may be an indication that MIPs are not uniformly distributed within the membrane.
Figure 5.
Low amounts of MIP-F were detected in mesophyll cells. Staining of mesophyll cells in a mature leaf treated as described in Figure 2 appears weaker than staining of vascular tissues visible as minor veins (arrow). The bar represents 70 μm.
Membrane Localization of MIP
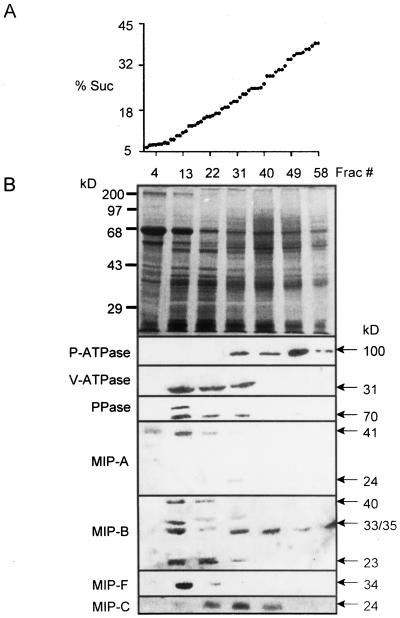
Previously we have shown, using discontinuous Suc density gradient centrifugation, the cellular membrane localization of MIP (Barkla et al., 1999). MIP-F, as expected, was detected in the purified tonoplast fraction. However, the signals generated with putatively PM-located MIP (MIP-A, MIP-B, and MIP-C) were less clear as antibodies reacted with both purified PM and tonoplast fractions (Barkla et al., 1999). For a better understanding of the membrane distribution of the MIPs, microsomal membranes were separated on continuous Suc gradients (Fig. 6). Figure 6A shows the linearity of the continuous Suc gradient (68 fractions of approximately 500 μL each), and the SDS-PAGE protein profiles of selected gradient fractions are shown at the top of Figure 6B. Antibody recognition of marker enzymes (P-ATPase, V-ATPase, and V-PPase) and MIP in these fractions from the continuous Suc gradients are shown below.
Figure 6.
Localization of MIPs in membrane fractions separated by continuous Suc density gradient centrifugation. A, Suc concentrations in collected fractions show linearity of the gradient. B, Membrane protein profile from M. crystallinum cell suspensions of selected fractions on Coomassie Blue-stained gels (12.5% [w/v] acrylamide) and immunological detection in the respective fractions of (from top to bottom) P-ATPase, V-ATPase, V-PPase, MIP-A, MIP-B, and MIP-F (in membrane protein isolated from cell suspensions) and MIP-C (in membrane protein isolated from roots). Molecular masses of bands are indicated.
The MIP-F signal at approximately 34 kD clearly coincided with the V-PPase and V-ATPase markers, suggesting an exclusively tonoplast localization (Fig. 6B, MIP-F). The putative PM-MIP, however, showed very different distributions, which could not be reconciled with either a PM or a tonoplast localization (Fig. 6B, MIP-A, MIP-B, and MIP-C). MIP-A existed mainly as a putative dimer form (41 kD), and its distribution partially overlapped with fractions containing tonoplast proteins (Fig. 6B, MIP-A). We suggest that a major percentage of the MIP-A protein is located in a membrane that has a lower buoyant density than the tonoplast, which may represent a unique type of vacuole or which may be different from vacuolar membranes altogether.
Only a very faint signal for the monomeric form (24 kD) was observed in fraction number 31, which overlaps with PM markers. MIP-B signals were even more complex (Fig. 6B, MIP-B). At least four protein bands were revealed—possibly indicating that the antibody recognizes more than one MIP (for example, a protein whose transcript has not yet been isolated). A dimer band (approximately 35 kD) and a band at approximately 23 kD were enriched in fractions that appeared to coincide with tonoplast markers. At 33 kD, the major band extends through tonoplast fractions and across the entire gradient with three maxima—at fraction number 13 (tonoplast), fractions number 30 to 40 (intermediate between tonoplast and PM), and in the heaviest part of the gradient at fractions number 58 to 65. MIP-C provided a signal that overlapped both with the PM and the tonoplast fractions (Fig. 6B, MIP-C).
MIP and Salt Stress
Osmotic stress tolerance requires that water flux is regulated. Lowering the external osmotic potential of M. crystallinum by salt shock leads to a rapid loss of turgor in most leaves, but within 24 h turgor is re-established (Adams et al., 1998). Previously, we showed slight-to-moderate reductions in the number of MipA, MipB, and MipC transcripts upon exposure to osmotic stress, which were remedied completely after 1 to 2 d (Yamada et al., 1995). Similar fluctuations of low magnitude have now been observed with other Mip transcripts, but no systematic analysis was attempted, as it appeared that post-transcriptional and post-translational factors played a much larger role in MIP regulation than did gene expression.
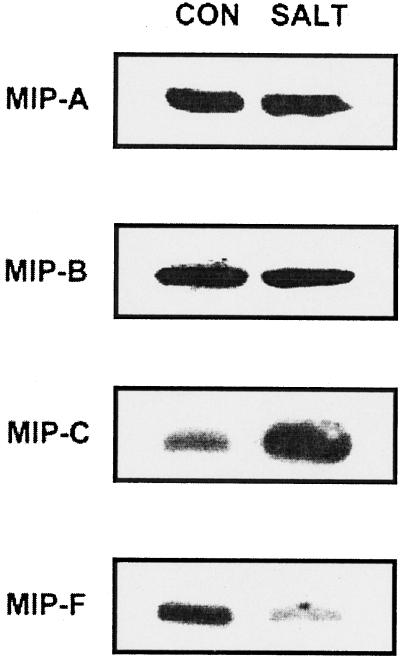
The behavior of the MIP under stress reflects regulation of protein amount. Figure 7 shows protein blots obtained from leaf membrane fractions reacted with antibodies against MIP-A, MIP-B, and MIP-F, and from root membrane fractions reacted with antibodies against MIP-C. All MIPs tested were present in unstressed tissues. In plants treated with 200 mm NaCl for 2 weeks, no changes in the amount of the MIP-A 41-kD polypeptide or any of the MIP-B polypeptides (33 kD in Fig. 7 and 23, 35, and 40 kD, data not shown) were observed. In contrast, the amount of the MIP-F 34-kD polypeptide was clearly a function of the stress conditions (Fig. 7), with lower amounts in the stressed tissue. The same behavior has been observed with protein extracts from suspension cells (data not shown).
Figure 7.
Western-blot analysis of the effect of salt-stress on levels of MIP polypeptides in purified root or leaf PM or tonoplast. PM (MIP-B, 33-kD polypeptide; MIP-C, 24-kD polypeptide) or tonoplast (MIP-A, 41-kD polypeptide; MIP–F, 34-kD polypeptide) purified from leaves (MIP-A, MIP-B, or MIP-F) or roots (MIP-C) of M. crystallinum. CON, Control (in the absence of stress); SALT, plants treated with 200 mm NaCl for 2 weeks. Plant age (6 weeks) was identical under control and stress conditions.
In roots, the number of MIP-C 24-kD polypeptides was also altered upon stress (Fig. 7), but results were opposite to those found for MIP-F in the leaves, as MIP-C amounts significantly increased under salt stress. Changes in the number of MIPs in response to salt under stress conditions could also be seen immunocytologically (Fig. 8). As an example, MIP-A, which showed signals in all cells of the root tip, albeit at different intensities in different cells, was either not affected by the presence of sodium or even increased slightly (400 mm NaCl for 72 h; Fig. 8, A and B). In contrast, the signal for MIP-F was relatively abundant in the root tip before stress, but declined strongly and rapidly following stress (Fig. 8, C and D). The sections were cut at approximately the same distance from the tip, but the stressed roots, which grew more slowly than the unstressed control roots, had developed additional xylem cells, indicating how the vasculature had matured during a 72-h stress period.
Figure 8.
Cell-specific changes in MIP-A and MIP-F following salt stress in M. crystallinum immature roots. Immunocytological analysis of MIP-A (A and B) and MIP-F (C and D) indicated persistence of the MIP-A signal following salt stress (B), while the signal for MIP-F declined (D). Root tips were obtained from plants grown in hydroponic culture 3 d after the addition of 400 mm NaCl, and sections were prepared as described in Figure 2. A and C, Untreated control roots for MIP-A and MIP-F, respectively. The bars represent 70 μm.
DISCUSSION
We have characterized 14 full-length and partial Mip-like transcripts from M. crystallinum, yet it is highly likely that, as in Arabidopsis and corn, the total number of Mip genes will exceed 20 or 30 (Chrispeels et al., 1999; Tyerman et al., 1999). Transcripts characterized so far are for abundantly expressed MIP found in mature plants (for a description of the plant's life cycle, see Adams et al., 1998). We know, however, from PCR analysis with conserved primers that many MIPs are strongly expressed during germination, early seedling growth, and seedling establishment (Fukuhara et al., 1999). In addition, several MIP-like sequences, which are expressed at developmental states for which we have not yet generated cDNA libraries, were obtained from genomic libraries (C.B. Michalowski and F. Quigley, unpublished data). In several plant species, a high expression of Mip has been found in tissues that contain large percentages of expanding cells or show high water conductance (Johnson et al., 1990; Jones and Mullet, 1995; Yamada et al., 1995; Sarda et al., 1997; Fukuhara et al., 1999).
Phylogenetic alignments of plant Mip transcripts or proteins has distinguished two major groups (Yamada et al., 1995; Weig et al., 1997; Tyerman et al., 1999). The few localization studies that have been carried out have permitted an assignment for members of these two groups as either TIPs or PM intrinsic proteins (PIPs). A third minor group in plants includes more distantly related sequences (Maurel, 1997; Weig et al., 1997; Tyerman et al., 1999), which may be targeted to yet another subcellular site (e.g. the peribacteroid membrane in legumes) or which might have specialized transport functions.
Subcellular membrane fractionation separating PM from tonoplast documented clearly the exclusive localization of MIP-F in the tonoplast fraction, which is in agreement with its phylogenetic classification (Fig. 6B; Barkla et al., 1999). Our results with the other, presumably PM-located, MIP were unexpected. According to their sequence signatures, these proteins should have produced signals exclusively in PM fractions, but instead strong signals were detected elsewhere on the gradient, including fractions that overlapped with tonoplast (MIP-B and MIP-C) and, in the case of MIP-A, in fractions of a lower density than the tonoplast (Fig. 6B). Evidence for PIP localization in internal membranes is supported by other observations. Robinson et al. (1996) detected PIP-enriched invaginations of the PM, structures termed “plasmalemmasomes,” in mesophyll cells of Arabidopsis. These invaginations are also reminiscent of the budding of endosomes, vesicles in which animal MIPs have repeatedly been localized. These (aquaporin storage) vesicles fuse with the PM under hormonal control when water flux in animals is enhanced (Harris et al., 1994; Agre et al., 1998).
It seems possible that the additional signals we observed were due to plasmalemmasome distribution within the lighter density fractions, or to the recognition of a different type of vesicle distinct from either the PM or the tonoplast. We consider it unlikely that the recognition of these proteins reflects newly synthesized MIP on the way from the Golgi apparatus to the PM. Instead, we favor the view of MIPs trafficking through the endomembrane system, as the case in animal cells, in which MIP can cycle independently from the trans-Golgi complex to the PM. The lifetime of (some) animal MIPs includes localization in endosomes (Siner et al., 1996; Gustafson et al., 1998; Valenti et al., 1998), where they may either be on their way to degradation or in a cycling route between endosomes and the PM when water flux is altered. Particularly relevant in the context of stress is the observation of aquaporins in skin cells of toads. In these cells, protein disappeared from the PM during osmotic stress (Abrami et al., 1995; Siner et al., 1996). Similarly, cycling of aquaporins has been reported in cells of the kidneys' collecting duct during osmotic stress (Sasaki et al., 1998) and in response to the peptide hormone vasopressin (Knepper and Inoue, 1997; Wells, 1998).
The cytological analyses provided data that could help in a re-evaluation of how we view water channels in plants. Up to the present, few immunological analyses monitored cell specificity of individual MIPs (Yamamoto et al., 1991; Jones and Mullet, 1995; Kaldenhoff et al., 1995; Sarda et al., 1997). Other analyses reported transcript location using in situ hybridization (Yamada et al., 1995; Sarda et al., 1997; Barrieu et al., 1998; Chaumont et al., 1998) or the analysis of Mip-promoter GUS fusions (Yamamoto et al., 1991; Yamada et al., 1997). We have chosen to present immunological data from root and stem analysis because the signature cell types that distinguish the four proteins for which we generated antibodies are most clearly observed in these tissues. Analyses indicate that MIPs are not only cell specific but can also be assigned to certain developmental phases. MIP-C, for example, is only found in a small segment of the root, coinciding with cell elongation close to the root tip (Fig. 2). MIP-A and MIP-B are most highly expressed in cells of the vasculature. MIP-A is most abundant in cells of the phloem (Fig. 2; see also Barkla et al., 1999) and MIP-B in cells of the xylem parenchyma (Fig. 2).
In addition, the figures chosen show several remarkable features of MIP localization. MIP-B signals, for example, are observed between xylem vessels, which should not contain cytoplasm, at a location where no proteinaceous membrane is expected (Fig. 4). Hypothetically, the antibody signal and location might indicate PM strands or remnants from adjacent xylem parenchyma cells protruding into these areas. A strong signal in this area between cells and in xylem parenchyma has also been observed with promoter Mip-B-GUS fusions in transgenic tobacco (Yamada et al., 1997). In addition, the presence of MIP-B is found in small areas of adjacent xylem vessels and xylem parenchyma cells (Fig. 4). Is this observation an indication for the existence of a specific orientation between these cells? Similar patchy areas are observed with MIP-A in the youngest xylem elements, and we also observed MIP-F signals in patches (Fig. 5), possibly representing membrane areas with high concentrations of water channel proteins.
In all of these analyses, however, we are faced with the problem of antibody specificity. As long as we have not identified all Mip genes from the ice plant, it is possible—and even likely—that the peptide sequences selected for antiserum production could be shared by more than one protein. The multiple bands, which we observed for MIP-B in particular (Fig. 7), might be based on the recognition of multiple MIPs. However, our analyses of MIP document signals in different cells, distinguishable expression profiles, proteins of different Mr and distinct subcellular locations, i.e. the antibodies assign signature cell types to each MIP (or possibly to each subfamily of MIP).
Conceivably, more than one tonoplast MIP could be recognized by the antiserum against MIP-F. It is most highly expressed in cells with high water flux capacity (e.g. the youngest xylem vessels, sieve elements, and practically all cells of the extreme root tip). It could also be ubiquitously expressed throughout the plant. The fact that MIP-F antiserum highlights only a single Mr band throughout seems to indicate, however, that we target just one protein with this antibody. Even assuming that (some) antibodies might be polyspecific, the separation of proteins with the sequence signatures of PIP with intracellular membrane fractions remains remarkable, because the TIP and PIP subfamilies of MIP show substantial sequence differences that preclude cross-recognition.
Of the MIPs tested, MIP-F and MIP-C were the most sensitive to salt-stress conditions. The abundance of MIP-F is altered in tonoplast isolated from leaves by salt stress and it disappears rapidly from the roots as the external sodium concentration increases (Figs. 7 and 8). If our MIP-F antibodies recognized more than one TIP, the conclusion would have to be that the amount of tonoplast-localized MIPs in M. crystallinum is down-regulated by salinity stress. This finding could provide an explanation about one aspect of the plant's formidable tolerance to osmotic stress. Down-regulation of the abundant tonoplast MIP-F might be a mechanism for restricting the loss of water (or a limit to sodium influx) from vacuoles. In contrast, up-regulation of MIP-C in the PM fraction of roots, which might be controlled by endosome trafficking, may increase the cellular uptake of water in the plants.
The concept that water flows through channels not connected to ion fluxes is an established paradigm in animal physiology (Zhang et al., 1993; Agre et al., 1998). Regulatory circuits involving phosphorylation, G-proteins, cyclic nucleotides, and hormones can lead to very rapid changes in aquaporin composition and amount in animal cell membranes. In kidney epithelia, for example, regulation of aquaporin cycling through an internal membrane system by cAMP and G-proteins has been shown (Valenti et al., 1998). In plants, the concept of channel-mediated water flux has received support through the use of classical techniques. Henzler and Steudle (1995), for example, recognized the participation of channels in water movement using pressure probe measurements after some of the channels had been poisoned by mercury. Generally, however, the contribution of water channels to plant water relations is considered marginal (for a discussion, see Tyerman et al., 1999).
How will the preliminary evidence for membrane trafficking of plant MIPs fit into the general picture of water relations on the whole-plant level, in tissues, and in individual cells? How does cell specificity of MIP relate to vigor, growth of meristems, and developmental switches? Previous studies have viewed water relations in plants (assuming passive, pressure-driven movement) as a problem that can be solved by hydraulic equations (Steudle, 1997). However, the complexity of MIP location and amount in different cells indicates the requirement for cell- and tissue-specific, developmental, and environmental regulation of these proteins. Therefore, water flux in plants is a dynamic process that is controlled at many different levels and differently in many cells. It will be essential to integrate water channels into our view of plant tissue water relations, which will result in a less-mechanical view of the plant water uptake and long-distance transport system than what has been assumed in the past.
MATERIALS AND METHODS
Plant Materials
Mesembryanthemum crystallinum plants were grown in chambers (ConViron, Asheville, NC) with incandescent and fluorescent light (500–550 μE m−2 s−1; 12 h of light; 23°C [light], 18°C [dark]). Seeds were germinated in vermiculite and seedlings transplanted to either soil in 32-oz styrofoam cups (one plant per pot) or to hydroponic tanks containing one-half-strength Hoagland nutrient solution (Ostrem et al., 1987). Soil-grown plants were well-watered with nutrient solution throughout the experiments. Plants were salt-stressed by supplying nutrient solution containing the appropriate concentration of NaCl (Adams et al., 1998). Control plants were grown in parallel and harvested at the same time. Cell suspension cultures were maintained as previously described (Vera-Estrella et al., 1999).
Membrane Isolation and Purification
Membranes were isolated from M. crystallinum plants and cell suspension cultures as previously described (Barkla et al., 1995; Vera-Estrella et al., 1999). Cells were ground in a bead beater (Biospec Products, Batlesville, OK) using 0.5-mm glass beads, leaves and roots were homogenized in a blender in the presence of 300 mL of ice-cold homogenization medium (400 mm mannitol, 10% [w/v] glycerol, 5% [w/v] PVP-10, 0.5% [w/v] bovine serum albumin [BSA], 1 mm phenylmethylsulfonyl fluoride [PMSF], 30 mm Tris, 2 mm dithiothreitol [DTT], 5 mm EGTA, 5 mm MgSO4, 0.5 mm butylated hydroxytoluene, 0.25 mm dibucaine, 1 mm benzamidine, and 26 mm K+-metabisulfite, adjusted to pH 8.0 with H2SO4). All operations were carried out at 4°C. Homogenized tissue was filtered through two layers of cheesecloth and centrifuged at 10,000g for 20 min at 4°C using a superspeed centrifuge (model RC5C, Sorvall, Newtown, CT). Pellets were discarded and the supernatant was centrifuged at 100,000g for 50 min at 4°C using a fixed-angle rotor (model 55.2 Ti, Beckman Instruments, Fullerton, CA) in an ultracentrifuge (model L8-M, Beckman Instruments).
The supernatant was aspirated and the microsomal pellet was resuspended in 5 mL of suspension medium (400 mm mannitol, 10% [w/v] glycerol, 6 mm Tris/2-[N-morpholino]-ethanesulfonic acid [MES], pH 8.0, and 2 mm DTT), using a 10-mL glass tissue homogenizer. Microsomes were then layered onto either continuous (5%–45% [w/v] Suc) or discontinuous (16% [w/v], 32% [w/v], or 38% [w/v] Suc) Suc gradients. Gradients were centrifuged at 100,000g for 3 h at 4°C using a swinging bucket rotor (model SW 28, Beckman Instruments) in an ultracentrifuge (model L8-M, Beckman Instruments). Tonoplast was collected from the 0%/16% (w/v) Suc interface and PM from the 32%/38% (w/v) Suc interface of the discontinuous Suc gradient. Bands from the discontinuous Suc gradient or fractions (0.5 mL) from the continuous Suc gradient were collected, frozen in liquid N2, and stored at −80°C. Suc concentration was measured using a refractometer (Zeiss, Jena, Germany). We showed previously that M. crystallinum cell suspensions and leaves show similar responses (Vera-Estrella et al., 1999).
Protein Determination
Protein content in microsomal and purified PM or tonoplast fractions was measured by a modification of the dye-binding method of Bradford (1976), in which membrane protein was solubilized by the addition of 0.5% (v/v) Triton X-100 for 5 min before the addition of the dye reagent concentrate.
Primary and Secondary Antibodies
Peptides representing the second extracellular loop (MIP-A, MIP-B, and MIP-C) or the carboxy terminus (MIP-F) of the deduced amino acid sequence of the M. crystallinum MIP were synthesized and coupled to BSA or keyhole limpet hemocyanin. Antibodies were generated by HTI-BioProducts (Ramona, CA). Anti-MIP-A antiserum was further purified by affinity columns. Two milligrams of peptide were conjugated at the N-terminal Cys to iodoacetyl groups of Sulfolink gel (Pierce Chemical, Rockford, IL), and the immobilized peptide was used to selectively purify anti-MIP-A peptide antibodies using an immobilization kit (ImmunoPure, Pierce Chemical). The purified antibody was dialyzed against Tris-buffered saline (TBS; 137 mm NaCl, 2.7 mm KCl, and 20 mm Tris/HCl, pH 7.4) and stored at −20°C.
Anti-MIP-A antibodies were used in a dilution of 1:250 for protein blot analyses and 1:10 for cytological immunolocalization experiments. Anti-MIP-B antiserum was purified by ammonium sulfate precipitation (35% [w/v]), dialyzed against TBS, and, after the addition of 0.02% (v/v) sodium azide, stored at 4°C until further use. Anti-MIP-B serum was used in a 1:250 dilution for protein blots and at 1:200 for immunolocalization. Antisera for the detection of MIP-C and MIP-F were used unpurified at dilutions of 1:500 for immunoblots and 1:250 and 1:1,000 for immunohistochemistry, respectively. Peptide antibodies against the vacuolar H+-translocating pyrophosphatase (V-PPase) from sugar beet and the P-type H+-translocating ATPase (P-ATPase) from Arabidopsis were kindly supplied by P.A. Rea and R. Serrano, respectively (Pardo and Serrano, 1989; Rea et al., 1992). Polyclonal antibodies against the E subunit of the vacuolar H+-translocating ATPase (V-ATPase) from barley were supplied by K.-J. Dietz (Dietz and Arbinger, 1996). Cy-5 fluorochrome-tagged secondary antibody was purchased from Jackson Immunoresearch Laboratories (West Grove, PA).
SDS-PAGE and Protein Immunoblotting
Protein was precipitated after dilution of the samples 50-fold in 1:1 (v/v) ethanol:acetone and incubation for 2 h at −30°C. Samples were then centrifuged at 13,000g for 20 min at 4°C using a rotor (model F2402, Beckman Instruments) in a tabletop centrifuge (model GS-15R, Beckman Instruments). Air-dried pellets were re-suspended with Laemmli (1970) sample buffer (2.5% [w/v] SDS final concentration), heated at 60°C for 2 min, and loaded onto 12.5% (w/v) linear acrylamide gels. After electrophoresis, the gels were stained with Coomassie Brilliant Blue R-250 (0.25% [w/v] in 50% [v/v] methanol/7% [v/v] acetic acid), destained in 10% methanol/10% acetic-acid (v/v) for 4 h, and either vacuum-dried at 80°C for 2 h or prepared for immunoblotting. Proteins were electrophoretically transferred onto nitrocellulose membranes (ECL, Amersham, Buckinghamshire, UK) as previously described (Barkla and Blumwald, 1991). Following transfer, membranes were blocked with TBS (100 mm Tris and 150 mm NaCl) containing 0.02% (w/v) sodium azide and 5% (w/v) fat-free powdered milk for 2 h at room temperature. Membranes were incubated for a minimum of 3 h at room temperature with the appropriate primary antibodies.
Immunolocalization and Confocal Laser Scanning Microscopy
Fixation, embedding, and immunolocalization of plant tissues was performed according to the method of Maliga et al. (1995). Plant tissues from different developmental stages were fixed in 4% (w/v) p-formaldehyde in 50 mm of 1,4-piperazinediethanesulfonic acid (PIPES) buffer (pH 6.8), dehydrated in a graded series of ethanol dilutions, infiltrated in xylene, and embedded in paraffin embedding medium (Paraplast Plus, Sigma, St. Louis). Serial tissue sections (8–10 μm) were mounted on microscope slides and treated in 0.1% (w/v) NaBH4 for 30 min to reduce autofluorescence. Prior to incubation with primary antibodies non-specific sites were blocked with 1% (w/v) fat-free powdered milk in TBS. The tissue sections were subsequently incubated for 1 h with either primary antibody or preimmune serum, followed by incubation in either fluorescent secondary goat anti-rabbit IgG coupled to Cy-5 antibody (1:200) or secondary goat anti-rabbit IgG coupled to peroxidase in blocking solution. Between incubations, tissues were washed for 30 min in TBS with several buffer changes.
The immunologically stained sections were mounted in 20% (w/v) polyvinylalcohol, 0.1% (w/v) phenylendiamine in TBS, and analyzed by confocal laser scanning microscopy (model MRC 1024, Bio-Rad, Cambridge, MA). Fluorescent images were collected and stored as full-frame digital images (768 × 512 pixels). MIP localization was analyzed by successively collecting separate digital images from identical tissue areas (identical optical focal planes) in the red (Ex 568 nm/Em 605 nm, autofluorescence) and the far red fluorescent range (Ex 647 nm/Em 680 nm, Cy-5 fluorescence/MIP localization), pseudocoloring the separate images (red, autofluorescence; green, MIP/Cy-5), and then merging the signals. Unstained autofluorescent tissue or cell sections are therefore shown as red/orange, fluorochrome-stained areas are green, while superimposed regions are yellow. Unstained tissue sections incubated with preimmune serum or secondary antibody alone showed no significant fluorescence in the far-red range for the calibrations of the confocal microscope.
Isolation and Characterization of Transcripts
Mip transcripts were isolated by a combination of reverse transcriptase-PCR amplification and cDNA library screening. The 5′ ends for the partial cDNA MipC (Yamada et al., 1995) was obtained using 5′-RACE amplification (Gibco-BRL, Cleveland) with sequence-specific 3′-oligonucleotide primers. Oligonucleotide sequences were as follows. Positions 539 to 522 were: 5′-CCTTTTATAACTCCATAG-3′; positions 509 to 483: 5′-GATGCCATTAGCCAATTAACCCAGAGG-3′; and positions 464 to 435: 5′-CCTTCACAAATTATGCAGAGCTCCTGAAGG-3′. PCR products and cDNAs were sequenced by the University of Arizona sequencing facility using fluorescence-labeled dye terminators. Full-length cDNAs were obtained from cDNA libraries of RNA from seedlings, juvenile plants, mature plants, flowers, and stressed and unstressed roots. Amplified PCR fragments or cDNA clones were cloned into pBluescript KS(−). For MipF, the following oligonucleotides were synthesized: (5′) (EcoRI) GGGAATTCGT(ACT) TT(TC) GCNGGNGA(GA) GGNTC and (3′) GGGATCC(TGA) TA(GA) TTNGCNCC(ATG) AC(TGA) AT(GA) T(GA) AA(BamHI) (n = A + G + C + T). PCR products were used to screen cDNA libraries and four clones, three of them full length, were sequenced. The sequences were identical. The longest clone contained a 51-nucleotide 5′-untranslated region and a 3′ end of 422 nucleotides. Deletion clones of cDNAs for labeling studies were generated and cDNAs were sequenced on both strands. Genetics Computer Group (Madison, WI) programs were used for sequence alignments.
ACKNOWLEDGMENTS
We thank Pat Adams for help with the manuscript, and Manabu Ishitani for initial work on the MipF sequence. We also thank Drs. Ramon Serrano (Valencia, Spain), Phil Rea (Philadelphia), and Karl-Josef Dietz (Bielefeld, Germany) for antibodies against V-ATPase, P-ATPase, and V-PPase.
Footnotes
This work was supported by the U.S. Department of Agriculture-National Research Initiative (Plant Responses to the Environment program), by the National Science Foundation International Program (U.S. and Mexico), by the Arizona Agricultural Experiment Station, and by private funds. B.J.B. and R.V.-E. were supported by Consejo Nacional de Ciencia y Tecnológia (no. 25750N) and Dirección General de Asuntas para el Personal Académico (no. IN232998). H.-H.K. and D.G. were supported by the Deutsche Forschungsgemeinschaft (Bonn, Germany).
LITERATURE CITED
- Abrami L, Capurro C, Ibarra C, Parisi M, Buhler JM, Ripoche P. Distribution of mRNA encoding the FA-CHIP water channel in amphibian tissues: effects of salt adaptation. J Membr Biol. 1995;143:199–205. doi: 10.1007/BF00233448. [DOI] [PubMed] [Google Scholar]
- Adams P, Nelson DE, Yamada S, Chmara W, Jensen RG, Bohnert HJ, Griffiths H. Growth and development of Mesembryanthemum crystallinum (Aizoaceae) New Phytol. 1998;138:171–190. doi: 10.1046/j.1469-8137.1998.00111.x. [DOI] [PubMed] [Google Scholar]
- Agre P, Bonhivers M, Borgnia MJ. The aquaporins, blueprints for cellular plumbing systems. J Biol Chem. 1998;273:14659–14662. doi: 10.1074/jbc.273.24.14659. [DOI] [PubMed] [Google Scholar]
- Barkla BJ, Blumwald E. Identification of a 170-kDa protein associated with the vacuolar Na+/H+-antiport of Beta vulgaris. Proc Natl Acad Sci USA. 1991;88:11177–11181. doi: 10.1073/pnas.88.24.11177. [DOI] [PMC free article] [PubMed] [Google Scholar]
- Barkla BJ, Vera-Estrella R, Kirch HH, Pantoja O, Bohnert HJ. Aquaporin localization: how valid are the TIP and PIP labels? Trends Plant Sci. 1999;4:86–88. doi: 10.1016/s1360-1385(99)01388-6. [DOI] [PubMed] [Google Scholar]
- Barkla BJ, Zingarelli L, Blumwald E, Smith JAC. Tonoplast Na+/H+ antiport activity and its energization by the vacuolar H+-ATPase in the halophytic plant Mesembryanthemum crystallinum L. Plant Physiol. 1995;109:549–556. doi: 10.1104/pp.109.2.549. [DOI] [PMC free article] [PubMed] [Google Scholar]
- Barrieu F, Thomas D, Marty-Mazars D, Charbonnier M, Marty F. Tonoplast intrinsic proteins from cauliflower: immunological analysis, cDNA cloning, and evidence for expression in meristematic tissues. Planta. 1998;204:335–344. doi: 10.1007/s004250050264. [DOI] [PubMed] [Google Scholar]
- Biela A, Grote K, Otto B, Hoth S, Hedrich R, Kaldenhoff R. The Nicotiana tabacum plasma membrane aquaporin NtAQP1 is mercury-insensitive and permeable for glycerol. Plant J. 1999;18:565–570. doi: 10.1046/j.1365-313x.1999.00474.x. [DOI] [PubMed] [Google Scholar]
- Bradford MM. A rapid and sensitive method for the quantitation of microgram quantities of protein utilizing the principle of protein-dye binding. Anal Biochem. 1976;72:248–254. doi: 10.1016/0003-2697(76)90527-3. [DOI] [PubMed] [Google Scholar]
- Chaumont F, Barrieu F, Herman EM, Chrispeels MJ. Characterization of a maize tonoplast aquaporin expressed in zones of cell division and elongation. Plant Physiol. 1998;117:1143–1152. doi: 10.1104/pp.117.4.1143. [DOI] [PMC free article] [PubMed] [Google Scholar]
- Chrispeels MJ, Crawford NM, Schroeder JI. Proteins for transport of water and mineral nutrients across the membranes of plant cells. Plant Cell. 1999;11:661–675. doi: 10.1105/tpc.11.4.661. [DOI] [PMC free article] [PubMed] [Google Scholar]
- Daniels MJ, Mirkov TE, Chrispeels MJ. The plasma membrane of Arabidopsis thaliana contains a mercury-insensitive aquaporin that is a homologue of the tonoplast water channel protein TIP. Plant Physiol. 1994;106:1325–1333. doi: 10.1104/pp.106.4.1325. [DOI] [PMC free article] [PubMed] [Google Scholar]
- Dietz K-J, Arbinger B. cDNA sequence and expression of subunit E of the vacuolar H+-ATPase in the inducible Crassulacean acid metabolism plant Mesembryanthemum crystallinum. Biochim Biophys Acta. 1996;1281:134–138. doi: 10.1016/0005-2736(96)00044-2. [DOI] [PubMed] [Google Scholar]
- Fukuhara T, Kirch HH, Bohnert HJ. Expression of Vp1 and water channel proteins during seed germination. Plant Cell Environ. 1999;22:417–424. [Google Scholar]
- Gerbeau P, Güçlü J, Ripoche P, Maurel C. Aquaporin Nt-TIPa can account for the high permeability of tobacco cell vacuolar membrane to small neutral solutes. Plant J. 1999;18:577–588. doi: 10.1046/j.1365-313x.1999.00481.x. [DOI] [PubMed] [Google Scholar]
- Guerrero FD, Jones JT, Mullet JE. Turgor-responsive gene transcription and RNA levels increase rapidly when pea shoots are wilted: sequence and expression of three inducible genes. Plant Mol Biol. 1990;15:11–26. doi: 10.1007/BF00017720. [DOI] [PubMed] [Google Scholar]
- Gustafson CE, Levine S, Katsura T, McLaughlin M, Aleixo MD, Tamarappoo BK, Verkman AS, Brown D. Vasopressin-regulated trafficking of a green fluorescent protein-aquaporin 2 chimera in LLC-PK1 cells. Histochem Cell Biol. 1998;110:377–386. doi: 10.1007/s004180050298. [DOI] [PubMed] [Google Scholar]
- Harris HW, Zeidel ML, Jo I, Hammond TG. Characterization of purified endosomes containing the antidiuretic hormone-sensitive water channel from rat renal papilla. J Biol Chem. 1994;269:11993–12000. [PubMed] [Google Scholar]
- Henzler T, Steudle E. Reversible closing of water channels in Chara internodes provides evidence for a composite transport model of the plasma membrane. J Exp Bot. 1995;46:199–209. [Google Scholar]
- Höfte H, Hubbard L, Reizer J, Ludevid D, Herman EM, Chrispeels MJ. Vegetative and seed-specific forms of tonoplast intrinsic protein in the vacuolar membrane of Arabidopsis thaliana. Plant Physiol. 1992;99:561–570. doi: 10.1104/pp.99.2.561. [DOI] [PMC free article] [PubMed] [Google Scholar]
- Johansson I, Karlsson M, Shukla VK, Chrispeels MJ, Larsson C, Kjellbom P. Water transport activity of the plasma membrane aquaporin PM28A is regulated by phosphorylation. Plant Cell. 1998;10:451–459. doi: 10.1105/tpc.10.3.451. [DOI] [PMC free article] [PubMed] [Google Scholar]
- Johnson KD, Höfte H, Chrispeels MJ. An intrinsic tonoplast protein of protein storage vacuoles in seeds is structurally related to a bacterial solute transporter (GlpF) Plant Cell. 1990;2:525–532. doi: 10.1105/tpc.2.6.525. [DOI] [PMC free article] [PubMed] [Google Scholar]
- Jones JT, Mullet JE. Developmental expression of a turgor-responsive gene that encodes an intrinsic membrane protein. Plant Mol Biol. 1995;28:983–996. doi: 10.1007/BF00032661. [DOI] [PubMed] [Google Scholar]
- Jung JS, Preston GM, Smith BL, Guggino AB, Agre P. Molecular structure of the water channel through aquaporin CHIP: the hourglass model. J Biol Chem. 1994;269:14648–14654. [PubMed] [Google Scholar]
- Kaldenhoff R, Grote K, Zhu J-J, Zimmermann U. Significance of plasmalemma aquaporins for water transport in Arabidopsis thaliana. Plant J. 1998;14:121–128. doi: 10.1046/j.1365-313x.1998.00111.x. [DOI] [PubMed] [Google Scholar]
- Kaldenhoff R, Kölling A, Meyers J, Karmann U, Ruppel G, Richter G. The blue light-responsive AthH2 gene of Arabidopsis thaliana is primarily expressed in expanding as well as differentiating cells and encodes a putative channel protein of the plasmalemma. Plant J. 1995;7:87–95. doi: 10.1046/j.1365-313x.1995.07010087.x. [DOI] [PubMed] [Google Scholar]
- Kammerloher W, Fischer U, Piechottka GP, Schõffner AR. Water channels in the plasma membrane cloned by immuno-selection from a mammalian expression system. Plant J. 1994;6:187–199. doi: 10.1046/j.1365-313x.1994.6020187.x. [DOI] [PubMed] [Google Scholar]
- Knepper MA, Inoue T. Regulation of aquaporin-2 water channel trafficking by vasopressin. Curr Opin Cell Biol. 1997;9:560–564. doi: 10.1016/s0955-0674(97)80034-8. [DOI] [PubMed] [Google Scholar]
- Laemmli UK. Cleavage of structural proteins during the assembly of the head of bacteriophage T4. Nature. 1970;227:680–685. doi: 10.1038/227680a0. [DOI] [PubMed] [Google Scholar]
- Maliga P, Klessig DF, Cashmore AR, Gruissem W, Varner JE. Methods in Plant Molecular Biology: A Labora-tory Course Manual. Cold Spring Harbor, NY: Cold Spring Harbor Laboratory Press; 1995. pp. 95–110. [Google Scholar]
- Maurel C. Aquaporins and water permeability of plant membranes. Annu Rev Plant Physiol Plant Mol Biol. 1997;48:399–430. doi: 10.1146/annurev.arplant.48.1.399. [DOI] [PubMed] [Google Scholar]
- Maurel C, Reizer J, Schroeder JI, Chrispeels MJ. The vacuolar membrane protein γ-TIP creates water specific channels in Xenopus oocytes. EMBO J. 1993;12:2241–2247. doi: 10.1002/j.1460-2075.1993.tb05877.x. [DOI] [PMC free article] [PubMed] [Google Scholar]
- Ostrem JA, Olson SW, Schmitt JM, Bohnert HJ. Salt stress increases the level of translatable mRNA for phosphoenolpyruvate carboxylase in Mesembryanthemum crystallinum. Plant Physiol. 1987;84:1270–1275. doi: 10.1104/pp.84.4.1270. [DOI] [PMC free article] [PubMed] [Google Scholar]
- Pardo JM, Serrano R. Structure of a plasma membrane H+-ATPase gene from the plant Arabidopsis thaliana. J Biol Chem. 1989;264:8557–8562. [PubMed] [Google Scholar]
- Rea PA, Britten CJ, Sarafian V. Common identity of substrate-binding subunit of vacuolar H+-translocating inorganic pyrophosphatase of plant cells. Plant Physiol. 1992;100:723–732. doi: 10.1104/pp.100.2.723. [DOI] [PMC free article] [PubMed] [Google Scholar]
- Reizer J, Reizer A, Saier MH., Jr The MIP family of integral membrane channel proteins: sequence comparisons, evolutionary relationships, reconstructed pathway of evolution, and proposed functional differentiation of the two repeated halves of the proteins. Crit Rev Biochem Mol Biol. 1993;28:235–257. doi: 10.3109/10409239309086796. [DOI] [PubMed] [Google Scholar]
- Robinson DG, Sieber H, Kammerloher W, Schaeffner AR. PIP1 aquaporins are concentrated in plasmalem-masomes of Arabidopsis mesophyll. Plant Physiol. 1996;111:645–649. doi: 10.1104/pp.111.2.645. [DOI] [PMC free article] [PubMed] [Google Scholar]
- Sarda X, Tousch D, Ferrare K, Legrand E, Dupuis JM, Casse-Delbart F, Lamaze T. Two TIP-like genes encoding aquaporins are expressed in sunflower guard cells. Plant J. 1997;12:1103–1111. doi: 10.1046/j.1365-313x.1997.12051103.x. [DOI] [PubMed] [Google Scholar]
- Sasaki S, Ishibashi K, Marumo F. Aquaporin-2 and -3: representatives of two subgroups of the aquaporin family colocalized in the kidney collecting duct. Annu Rev Physiol. 1998;60:199–220. doi: 10.1146/annurev.physiol.60.1.199. [DOI] [PubMed] [Google Scholar]
- Siner J, Paredes A, Hosselet C, Hammond T, Strange K, Harris HW. Cloning of an aquaporin homologue present in water channel containing endosomes of toad urinary bladder. Am J Physiol. 1996;270:C372–C381. doi: 10.1152/ajpcell.1996.270.1.C372. [DOI] [PubMed] [Google Scholar]
- Steudle E. Water transport across plant tissue: role of water channels. Biol Cell. 1997;89:259–273. [Google Scholar]
- Tyerman SD, Bohnert HJ, Maurel C, Steudle E, Smith JAC. Plant aquaporins: their molecular biology, biophysics, and significance for plant water relations. J Exp Bot. 1999;50:1055–1071. [Google Scholar]
- Valenti G, Procine G, Liebenhoff U, Frigeri A, Benedetti PA, Ahnert-Hilger G, Nurnberg B, Svelto M, Rosenthal W. A heterotrimeric G-protein of the Gi family is required for cAMP-triggered trafficking of aquaporin-2 in kidney epithelial cells. J Biol Chem. 1998;273:22627–22634. doi: 10.1074/jbc.273.35.22627. [DOI] [PubMed] [Google Scholar]
- Vera-Estrella R, Barkla BJ, Bohnert HJ, Pantoja O. Salt-stress in Mesembryanthemum crystallinum suspension cells activates adaptive mechanisms similar to those observed in the whole plant. Planta. 1999;207:426–435. doi: 10.1007/s004250050501. [DOI] [PubMed] [Google Scholar]
- Weig A, Deswarte C, Chrispeels MJ. The major intrinsic protein family of Arabidopsis has 23 members that form three distinct groups with functional aquaporins in each group. Plant Physiol. 1997;114:1347–1357. doi: 10.1104/pp.114.4.1347. [DOI] [PMC free article] [PubMed] [Google Scholar]
- Wells T. Vesicular osmometers, vasopressin secretion, and aquaporin-4: a new mechanism for osmoreception. Mol Cell Endocrinol. 1998;15:103–107. doi: 10.1016/s0303-7207(97)00219-0. [DOI] [PubMed] [Google Scholar]
- Yamada S, Katsuhara M, Kelly WB, Michalowski CB, Bohnert HJ. A family of transcripts encoding water channel proteins: tissue-specific expression in the common ice plant. Plant Cell. 1995;7:1129–1142. doi: 10.1105/tpc.7.8.1129. [DOI] [PMC free article] [PubMed] [Google Scholar]
- Yamada S, Nelson D, Ley E, Marquez S, Bohnert HJ. The expression of an Aquaporin promoter from Mesembryanthemum crystallinum in tobacco. Plant Cell Physiol. 1997;38:1326–1332. doi: 10.1093/oxfordjournals.pcp.a029125. [DOI] [PubMed] [Google Scholar]
- Yamaguchi-Shinozaki K, Koizumi M, Urao S, Shinozaki K. Molecular cloning and characterization of 9 cDNAs for genes that are responsive to desiccation in Arabidopsis thaliana: sequence analysis of one cDNA that encodes a putative transmembrane channel protein. Plant Cell Physiol. 1992;33:217–224. [Google Scholar]
- Yamamoto YT, Taylor CG, Acedo GN, Cheng C-L, Conk-ling MA. Characterization of cis-acting sequences regulating root-specific gene expression in tobacco. Plant Cell. 1991;3:371–382. doi: 10.1105/tpc.3.4.371. [DOI] [PMC free article] [PubMed] [Google Scholar]
- Zhang R, Skach W, Hasegawa H, van Hoek AN, Verkman AS. Cloning, functional analysis, and cell localization of a kidney proximal tubule water transporter homologous to CHIP28. J Cell Biol. 1993;120:359–369. doi: 10.1083/jcb.120.2.359. [DOI] [PMC free article] [PubMed] [Google Scholar]


