Abstract
Mammalian tissues are fuelled by circulating nutrients, including glucose, amino acids, and various intermediary metabolites. Under aerobic conditions, glucose is generally assumed to be burned fully by tissues via the tricarboxylic acid cycle (TCA cycle) to carbon dioxide. Alternatively, glucose can be catabolized anaerobically via glycolysis to lactate, which is itself also a potential nutrient for tissues1 and tumours2–5. The quantitative relevance of circulating lactate or other metabolic intermediates as fuels remains unclear. Here we systematically examine the fluxes of circulating metabolites in mice, and find that lactate can be a primary source of carbon for the TCA cycle and thus of energy. Intravenous infusions of 13C-labelled nutrients reveal that, on a molar basis, the circulatory turnover flux of lactate is the highest of all metabolites and exceeds that of glucose by 1.1-fold in fed mice and 2.5-fold in fasting mice; lactate is made primarily from glucose but also from other sources. In both fed and fasted mice, 13C-lactate extensively labels TCA cycle intermediates in all tissues. Quantitative analysis reveals that during the fasted state, the contribution of glucose to tissue TCA metabolism is primarily indirect (via circulating lactate) in all tissues except the brain. In genetically engineered lung and pancreatic cancer tumours in fasted mice, the contribution of circulating lactate to TCA cycle intermediates exceeds that of glucose, with glutamine making a larger contribution than lactate in pancreatic cancer. Thus, glycolysis and the TCA cycle are uncoupled at the level of lactate, which is a primary circulating TCA substrate in most tissues and tumours.
Mammals generate energy by catabolizing food into carbon dioxide (CO2). Glucose is generally assumed to be catabolized in cells via the concerted action of glycolysis and the TCA cycle. Cells and tissues can also share metabolic tasks by exchanging intermediary metabolites, such as lactate. Here we systematically investigate the significance of different circulating metabolic intermediates. The circulatory turnover flux (Fcirc) of a given metabolite refers to the rate at which tissues collectively consume the metabolite from the arterial circulation (Fc) and produce and excrete the metabolite into the venous circulation (Fp) (Fig. 1a), with these two rates being equal at steady state. We considered whether there is any fundamental limit on which metabolites can have high Fcirc (that is, can contribute substantially to inter-organ fluxes). For metabolite M, its consumption by the tissues cannot occur faster than the rate at which it is pumped from the heart:
| (1) |
Thus, only metabolites that are reasonably concentrated in blood can contribute substantially to inter-organ fluxes, with 39 metabolites in mice having a sufficient concentration (greater than 30 μM) to potentially have greater than 10% of the Fcirc of glucose6 (Extended Data Fig. 1).
Figure 1. Turnover fluxes of circulating metabolites in fasting mice.
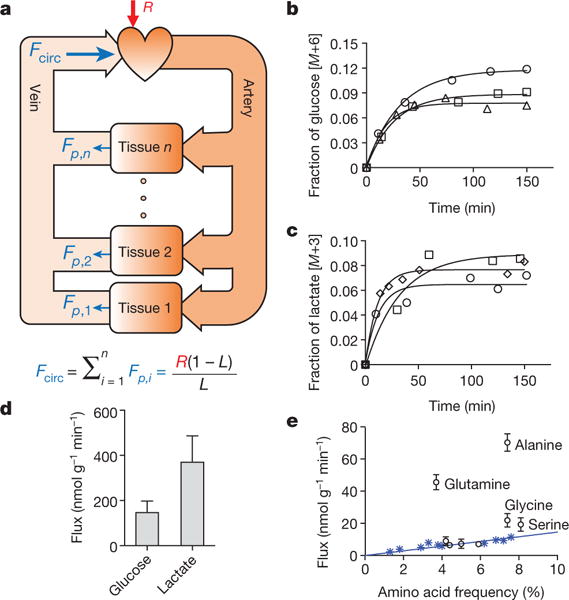
a, Illustration of circulatory turnover flux (Fcirc) and its determination by isotope tracing. b, c, Kinetics of isotopic labelling of circulating glucose and lactate. Data from different mice are indicated by different symbols and are fitted with a single exponential. d, Glucose (n = 22) and lactate (n = 24) turnover fluxes; data are mean ± s.d. e, Turnover fluxes of amino acids versus their average abundances in mammalian proteins. Blue asterisks, essential amino acids (EAAs). Data are mean ± s.d.; n = 5 for glutamine; n = 4 for essential amino acids except tyrosine; n = 3 for other amino acids). In all figures, n = number of mice.
We measured Fcirc for most of these species following an approach classically used to measure whole-body glucose production flux7: for each metabolite M, a trace amount of 13C-labelled M is infused into the circulation at a constant rate R until steady-state labelling is achieved (Fig. 1b,c), at which point the labelled fraction L is related to the turnover flux as:
| (2) |
For derivation, see Supplementary Note 1. Infusions were into the right jugular vein of freely moving C57BL/6 mice that spectrometry (LC-MS). Despite glucose being widely assumed to be the predominant circulating chad been fasted for 8 h (Extended Data Fig. 2a), with measurements of serum labelling via liquid chromatography–mass arbon source, on a molar basis, lactate showed a 2.5-fold higher circulatory turnover flux (1.25-fold higher on a per-carbon-atom basis) (Fig. 1d and Extended Data Fig. 2b–d). The other metabolites with substantial circulatory turnover fluxes (greater than 20% of glucose on a molar basis) were pyruvate, glycerol, acetate, 3-hydroxybutyrate, alanine and glutamine, each of which had a turnover flux less than 20% that of lactate (Table 1). Fcirc of free palmitate was 15% that of glucose on a molar basis, which equals 40% on a carbon atom basis. Essential amino acids, which are not biosynthesized and come from either diet or tissue protein degradation, exhibited lower Fcirc values, which were proportional to the abundances of the amino acids in protein (Fig. 1e). Like lactate, infused pyruvate was rapidly consumed by tissues, but its circulating concentration is too low to carry comparable flux (equation (1) and Supplementary Note 1).
Table 1.
Turnover fluxes for different circulating carbon metabolites
| Metabolite |
Fcirc (nmol g−1 min−1) |
Metabolite |
Fcirc (nmol g−1 min−1) |
|---|---|---|---|
| Lactate | 374.4 ± 112.4 | Arginine | 9.0 ± 2.6 |
| Glucose | 150.9 ± 46.7 | Tyrosine | 8.0 ±2.2 |
| Acetate | 72.7 ±17.5 | Threonine | 7.6 ±0.8 |
| Alanine | 70.2 ±5.4 | Proline | 7.3 ±2.9 |
| Pyruvate | 57.3 ± 14.2 | Isoleucine | 6.5 ±0.7 |
| Glycerol | 53.3 ±2.1 | Asparagine | 6.5 ±0.8 |
| Glutamine | 45.6 ±4.7 | Phenylalanine | 5.9 ±0.8 |
| 3-Hydroxybutyrate | 43.3 ±17.1 | 2-Oxoglutarate | 5.8 ±0.8 |
| Palmitic acid | 24.6 ±4.2 | Histidine | 5.0 ±0.4 |
| Glycine | 21.9 ± 4.2 | Methionine | 3.9 ±1.6 |
| Taurine | 19.4 ± 0.9 | Succinate | 3.1 ± 1.1 |
| Serine | 19.3 ± 4.2 | Creatine | 2.6 ±0.5 |
| Citrate | 16.2 ± 6.6 | Tryptophan | 2.3 ±0.3 |
| Leucine | 11.5 ±1.2 | Malate | 2.0 ±0.4 |
| Valine | 9.6 ±0.4 | Betaine | 1.6 ±0.2 |
| Lysine | 9.3 ± 1.8 |
n = 24 for lactate; n = 22 for glucose; n = 5 for glutamine; n = 4 for 3-hydroxybutyrate; n = 5 for palmitic acid; n = 4 for essential amino acids; n = 3 for others; mean ± s.d.
Previous Fcirc measurements have been largely restricted to glucose. However measurements have been reported for lactate and, consistent with our data, showed lactate turnover flux in excess of glucose turnover flux8–11. The physiological significance of these measurements has generally been dismissed, on the basis of the assumption that high lactate turnover flux merely reflects rapid lactate-pyruvate exchange. In actuality, such exchange does not change the 13C-labelling pattern of lactate and therefore does not contribute to turnover flux. Rather, the measured lactate circulatory turnover flux reflects the whole-body pyruvate production rate, multiplied by the fraction of tissue pyruvate that is excreted into the circulation as lactate (Supplementary Note 2 and Extended Data Fig. 3a). Thus, high lactate Fcirc reflects a high fraction of tissue pyruvate being excreted as lactate (and a high fraction of tissue pyruvate being derived from circulating lactate).
Another concern with regards to prior measurements is differences in arterial and venous lactate labelling12–16. We modelled the origin of such differences using partial differential equations to examine labelling across a tissue capillary bed (Supplementary Note 1 and Extended Data Fig. 3b). We find that the difference in arterial and venous labelling (La − Lv = ΔL) depends on the relative magnitude of Fcirc compared to metabolite flow:
| (3) |
In cases of substantial ΔL, Fcirc can be determined by equation (3) or by equation (2) with L the arterial metabolite labelling, with similar results (Supplementary Note 1). Thus, rather than precluding accurate determination of Fcirc, the arterial–venous difference in lactate labelling (Extended Data Fig. 3c) confirms the high circulatory turnover flux of lactate.
To test the hypothesis that lactate is a primary circulating carbon carrier, we examined tissue metabolite labelling after infusing uniformly 13C-labelled forms of the two primary carbon sources in cell culture (glucose and glutamine) or lactate. At steady state (Extended Data Fig. 4), the normalized labelling of a tissue metabolite from a circulating nutrient (Lmetabolite←nutrient) is defined as the fraction of 13C atoms in the metabolite, normalized to the fraction of 13C atoms in the circulating nutrient17–19. As expected, normalized labelling of glycolytic and pentose phosphate intermediates in tissue was greatest from the glucose infusion, whereas tissue lactate was labelled substantially from both glucose and lactate tracer infusions (Extended Data Fig. 5). In most tissues, normalized labelling of TCA intermediates, as represented by malate and succinate (Extended Data Fig. 6), was greatest from the lactate infusion (Fig. 2a–c).
Figure 2. In fasting mice, glucose labels TCA intermediates through circulating lactate in all tissues except the brain.
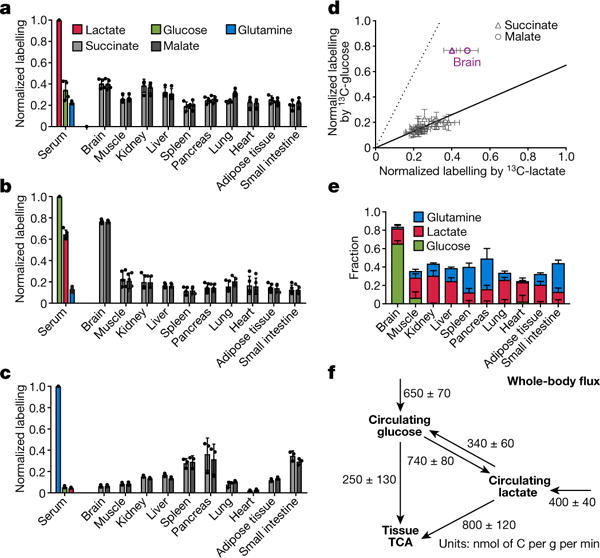
a–c, Normalized labelling of serum glucose, lactate, and glutamine, and of tissue TCA intermediates by infused 13C-lactate (a, n = 4), 13C-glucose (b, n = 5), and 13C-glutamine (c, n = 3). Data are mean ± s.d. d, Scatter plot of normalized labelling of TCA intermediates by infused 13C-glucose versus infused 13C-lactate (13C-glucose and 13C-lactate experiments performed separately). The solid line represents the expected labelling by 13C-glucose assuming that glucose feeds the TCA cycle solely through circulating lactate. The dashed line indicates the expected labelling by 13C-lactate assuming that lactate feeds the TCA cycle solely through circulating glucose. Data are from a and b, each data point is one TCA intermediate in one tissue, mean ± s.d., n = 4 for 13C-lactate infusion and n = 5 for 13C-glucose infusion. e, Direct circulating nutrient contributions to tissue TCA cycle (see Supplementary Note 3), data are mean ± s.e.m. f, Steady-state whole-body flux model of interconversion between circulating glucose and lactate and their feeding of TCA (see Supplementary Note 4), data are mean ± s.e.m.
Although normalized TCA labelling from lactate (LTCA←lac) generally exceeded that from glucose (LTCA←glc), the difference was, on average, modest (approximately 30% versus approximately 20%). A substantial fraction of serum lactate was, however, derived from glucose (red bar in Fig. 2b). We denote the fraction of 13C atoms in serum lactate following labelled glucose infusion, normalized to the fraction of 13C atoms in serum glucose, as Llac←glc. Measurement of LTCA←lac and Llac←glc allows us to determine quantitatively how much of the TCA labelling from labelled glucose infusion actually arises through labelled circulating lactate (LTCA←lac·Llac←glc). This amount is shown as the solid line in Fig. 2d. Within the margins of error, TCA labelling from glucose is fully accounted for by labelling through circulating lactate in every tissue exept for the brain.
Analogously, labelled lactate infusion contributes to TCA labelling through labelled circulating glucose produced by gluconeogenesis (LTCA←glc·Lglc←lac, dashed line in Fig. 2d). To quantitatively delineate the direct flux contributions to the TCA cycle by circulating glucose, lactate, and glutamine, we developed a linear algebra model to compute the direct TCA substrate usage of individual tissues (Fig. 2e and Supplementary Note 3). This analysis confirmed that, except in the brain, direct glucose flux to the TCA cycle is close to zero in fasted mice. Glutamine and lactate together account for about half of TCA cycle carbon. It is likely that most of the remainder comes from a combination of other amino acids and fat. Thus, in the fasted state, glucose feeds the TCA cycle mainly via circulating lactate in all tissues but the brain.
At the whole-body level, the circulatory turnover fluxes of glucose and lactate and their overall interconversion in body tissue can be quantitatively accounted for by a steady-state flux balance model (Supplementary Note 4), with fluxes determined solely on the basis of labelling of circulating glucose and lactate. In fasting mice, modelling revealed that the majority of glucose enters the TCA via circulating lactate (Fig. 2f). Similar relative contributions of glucose and lactate were also observed in anaesthetized mice (Extended Data Fig. 7).
We next examined fluxes of glucose and lactate in fed mice, where insulin signalling could increase tissue glucose metabolism. Indeed, Fcirc for glucose was 3.1-fold higher than in fasted mice. This was accompanied by a small increase in Fcirc for lactate, which was about 1.1-fold of Fcirc for glucose on a molar basis (55% on a per-carbon-atom basis) (Fig. 3a). TCA labelling from glucose also increased (Extended Data Fig. 8), with glucose and lactate making a roughly equal direct contribution to the muscle TCA cycle. In other organs, even in the fed state, glucose contributes to the TCA cycle mostly through circulating lactate (Fig. 3b, c). Quantitative whole-body modelling showed that, in the fed state, about 40% of glucose feeds the TCA cycle through circulating lactate (Fig. 3d and Supplementary Note 4). Further work is required to assess other states, such as exercise, and to identify the tissue compartments responsible for glucose-to-lactate flux.
Figure 3. In fed mice, in all tissues except brain and muscle, glucose labels TCA intermediates mostly through circulating lactate.
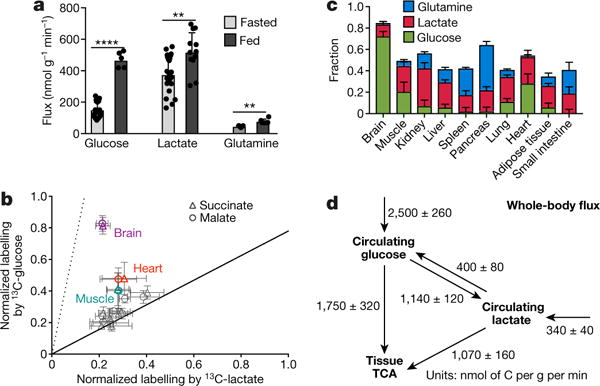
a, Turnover fluxes of glucose, lactate, and glutamine in fed and fasted mice (fed state: n = 5 for glucose, n = 12 for lactate, and n = 6 for glutamine; fasting state: n = 22 for glucose, n = 24 for lactate, and n = 5 for glutamine). Data are mean ± s.d., ****P < 0.0001; **P < 0.002 by t-test. b, Normalized labelling of TCA intermediates by 13C-glucose versus 13C-lactate, as in Fig. 2d, in fed mice. Data are from Extended Data Fig. 8. c, Direct circulating nutrient contributions to the tissue TCA cycle in fed mice; data are mean ± s.e.m. d, Steady-state whole-body flux model, as in Fig. 2f, in fed mice; data are mean ± s.e.m.
Rapid glucose catabolism to lactate was the first molecular phenotype assigned to cancer20,21. Tumours are often thought of as having an isolated metabolic microenvironment owing to poor perfusion, in which local exchange of nutrients (for example, between cancer cells and stromal cells) predominates over nutrient exchange with the circulation. We measured TCA substrate contributions in three genetically engineered mouse models (GEMMs). Notably, in all three cases, the contribution of circulating lactate to tumour TCA intermediates exceeded that of glucose by about twofold (Fig. 4a–c), with quantitative analysis consistent with glucose contributing to the tumour TCA cycle only through circulating lactate (Extended Data Fig. 9). Thus, the GEMM tumours that we studied are thoroughly perfused by lactate. This does not rule out the potential for some sections within human tumours to be less well perfused5 or for an important subset of tumour cells to be isolated within a poorly perfused metabolic niche. Note that in normal lung tissue and lung cancer, the largest TCA contribution was from lactate, whereas in the pancreas and pancreatic cancer, glutamine contributed more (Figs 2e and 4d), consistent with tumours mirroring the substrate preferences of their tissues of origin22,23.
Figure 4. Circulating lactate is a primary TCA substrate in tumours.
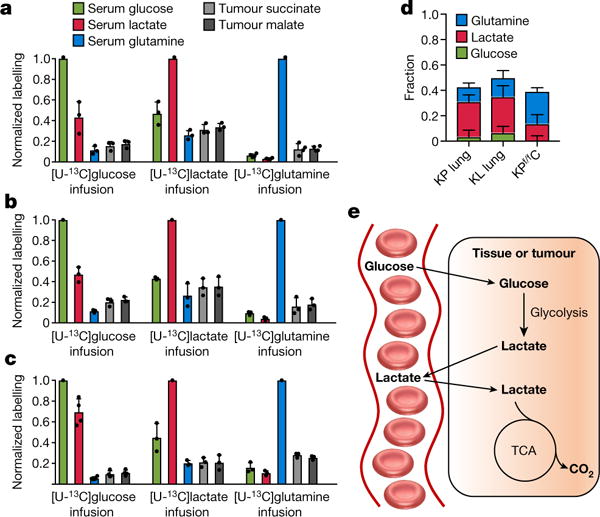
a–c,Normalized labelling of serum glucose, lactate, and glutamine and of tumour TCA intermediates by infused 13C-glucose, 13C-lactate, and 13C-glutamine in three GEMM tumours in fasted mice. a, KrasLSL-G12D/+ Trp53−/− (KP) lung cancer (n = 3 for glucose and lactate and n = 4 for glutamine infusion). b, KrasG12D/+Stk11−/− lung cancer (n = 3). Stk11 is also known as Lkb1 and the mouse model is called KL lung cancer. c, KrasLSL-G12D/+Trp53−/−Ptf1aCRE/+ (KPf/fC) pancreas cancer (n = 3 for glucose and n = 4 for lactate and glutamine). Data are mean ± s.d. d, Direct circulating nutrient contributions to tumour TCA cycle, data are mean ± s.e.m. e, Schematic representation, glucose feeds the TCA cycle via circulating lactate.
It is useful to differentiate between the above conclusions that arise directly from experimental data and those that are inferred on the basis of quantitative modelling, which omits certain biological complexity, such as tissue heterogeneity. The experimental data demonstrate that circulating lactate is a major source of TCA intermediates. The quantitative modelling leads to the additional conclusion that, in most tissues and GEMM tumours, the contribution of glucose to the TCA cycle is mostly through circulating lactate.
The metabolic role of lactate is well recognized, including as a fuel for tissues24 and tumours2–5,25. In the classical Cori cycle, muscle produces lactate which is then taken up by the liver for gluconeogenesis. Previous work has highlighted the potential for lactate to shuttle carbon both between and within tissues26–29. We find that such shuttling underlies the majority of circulating lactate turnover, with glucose feeding TCA metabolism mainly through circulating lactate (Fig. 4e). This picture requires high lactate dehydrogenase (LDH) activity and rapid lactate transport across the plasma membrane. Mammals encode two ubiquitously expressed LDH isozymes (LDHA and LDHB), as well as four monocarboxylate transporters (MCT1–MCT4). While the different isozymes show some kinetic differences, the direction of net flux is determined by thermodynamics. Genetic manipulation of these enzymes and transporters will be important to establish the biochemical basis of the phenomena reported here.
Among the many metabolic intermediates, why does lactate carry high flux? Lactate is redox-balanced with glucose. The rapid exchange of both tissue lactate and pyruvate with the circulation may help to equate cytosolic NAD+/NADH ratios across tissues, allowing the whole body to buffer NAD(H) disturbances in any given location30. Nearly complete lactate sharing between tissues effectively decouples glycolysis and the TCA cycle in individual tissues, allowing independent tissue-specific regulation of both processes. Because almost all ATP is made in the TCA cycle, each tissue can acquire energy from the largest dietary calorie constituent (carbohydrate) without needing to carry out glycolysis. In turn, glycolytic activity can be modulated to support cell proliferation, NADPH production by the pentose phosphate pathway, brain activity, and systemic glucose homeostasis21. In essence, by having glucose feed the TCA cycle via circulating lactate, the housekeeping function of ATP production is decoupled from glucose catabolism. In turn, glucose metabolism is regulated to serve more advanced objectives of the organism.
METHODS
Data reporting
No statistical methods were used to predetermine sample size. The experiments were not randomized.
Intravenous infusion of wild-type C57BL/6 mice
Animal studies followed protocols approved by the Princeton University Institutional Animal Care and Use Committee. In vivo infusions were performed on 12–14-week-old C57BL/6 mice pre-catheterized in the right jugular vein (Charles River Laboratories). Mice were randomly chosen for infusions of different tracers. No blinding was performed. A minimum of three mice was used for each tracer. To collect arterial blood samples, we used mice pre-catheterized in both the right jugular vein and left carotid artery (Charles River Laboratories), infusing through the venous catheter and drawing blood from the arterial catheter. Venous samples were taken from tail bleeds. The mice were on a normal light cycle (8:00–20:00). On the day of the infusion experiment, mice were transferred to new cages without food around 8:00 (beginning of their sleep cycle) and infused for 2.5 h starting at around 14:00. To analyse the fed state, the mice were maintained without food until around 19:00, at which time chow was placed back in the cages and the 2.5 h infusion initiated. The mouse infusion setup (Instech Laboratories) included a tether and swivel system so that the animal had free movement in the cage. Water-soluble isotope-labelled metabolites (Cambridge Isotope Laboratories) were prepared as solutions in sterile normal saline and infused via the catheter at a constant rate for 2.5 h (unless otherwise indicated). To make 13C-palmitate solution, [U-13C]sodium palmitate was complexed with bovine serum albumin in a 2:1 molar ratio31. Detailed infusion parameters are listed in Supplementary Table 1. Blood samples (~20 μl) were placed on ice in the absence of anticoagulant, and centrifuged at 4 °C to isolate serum. At the end of the infusion, the mouse was euthanized by cervical dislocation and tissues were quickly dissected and snap frozen in liquid nitrogen with pre-cooled Wollenberger clamp32. Serum and tissue samples were kept at −80 °C until LC–MS or GC–MS analysis.
Intravenous infusion of genetically engineered mouse models
Animal studies with the lung cancer GEMMs followed protocols approved by the Rutgers University Institutional Animal Care and Use Committee. KrasLSL-G12D/+Trp53flox/flox (KP) and KrasLSL-G12D/+ Stk11flox/flox (Stk11 is also known as Lkb1 and the mouse model is referred to as the KL lung cancer model) mice were intranasally infected with recombinant, replication-deficient adenovirus expressing Cre recombinase (University of Iowa Adenoviral Core) at 4 × 10⁷ plaque-forming units per mouse at 6–8 weeks of age. At 12 weeks post-infection, catheters were surgically implanted into the right jugular vein of KP and KL GEMMs and [U-13C]glucose (0.2 M, 0.1 μl g−1 min−1), [U-13C]glutamine (0.1 M, 0.1 μl g−1 min−1), or [U-13C] sodium lactate (5% w/w, 0.1 μl g−1 min−1) was infused into 8-h fasted mice for 2.5 h. Blood samples were collected from the tail vein and facial vein for measurement of serum enrichment of isotopic tracers. Mice were euthanized by cervical dislocation and tumours were quickly snap frozen in liquid nitrogen using a pre-cooled Wollenberger clamp. Throughout the experiments, mice were examined for evidence of distress due to lung tumour progression (for example, difficulty breathing, difficulty moving, significant weight loss, or moribund status) every day to ensure the health and well-being of the animal. Any animals exhibiting signs of distress would have been euthanized. At the time of in vivo infusion, none of the mice showed signs of distress.
Animal studies with the pancreatic cancer GEMM followed protocols approved by the University of California at San Diego Institutional Animal Care and Use Committee. KrasLSL-G12D/+Trp53flox/floxPtf1aCRE/+ (KPf/fC) mice were used. While Kras mutation alone leads to PanIN formation33, when combined with deletion of Trp53 it drives progression to adenocarcinoma34. At ~10 weeks old, catheters were surgically implanted into the right jugular vein of KPf/fC mice and [U-13C]glucose (0.2 M, 0.1 μl g−1 min−1), [U-13C]glutamine (0.1 M, 0.1 μl g−1 min−1), or [U-13C] sodium lactate (5% w/w, 0.1 μl g−1 min−1) was infused into 8-h fasted mice for 2.5 h. Blood samples were collected from the tail vein for measurement of serum enrichment of isotopic tracers. Mice were euthanized by cervical dislocation, and tumours were quickly snap frozen in liquid nitrogen using a pre-cooled Wollenberger clamp. Throughout the experiments, tumour progression was monitored according to protocols approved by the University of California San Diego Institutional Animal Care and Use Committee: weekly (for no visible, palpable, clinical, or behavioural signs of tumour burden), twice weekly (for visible or palpable tumours; changes in appearance or behaviour), and/or daily (for any signs of morbidity or mortality). It is important to note that with our pancreatic cancer model, in most instances, the mice show no visible signs of disease—no palpable tumour, no lethargy, no hunching, no weight loss, although we monitored carefully for these signs of distress.
Metabolite measurement
Metabolites were extracted from serum samples (thawed on ice) by adding 65 μl 80:20 methanol:water solution at −80 °C to 5 μl of serum sample, followed by vortexing for 10 s, incubation at 4 °C for 10 min, and centrifugation at 4 °C and 16,000g· for 10 min. To extract metabolites from tissue samples, frozen tissue samples were first weighed (~20 mg each sample) and ground using a Cryomill (Retsch). The resulting powder was then mixed with −20 °C 40:40:20 methanol:acetonitrile:water solution, followed by vortexing for 10 s, incubation at 4 °C for 10 min, and centrifugation at 4 °C and 16,000g for 10 min. The volume of the extraction solution (in μl) was 40 × the weight of tissue (in mg). The supernatant was transferred to LC–MS autosampler vials for analysis.
Serum and tissue extracts were analysed using LC–MS. In brief, a quadrupoleorbitrap mass spectrometer (Q Exactive Plus, Thermo Fisher Scientific) operating in negative ion mode was coupled to hydrophilic interaction chromatography via electrospray ionization and used to scan from m/z 73 to 1,000 at 1 Hz and 140,000 resolution. LC separation was achieved on a XBridge BEH Amide column (2.1 mm × 150 mm, 2.5 μm particle size, 130 Å pore size; Waters) using a gradient of solvent A (20 mM ammonium acetate + 20mM ammonium hydroxide in 95:5 water:acetonitrile, pH 9.45) and solvent B (acetonitrile). Flow rate was 150 μl min−1. The gradient was: 0 min, 85% B; 2 min, 85% B; 3 min, 80% B; 5 min, 80% B; 6 min, 75% B; 7 min, 75% B; 8 min, 70% B; 9 min, 70% B; 10 min, 50% B; 12 min, 50% B; 13 min, 25% B; 16 min, 25% B; 18 min, 0% B; 23 min, 0% B; 24 min, 85% B; 30 min, 85% B. Data were analysed using the MAVEN software35. Isotope labelling was corrected for natural abundances of 13C, 2H, and 15N. Circulating glycerol labelling was determined by first converting serum glycerol to glycerol-3-phosphate using glycerol kinase and then measuring the labelling of glycerol-3-phosphate with LC–MS.
For acetate, circulating metabolite labelling was determined by GC–MS using a 7890A GC system coupled to a 5975 MSD mass spectrometer (Agilent) after derivatization with 2,3,4,5,6-pentafluorobenzyl bromide as described36. GC separation was achieved using an Agilent J&W 122-7033 column (30 m × 0.25 mm × 0.5 μm). The GC temperature program was: 0 min, 35 °C; 6 min, 35 °C; 12 min, 220 °C; 17 min, 220 °C, followed by returning to 35 °C for the next injection. Other GC parameters were: injection volume 1 μl; He as carrier gas at a flow rate of 1.2 ml min−1; inlet temperature 250 °C; transfer line temperature 280 °C. Mass spectrometry detection was in electron impact ionization mode, with SIM scans of m/z 240.3 and 242.3 for unlabelled and 13C2-acetate, respectively.
Free fatty acids in serum samples (thawed on ice) were extracted by adding 200 μl ethyl acetate at room temperature to 10 μl serum samples, followed by vortexing for 10 s, incubation at 4 °C for 10 min, and centrifugation at 16,000g for 10 min. The top layer of approximately 190 μl was transferred to a new glass vial before being dried under nitrogen gas flow. The dried extract was dissolved in 100 μl 1:1 isopopanol: methanol before being loaded onto the LC–MS. MS analysis was conducted on an Exactive orbitrap mass spectrometer (Thermo Fisher Scientific) scanning at 1 Hz and 100,000 resolution operating in negative ion mode. LC separation was on reversed-phase ion-pairing chromatography on a Luna C8 column (150 × 2.0 mm, 3 μm particle size, 100 Å pore size; Phenomenex) with a gradient of solvent A (10 mM tributylamine + 15 mM acetic acid in 97:3 water:methanol, pH 4.5) and solvent B (methanol). Flow rate was 250 μl min−1. The gradient was: 0 min, 80% B; 10 min, 90% B; 11 min, 99% B; 25 min, 99% B; 26 min, 80% B; 30 min, 80% B.
Data availability
All data are available from the authors upon reasonable request. Source Data for Figs 1b–e, 2a–d, 3a–b and 4a–c and Extended Data Figs 2b–d, 3c, 4a–b, 5a–b, 7a–b, 8a–c and 9a–c are provided with the online version of the paper.
Extended Data
Extended Data Figure 1. Abundant metabolites in mouse plasma.
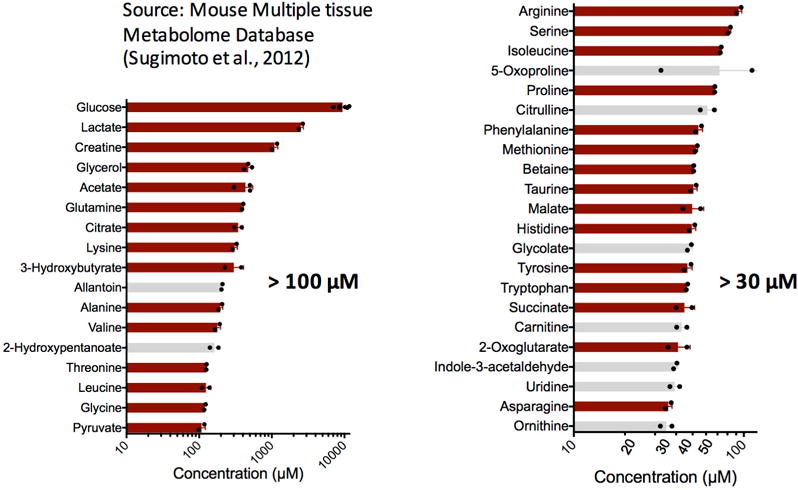
Metabolites (n = 39) with reported concentration greater than 30 μΜ in mouse plasma. Left bar graph shows those >100 μM (n = 17) and right bar graph those between 30 μM and 100 μM (n = 22). Most of the data are from the Mouse Multiple Tissue Metabolome Database (http://mmdb.iab.keio.ac.jp) (n = 2 mice), except for glucose (n = 6 mice), acetate (n = 3 mice), and glycerol (n = 3 mice), whose concentrations were determined in this study. The metabolites shown with red bars (n = 30) are those whose turnover fluxes have been determined (Table 1). Values are mean ± s.d. The concentration cut off of 30 μM was calculated using equation (1) where we used a cardiac output of 0.5 ml g−1 min−1 (see Supplementary Note 1 for references) and a turnover flux equating to 10% of glucose Fcirc.
Extended Data Figure 2. Determination of turnover flux with isotopic tracing.
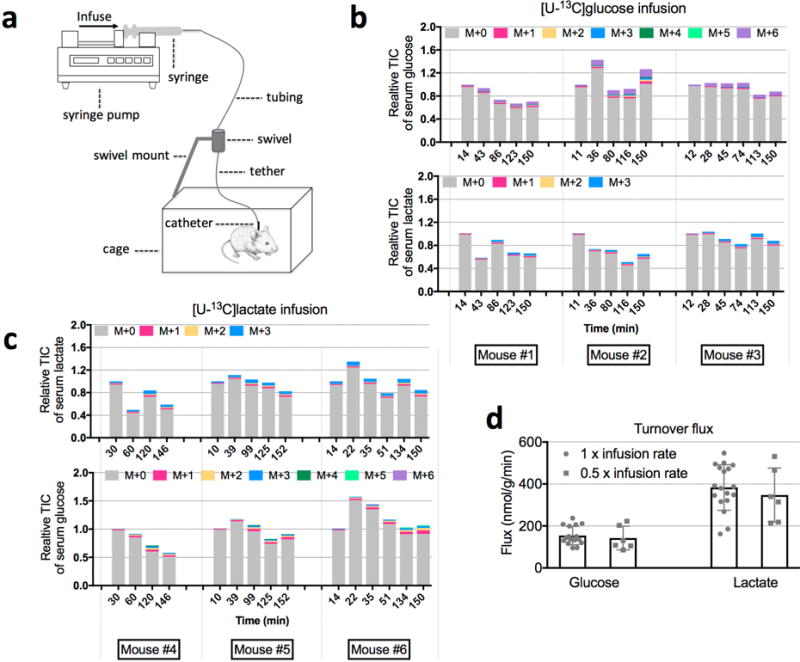
a, Illustration of the mouse infusion experimental setup. b, Relative total ion counts (TICs) of serum glucose and lactate during 13C-glucose infusion (individual mouse data are shown for three mice for each condition). c, Relative TICs of serum glucose and lactate during 13C-lactate infusion. d, Glucose (n = 16 for 1 × and n = 6 for 0.5 ×; P = 0.61) and lactate (n = 18 for 1 × and n = 6 for 0.5 ×; P = 0.50) turnover fluxes determined using two different infusion rates (mean ± s.d.). P values were determined by a two-tailed unpaired Student’s t-test. The 1 × infusion rates are listed in Supplementary Table 1.
Extended Data Figure 3. Measurement of lactate turnover flux.
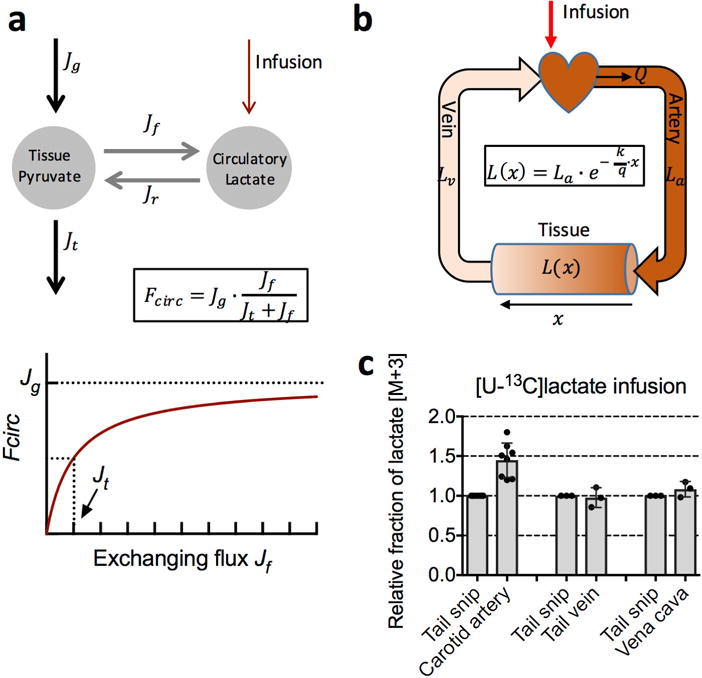
a, The dependence of lactate turnover flux (Fcirc) on the exchanging flux (forward (Jf) and reverse (Jr)) between circulating lactate and tissue pyruvate. Rapid exchanging flux does not lead to infinitely fast lactate turnover flux. Instead, it leads to a lactate turnover flux approaching the net production rate of pyruvate (Jg), as illustrated in lower panel. Jt is the pyruvate flux going to the TCA cycle. See Supplementary Note 2 for derivation. b, Spatial dependence of tracer enrichment. Labelling (L(x)) decreases in an exponential manner across a tissue capillary bed (shown schematically in the shading of the cylinder representing tissue) with the extent of arteriovenous difference in tracer labelling depending on the metabolic transformation rate (k) relative to the volumetric blood flow rate (q = Q/V; V is tissue volume) as shown in the equation. La and Lv are labelled fraction in the artery and the vein, respectively. See Supplementary Note 1. c, Lactate labelled fraction in arterial (carotid artery; n = 8 mice, mean ± s.d.) and venous (tail vein and vena cava; n = 3 mice, mean ± s.d.) serum samples, and in tail snip serum sample (n = 3 mice, mean ± s.d.). For comparison of tail snip to vena cava only, samples were collected under anaesthesia to allow access to the inferior vena cava. The difference in lactate labelling between the carotid artery and tail snip can be used to calculate lactate Fcirc using equation (3). With Q = 0.53 ± 0.11 ml min−1 g−1 and C = 2.5 ± 0.2 mM, together with , we get lactate Fcirc as 398 ± 88 nmol min−1 g−1 in the fasted state, which is comparable to the value of 374 ± 112 nmol min−1 g−1 obtained with equation (2).
See Supplementary Note 1 for details.
Extended Data Figure 4. Isotopic labelling of tissue TCA intermediates reaches steady state after 2.5-h infusion of 13C-glucose.
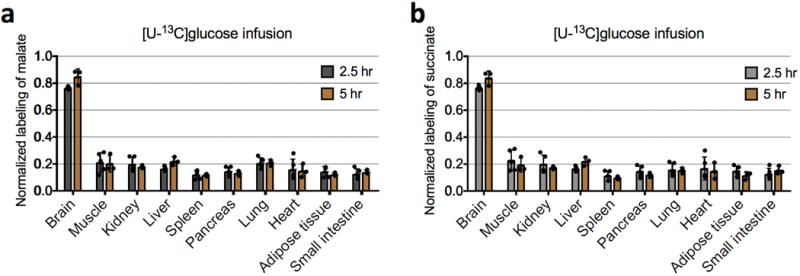
a, Comparison of normalized labelling of tissue malate after 2.5 h (n = 5 mice; mean ± s.d.) and after 5 h of [U-13C]glucose infusion (n = 3 mice; mean ± s.d.). P values were determined by an unpaired Student’s t-test, corrected for multiple comparisons using the Holm–Sidak method. Normalized labelling is the fraction of 13C atoms in a metabolite divided by the fraction of 13C atoms in serum glucose. None of the differences are significant (P > 0.14 for the brain and liver, and P > 0.98 for other tissues). b, Comparison of normalized labelling of tissue succinate after 2.5 h (n = 5 mice; mean ± s.d.) and after 5 h of [U-13C]glucose infusion (n = 3 mice; mean ± s.d.). None of the differences are significant (P > 0.18 for the brain and liver, and P > 0.85 for other tissues).
Extended Data Figure 5. Isotope labelling of central carbon metabolites by 13C-glucose and 13C-lactate.
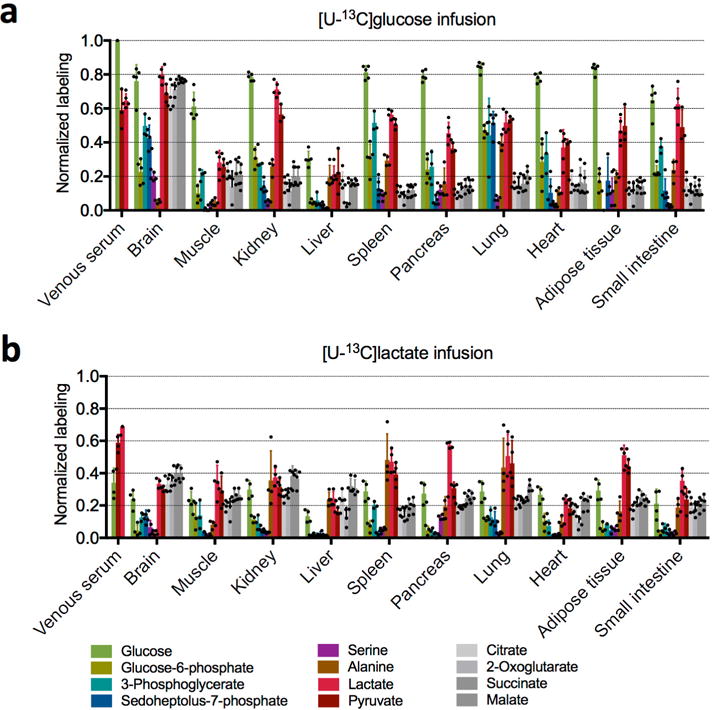
a, Normalized labelling by 13C-glucose in fasting mice (n = 3 for pyruvate, 2-oxoglutarate, and 3-phosphoglycerate, n = 4 for alanine, and n = 5 for all other metabolites; mean ± s.d.). b, Normalized labelling by 13C-lactate in fasting mice (n = 3 for 3-phosphoglycerate and n = 4 for all other metabolites; mean ± s.d.). n indicates the number of mice. For the lactate tracer studies, venous serum and tissue labelling are normalized to the arterial serum lactate labelling. Note that citrate, malate and succinate in tissues turn over sufficiently slowly that labelling is robust to the small (<90 s) delay between euthanizing the mouse and tissue harvesting. This delay may, however, result in erroneous measurements for tissue lactate, pyruvate and glycolytic intermediates. Analyses in the main text are limited to the better validated measurements of serum metabolites and tissue TCA intermediates. With this caveat in mind, it is nevertheless intriguing that lactate labelling varies markedly across tissues. After labelled glucose infusion, lactate labelling is highest in the brain, consistent with its use of glucose as a major substrate. In the kidneys lactate is strongly labelled after glucose infusion, even though TCA intermediates are more labelled after lactate infusion. A potential explanation involves tissue heterogeneity; for example, the presence both of glycolytic cells that make lactate from circulating glucose and of oxidative cells that make TCA intermediates from circulating lactate. In other tissues, such as liver, tissue lactate labelling is far below circulating lactate and very similar to TCA labelling; this may reflect mixing of carbon between lactate and TCA intermediates via gluconeogenesis or pyruvate cycling. Another factor diluting tissue lactate labelling is that, as blood passes through tissue, owing to the rapid exchange between tissue and circulating lactate, the circulating lactate loses its labelling, as is evident from the lactate arteriovenous labelling difference.
Extended Data Figure 6. Concentrations of succinate, malate, and citrate in mouse plasma and tissues.
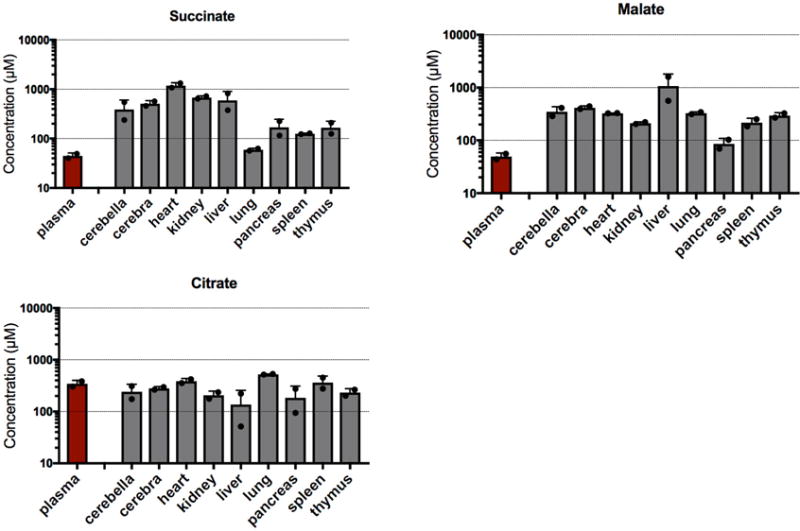
Unlike citrate, succinate and malate have substantially higher concentrations in tissues than in the bloodstream, thus making them a suitable readout for the tissue TCA cycle. Data are from the Mouse Multiple Tissue Metabolome Database (http://mmdb.iab.keio.ac.jp). Values are mean ± s.d. (n = 2 mice). Note that the y-axis is a logarithmic scale.
Extended Data Figure 7. Glucose feeds the TCA cycle via circulating lactate in anaesthetized mice.

a, Turnover fluxes of glucose (n = 4 mice, mean ± s.d.) and lactate (n = 3 mice, mean ± s.d.) in anaesthetized mice. b, Normalized labelling of serum glucose, lactate, and glutamine in anaesthetized mice with 13C-glucose infusion (n = 4 mice; mean ± s.d.) and 13C-lactate infusion (n = 3 mice; mean ± s.d.). c, Steady-state whole-body flux model summarizing glucose and lactate interconversion and their feeding to the TCA (see Supplementary Note 4). Values are mean ± s.e.m.
Extended Data Figure 8. Normalized labelling of serum glutamine, glucose, and lactate, and of tissue TCA intermediates in fed mice.
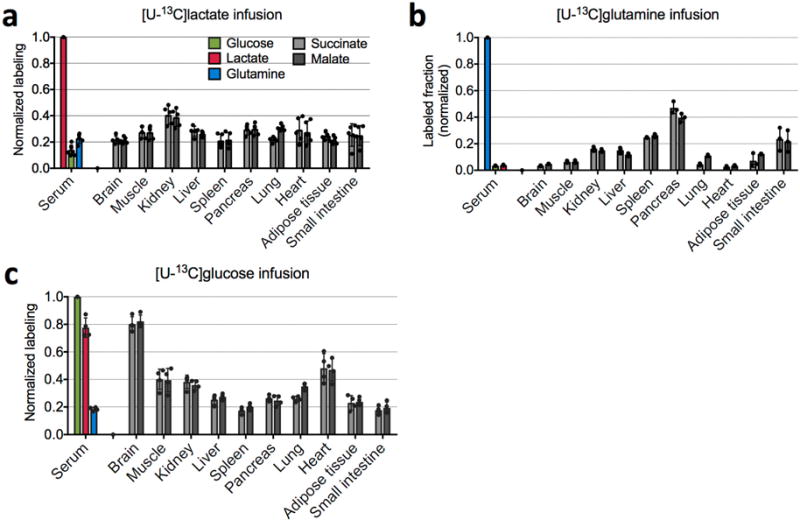
a, 13C-lactate infusion (n = 5 mice). b 13C-glutamine infusion (n = 3 mice). c, 13C-glucose infusion (n = 4 mice). Bars are mean ± s.d.
Extended Data Figure 9. Scatter plots of normalized labelling of TCA intermediates in the three types of tumours by 13C-glucose versus that by 13C-lactate.

a, KrasLSL-G12D/+Trp53−/− (KP) non-small cell lung cancer (n = 3 for 13C-glucose and 13C-lactate infusions, and n = 4 for 13C-glutamine infusion). b, KrasLSL-G12D/+ Stk11−/− (KL) lung cancer (n = 3 mice for infusion of each tracer). c, KrasLSL-G12D/+Trp53−/−Ptf1aCRE/+ (KPf/fC) pancreatic ductal adenocarcinoma (n = 4 for 13C-glucose infusion, n = 3 for 13C-lactate and 13C-glutamine infusions). Values are mean ± s.d. Data are from Fig. 4a–c. The solid line represents the expected labelling by 13C-glucose assuming that glucose feeds the TCA cycle solely through circulating lactate. The dashed line indicates the expected labelling by 13C-lactate, assuming that lactate feeds the TCA cycle solely through circulating glucose.
Supplementary Material
Acknowledgments
We thank C. Wright for providing the Ptf1a-cre mice; M. Sander for help and advice; and the members of the Rabinowitz laboratory and J. Baur, Z. Arany, and M. Lazar for scientific discussions. This work was supported by NIH grants 1DP1DK113643, R01 CA163591, R01 CA130893, K22 CA190521, R01 CA186043, R35 CA197699, R50 CA211437, P30 CA072720 (Metabolomics Shared Resource, Rutgers Cancer Institute of New Jersey), and 5P30 DK019525. In addition, it was supported by a Stand Up To Cancer-Cancer Research UK–Lustgarten Foundation Pancreatic Cancer Dream Team Research Grant (grant number: SU2C-AACR-DT-20-16). S.H. is a Merck Fellow of the Life Sciences Research Foundation. C.J. is a postdoctoral fellow of the American Diabetes Association.
Footnotes
Online Content Methods, along with any additional Extended Data display items and Source Data, are available in the online version of the paper; references unique to these sections appear only in the online paper.
Supplementary Information is available in the online version of the paper.
Author Contributions
S.H., R.J.M., and J.D.R. came up with the general approach. S.H., J.M.G., R.J.M., and C.J. designed and performed the wild-type mouse isotope tracing studies. J.M.G., L.A.E., and TR. designed and performed the pancreatic cancer GEMM studies. X.T, L.Z., J.Y.G., and E.W. designed and performed the lung cancer GEMM studies. W.L. performed LC–MS analysis. S.H. and J.D.R. developed the mathematical models. S.H. and J.D.R. wrote the paper with help from all authors.
Author Information The authors declare no competing financial interests. Readers are welcome to comment on the online version of the paper.
Publisher’s note: Springer Nature remains neutral with regard to jurisdictional claims in published maps and institutional affiliations.
Reviewer Information Nature thanks S. Kempa, M. Yuneeva and the other anonymous reviewer(s) for their contribution to the peer review of this work.
References
- 1.van Hall G. Lactate kinetics in human tissues at rest and during exercise. Acta Physiol (Oxf) 2010;199:499–508. doi: 10.1111/j.1748-1716.2010.02122.x. [DOI] [PubMed] [Google Scholar]
- 2.Sonveaux P, et al. Targeting lactate-fueled respiration selectively kills hypoxic tumor cells in mice. J Clin Invest. 2008;118:3930–3942. doi: 10.1172/JCI36843. [DOI] [PMC free article] [PubMed] [Google Scholar]
- 3.Kennedy KM, et al. Catabolism of exogenous lactate reveals it as a legitimate metabolic substrate in breast cancer. PLoS One. 2013;8:e75154. doi: 10.1371/journal.pone.0075154. [DOI] [PMC free article] [PubMed] [Google Scholar]
- 4.Feron O. Pyruvate into lactate and back: from the Warburg effect to symbiotic energy fuel exchange in cancer cells. Radiother Oncol. 2009;92:329–333. doi: 10.1016/j.radonc.2009.06.025. [DOI] [PubMed] [Google Scholar]
- 5.Hensley CT, et al. Metabolic heterogeneity in human lung tumors. Cell. 2016;164:681–694. doi: 10.1016/j.cell.2015.12.034. [DOI] [PMC free article] [PubMed] [Google Scholar]
- 6.Sugimoto M, et al. MMMDB: mouse multiple tissue metabolome database. Nucleic Acids Res. 2012;40:D809–D814. doi: 10.1093/nar/gkr1170. [DOI] [PMC free article] [PubMed] [Google Scholar]
- 7.McCabe BJ, Previs SF. Using isotope tracers to study metabolism: application in mouse models. Metab Eng. 2004;6:25–35. doi: 10.1016/j.ymben.2003.09.003. [DOI] [PubMed] [Google Scholar]
- 8.Annison EF, Lindsay DB, White RR. Metabolic interrelations of glucose and lactate in sheep. Biochem J. 1963;88:243–248. doi: 10.1042/bj0880243. [DOI] [PMC free article] [PubMed] [Google Scholar]
- 9.Forbath N, Kenshole AB, Hetenyi G., Jr Turnover of lactic acid in normal and diabetic dogs calculated by two tracer methods. Am J Physiol. 1967;212:1179–1184. doi: 10.1152/ajplegacy.1967.212.5.1179. [DOI] [PubMed] [Google Scholar]
- 10.Searle GL, Cavalieri RR. Determination of lactate kinetics in the human analysis of data from single injection vs. continuous infusion methods. Proc Soc Exp Biol Med. 1972;139:1002–1006. doi: 10.3181/00379727-139-36284. [DOI] [PubMed] [Google Scholar]
- 11.Okajima F, Chenoweth M, Rognstad R, Dunn A, Katz J. Metabolism of 3H− and 14C-labelled lactate in starved rats. Biochem J. 1981;194:525–540. doi: 10.1042/bj1940525. [DOI] [PMC free article] [PubMed] [Google Scholar]
- 12.Katz J, Okajima F, Chenoweth M, Dunn A. The determination of lactate turnover in vivo with 3H- and 14C-labelled lactate. The significance of sites of tracer administration and sampling. Biochem J. 1981;194:513–524. doi: 10.1042/bj1940513. [DOI] [PMC free article] [PubMed] [Google Scholar]
- 13.Layman DK, Wolfe RR. Sample site selection for tracer studies applying a unidirectional circulatory approach. Am J Physiol. 1987;253:E173–E178. doi: 10.1152/ajpendo.1987.253.2.E173. [DOI] [PubMed] [Google Scholar]
- 14.Binder ND, Day D, Battaglia FC, Meschia G, Sparks JW. Role of the circulation in measurement of lactate turnover rate. J Appl Physiol. 1991;70:1469–1476. doi: 10.1152/jappl.1991.70.4.1469. [DOI] [PubMed] [Google Scholar]
- 15.Norwich KH. Sites of infusion and sampling for measurement of rates of production in steady state. Am J Physiol. 1992;263:E817–E822. doi: 10.1152/ajpendo.1992.263.5.E817. [DOI] [PubMed] [Google Scholar]
- 16.Sacca L, Toffolo G, Cobelli C. V–A and A–V modes in whole body and regional kinetics: domain of validity from a physiological model. Am J Physiol. 1992;263:E597–E606. doi: 10.1152/ajpendo.1992.263.4.E597. [DOI] [PubMed] [Google Scholar]
- 17.Sauer U. Metabolic networks in motion: 13C-based flux analysis. Mol Syst Biol. 2006;2:62. doi: 10.1038/msb4100109. [DOI] [PMC free article] [PubMed] [Google Scholar]
- 18.Buescher JM, et al. A roadmap for interpreting 13C metabolite labeling patterns from cells. Curr Opin Biotechnol. 2015;34:189–201. doi: 10.1016/j.copbio.2015.02.003. [DOI] [PMC free article] [PubMed] [Google Scholar]
- 19.Metallo CM, Walther JL, Stephanopoulos G. Evaluation of 13C isotopic tracers for metabolic flux analysis in mammalian cells. J Biotechnol. 2009;144:167–174. doi: 10.1016/j.jbiotec.2009.07.010. [DOI] [PMC free article] [PubMed] [Google Scholar]
- 20.Warburg O. On the origin of cancer cells. Science. 1956;123:309–314. doi: 10.1126/science.123.3191.309. [DOI] [PubMed] [Google Scholar]
- 21.Vander Heiden MG, Cantley LC, Thompson CB. Understanding the Warburg effect: the metabolic requirements of cell proliferation. Science. 2009;324:1029–1033. doi: 10.1126/science.1160809. [DOI] [PMC free article] [PubMed] [Google Scholar]
- 22.Davidson SM, et al. Environment impacts the metabolic dependencies of Ras-driven non-small cell lung cancer. Cell Metab. 2016;23:517–528. doi: 10.1016/j.cmet.2016.01.007. [DOI] [PMC free article] [PubMed] [Google Scholar]
- 23.Mayers JR, et al. Tissue of origin dictates branched-chain amino acid metabolism in mutant Kras-driven cancers. Science. 2016;353:1161–1165. doi: 10.1126/science.aaf5171. [DOI] [PMC free article] [PubMed] [Google Scholar]
- 24.Brooks G. In: Circulation, Respiration, and Metabolism. Gilles R, editor. Springer; 1985. pp. 208–218. [Google Scholar]
- 25.Whitaker-Menezes D, et al. Evidence for a stromal-epithelial “lactate shuttle” in human tumors: MCT4 is a marker of oxidative stress in cancer-associated fibroblasts. Cell Cycle. 2011;10:1772–1783. doi: 10.4161/cc.10.11.15659. [DOI] [PMC free article] [PubMed] [Google Scholar]
- 26.Brooks GA. Cell-cell and intracellular lactate shuttles. J Physiol. 2009;587:5591–5600. doi: 10.1113/jphysiol.2009.178350. [DOI] [PMC free article] [PubMed] [Google Scholar]
- 27.Draoui N, Feron O. Lactate shuttles at a glance: from physiological paradigms to anti-cancer treatments. Dis Model Mech. 2011;4:727–732. doi: 10.1242/dmm.007724. [DOI] [PMC free article] [PubMed] [Google Scholar]
- 28.Gladden LB. Lactate metabolism: a new paradigm for the third millennium. J Physiol. 2004;558:5–30. doi: 10.1113/jphysiol.2003.058701. [DOI] [PMC free article] [PubMed] [Google Scholar]
- 29.Gladden LB. A lactatic perspective on metabolism. Med Sci Sports Exerc. 2008;40:477–485. doi: 10.1249/MSS.0b013e31815fa580. [DOI] [PubMed] [Google Scholar]
- 30.Nocito L, et al. The extracellular redox state modulates mitochondrial function, gluconeogenesis, and glycogen synthesis in murine hepatocytes. PLoS One. 2015;10:e0122818. doi: 10.1371/journal.pone.0122818. [DOI] [PMC free article] [PubMed] [Google Scholar]
- 31.Shetty S, et al. Enhanced fatty acid flux triggered by adiponectin overexpression. Endocrinology. 2012;153:113–122. doi: 10.1210/en.2011-1339. [DOI] [PMC free article] [PubMed] [Google Scholar]
- 32.Wollenberger A, Ristau O, Schoffa G. Eine einfache Technik der extrem schnellen Abkühlung größerer Gewebestücke. Pflugers Arch Gesamte Physiol Menschen Tiere. 1960;270:399–412. [PubMed] [Google Scholar]
- 33.Hingorani SR, et al. Preinvasive and invasive ductal pancreatic cancer and its early detection in the mouse. Cancer Cell. 2003;4:437–450. doi: 10.1016/s1535-6108(03)00309-x. [DOI] [PubMed] [Google Scholar]
- 34.Bardeesy N, et al. Both p16(Ink4a) and the p19(Arf)–p53 pathway constrain progression of pancreatic adenocarcinoma in the mouse. Proc Natl Acad Sci USA. 2006;103:5947–5952. doi: 10.1073/pnas.0601273103. [DOI] [PMC free article] [PubMed] [Google Scholar]
- 35.Melamud E, Vastag L, Rabinowitz JD. Metabolomic analysis and visualization engine for LC–MS data. Anal Chem. 2010;82:9818–9826. doi: 10.1021/ac1021166. [DOI] [PMC free article] [PubMed] [Google Scholar]
- 36.Lamarre SG, et al. An isotope-dilution, GC–MS assay for formate and its application to human and animal metabolism. Amino Acids. 2014;46:1885–1891. doi: 10.1007/s00726-014-1738-7. [DOI] [PubMed] [Google Scholar]
Associated Data
This section collects any data citations, data availability statements, or supplementary materials included in this article.
Supplementary Materials
Data Availability Statement
All data are available from the authors upon reasonable request. Source Data for Figs 1b–e, 2a–d, 3a–b and 4a–c and Extended Data Figs 2b–d, 3c, 4a–b, 5a–b, 7a–b, 8a–c and 9a–c are provided with the online version of the paper.


