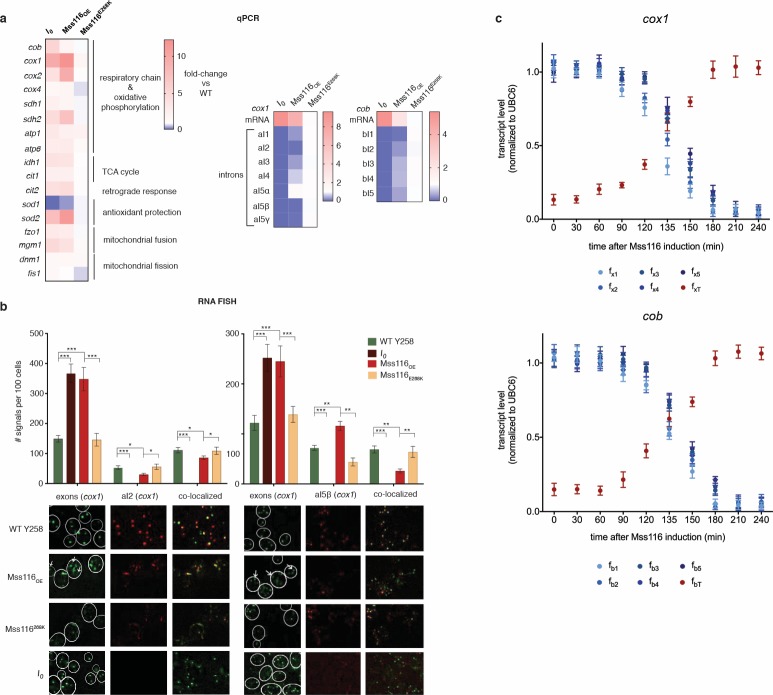
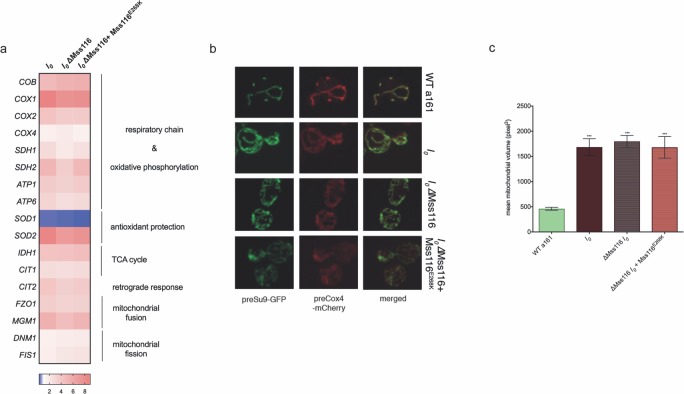
Figure 2. RNA abundance changes associated with intron removal.
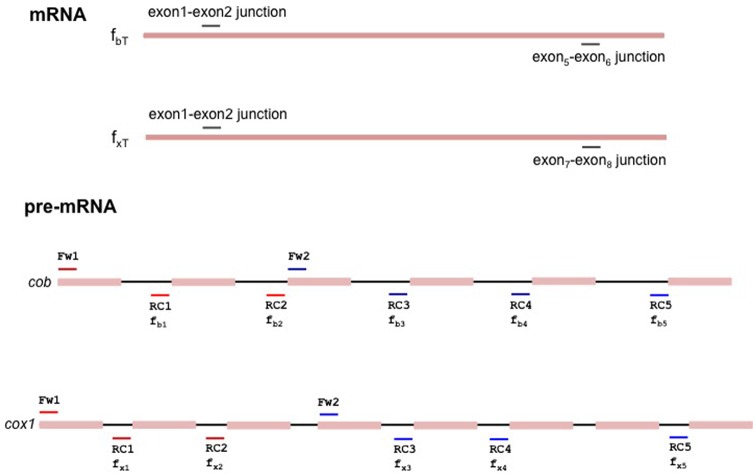
(a) qPCR measurements of selected genes, comparing focal strains (I0, Mss116OE, Mss116E268K) to their isogenic control strains (left panel). For both cox1 (central panel) and cob (right panel), intron levels are specifically reduced upon overexpression of Mss116OE but not Mss116E268K, while mature mRNA levels increase. Heat maps display mean values of log-fold changes observed across three biological replicates (each averaged over three technical replicates). UBC6 was used for normalization. (b) RNA-FISH confirms elimination/reduction of introns aI2 and aI5β from the cox1 transcript pool. Exon (green), intron (red) and co-localized (green/red) puncta were counted in more than 300 cells. The bar chart shows the number of signals per 100 cells. Bar heights display the mean of three biological replicates (each averaged over three technical replicates). Error bars are standard error of the mean. ***p<0.001; **p<0.01; *p<0.05 (ANOVA plus post hoc). White lines mark cell boundaries. White arrows mark examples of exonic puncta that do not co-localize with intronic puncta. (c) qPCR time series of pre-mRNA and mature mRNA levels following induction of Mss116. Mature mRNA for cox1 and cob was quantified using primer pairs (fxT, fbT) overlapping the terminal exon-exon junctions. Pre-mRNA was quantified using a series of primer pairs (fx1-5, fb1-5). For each pair, one primer is located in exonic, the other in intronic sequence, as detailed in Figure 2—figure supplement 4. Each circle (shades of blue for the pre-mRNA and red for the mature transcript) represents the mean value from three biological replicates (each averaged over three technical replicates). UBC6 was used for normalization.


