. 2018 Mar 9;7:e32346. doi: 10.7554/eLife.32346

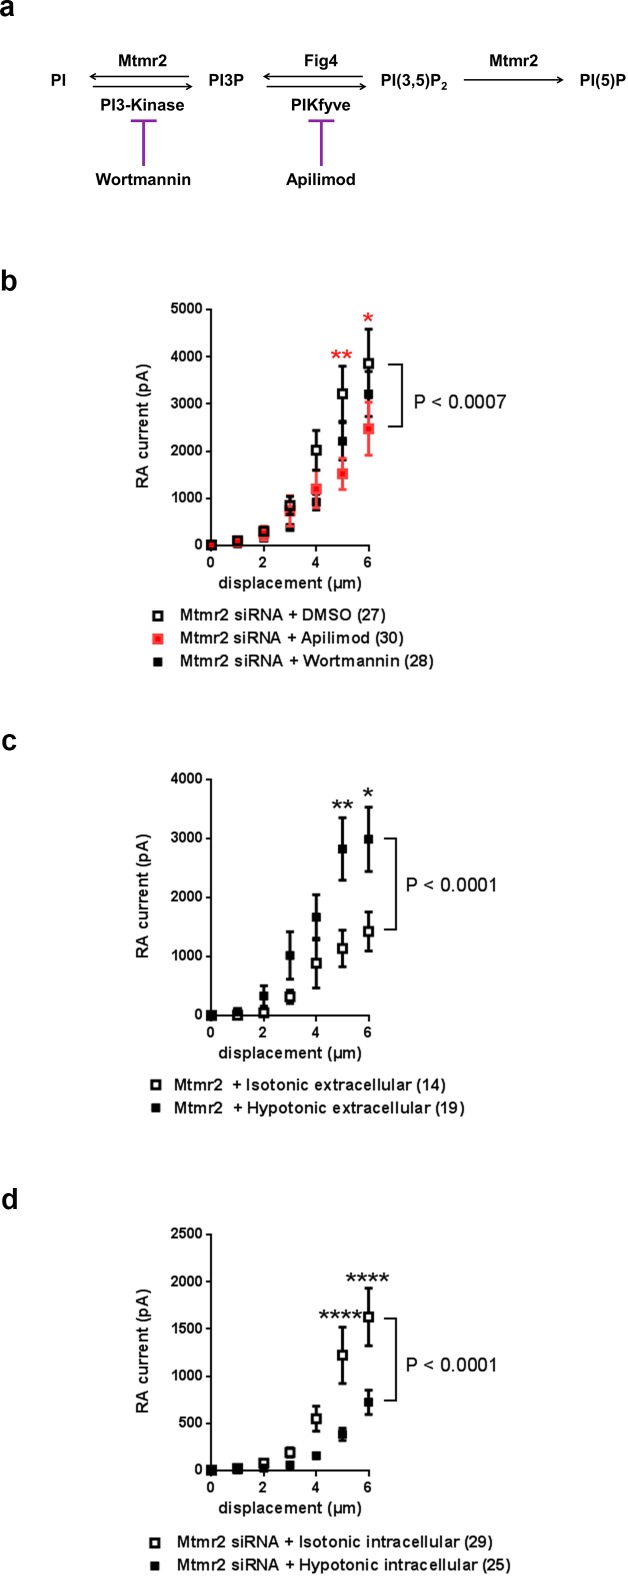
Figure 4. Mtmr2 modulates Piezo2-mediated RA-MA currents mainly via PI(3,5)P2.

(a) Scheme illustrating the major steps of PI(3,5)P2 synthesis and turnover including commonly used inhibitors and their targets. Wortmannin is an inhibitor of the phosphatidylinositol 3-kinase (PI3-Kinase) while Apilimod inhibits phosphatidylinositol 3-phosphate 5-kinase (PIKfyve). The Fig4 gene encodes a polyphosphoinositide phosphatase. (b) Stimulus-current curves after addition of Wortmannin, Apilimod or vehicle (DMSO) to Mtmr2 siRNA-treated neurons (Mtmr2 siRNA + DMSO: n = 27 neurons; Mtmr2 siRNA + Wortmannin: n = 28 neurons; Mtmr2 siRNA + Apilimod: n = 30 neurons). 2-way ANOVA suggested a significant (P<0.0007) overall effect on RA-MA currents. Holm-Sidak’s multiple comparisons test was performed to compare both conditions to DMSO at individual stimulus magnitudes. While no significant difference between Wortmannin and DMSO at individual stimulus magnitudes was observed, Apilimod application showed a significant reduction of currents compared to DMSO, p-values are indicated by * in the graph. Similarly, only Apilimod treatment increased the displacement threshold (p=0.0055 compared to DMSO-treated neurons, Kruskal-Wallis test followed by Dunn´s multiple comparisons test; Supplementary file 1). The inactivation time constants were unaltered by either treatment (Supplementary file 1). (c) Hypotonic extracellular solution counteracted the inhibition of Piezo2 RA-MA currents caused by Mtmr2 overexpression. Stimulus-current curves for Piezo2 RA-MA currents upon extracellular hypotonic stress application to DRG neurons overexpressing Mtmr2 (Mtmr2 + Isotonic extracellular solution: n = 14 neurons; Mtmr2 + Hypotonic extracellular solution: n = 19 neurons; 2-way ANOVA suggested that extracellular hypotonic stress had a significant (P<0.0001) effect on RA-MA currents. Holm-Sidak’s multiple comparisons test was performed to compare both conditions at individual stimulus magnitudes, p-values are indicated by * in the graph. The displacement threshold of RA-MA currents and inactivation time constant of RA-MA currents were unchanged (Supplementary file 1). (d) Hypotonic intracellular solution counteracted the potentiation of Piezo2 RA-MA currents caused by Mtmr2 knockdown. Stimulus-current curves for Piezo2 RA-MA currents upon intracellular hypotonic stress application to DRG neurons treated with Mtmr2 siRNA (Mtmr2 siRNA + Isotonic intracellular solution: n = 29 neurons; Mtmr2 siRNA + Hypotonic intracellular solution: n = 25 neurons; 2-way ANOVA suggested that intracellular hypotonic stress had a significant (P<0.0001) effect on RA-MA currents. Holm-Sidak’s multiple comparisons test was performed to compare both conditions at individual stimulus magnitudes, p-values are indicated by * in the graph. The displacement threshold of RA-MA currents was increased upon intracellular hypotonic stress (p=0.0131; Mann-Whitney test; Supplementary file 1). The inactivation time constant of RA-MA currents was unchanged (Supplementary file 1).

Figure 4.

Figure 4—figure supplement 1. Effect on Piezo2 RA-MA currents upon application of PIPs or Apilimod in cultured DRG.
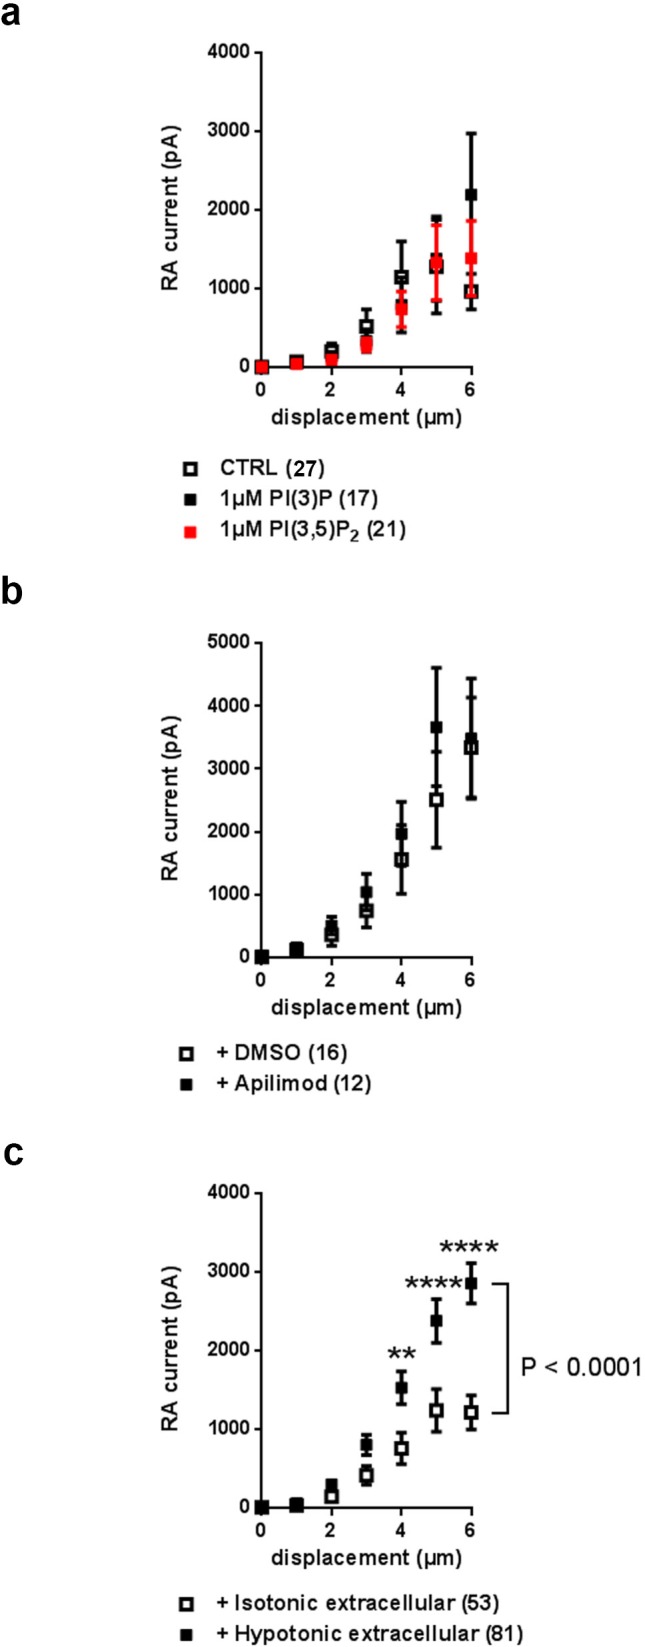
Figure 4—figure supplement 1.

(a) Stimulus-current curves of RA-MA currents are not altered upon addition of 1 µM PI(3)P or 1 µM PI(3,5)P2 (CTRL: n = 27 neurons; 1 µM PI(3)P: n = 17 neurons; 1 µM PI(3,5)P2: n = 21 neurons; ns; 2-way ANOVA). The displacement threshold and inactivation time constant of RA-MA currents also remained unchanged upon application of PIPs (Supplementary file 1). (b) Stimulus-current curves of RA-MA currents upon application of Apilimod or DMSO (vehicle) to wild type, untreated DRG neurons ( + DMSO: n = 16 neurons; + Apilimod: n = 12 neurons; ns; 2-way ANOVA). The displacement threshold and inactivation time constant (τ) of RA-MA currents remained unchanged upon treatment with Apilimod (Supplementary file 1). (c) Stimulus-current curves demonstrate Piezo2 RA-MA potentiation upon application of extracellular hypotonic stress to DRG cultures compared to isotonic conditions (Isotonic extracellular: n = 53 neurons; Hypotonic extracellular: n = 81 neurons). 2-way ANOVA suggested that hypotonic stress had a significant (P<0.0001) effect on RA-MA currents. Holm-Sidak’s multiple comparisons test was performed to compare conditions at individual stimulus magnitudes, p-values are indicated by * in the graph. The displacement threshold of RA-MA currents was significantly decreased by hypotonic stress (p=0.0021; Mann-Whitney test; Supplementary file 1). Given that Jia and colleagues (Jia et al., 2016) reported slower inactivation of MA currents upon prolonged hypotonic stress, we wanted to ensure that measured currents in our paradigm of acute hypotonic stress were of the RA-type. In fact, this was the case as judged by comparable inactivation time constants (Supplementary file 1). Of note, MA current properties shown here in wild type, untreated DRG neurons cannot be compared to nucleofected neurons in Figure 4. Nucleofection with siRNA or plasmids (i) alters neuronal and Piezo2 activity and (ii) required recordings to be performed on different days in vitro (2 DIV and 3 DIV, respectively) according to established protocols. Please see Materials and methods for more details on variability in DRG cultures. For this reason each dataset consists of experiments and respective matching controls measured in parallel (i) in the same mouse cohort and (ii), where possible, on each experimental day.
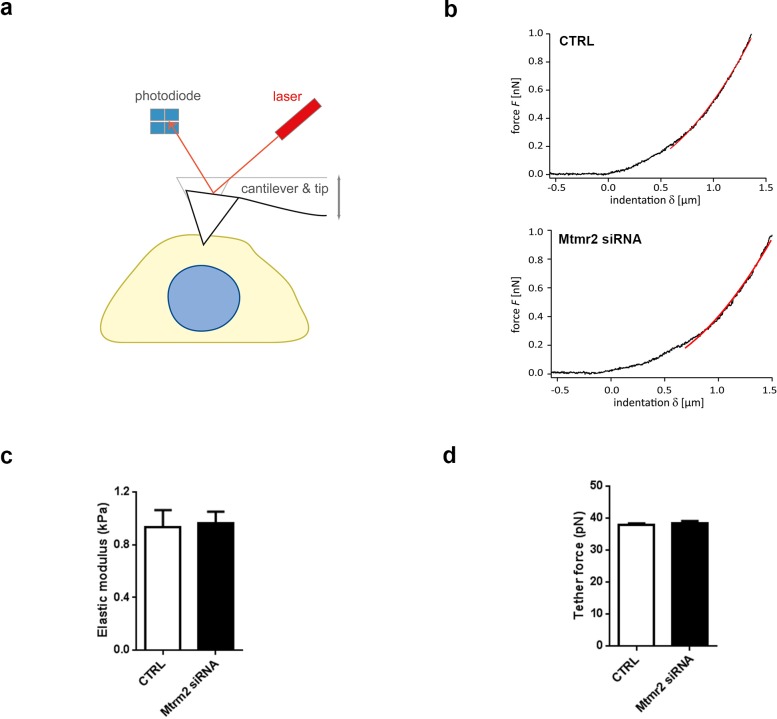
Figure 4—figure supplement 2. Mtmr2 knockdown does not obviously alter mechanical properties of cultured DRG neurons.

Figure 4—figure supplement 2.

(a) Sketch of the AFM set-up used to measure the mechanical properties of cultured DRG neurons transfected with CTRL or Mtmr2 siRNA. (b) Representative force-indentation curves for CTRL and Mtmr2 siRNA treated DRG neurons. (c) Quantification of effective Young’ modulus (Eeff) of DRG neurons shows no significant difference between CTRL and Mtmr2 siRNA treatment (CTRL: 0.93 ± 0.13 kPa, n = 44 neurons from N = 4 independent cultures; Mtmr2 siRNA: 0.96 ± 0.09 kPa, n = 48 neurons from N = 4 independent cultures; ns; Mann-Whitney test). (d) Quantification of tether force also showed no difference between conditions (37.74 ± 0.55 pN, n = 53 from N = 4 independent cultures; Mtmr2 siRNA: 38.30 ± 0.76 pN, n = 54 from N = 4 independent cultures; ns; Mann-Whitney test).