

Abstract
Environmental phenols are used commonly in personal care products and exposure is widespread in pregnant women. In this study, we sought to assess the association between maternal urinary phenol concentrations in pregnancy and fetal growth. The study population included 476 mothers who participated in the prospective LIFECODES birth cohort between 2006 and 2008 at Brigham and Women’s Hospital in Boston, Massachusetts, USA. Dichlorophenols (DCPs), benzophenone-3, parabens, triclosan, triclocarban, and bisphenol-S were measured in urine from three time points during pregnancy and averaged. Outcome measures were all standardized to create gestational-age specific z-scores and included: 1) birth weight; 2) ultrasound parameters measured at up to two time points in pregnancy (head and abdominal circumference and femur length); and 3) ultrasound estimates of fetal weight from two time points in combination with birth weight. Models were stratified to investigate sex differences. Inverse associations were observed between average 2,4- and 2,5-DCP concentrations and birth weight z-scores in males. For example, an interquartile range increase in 2,4-DCP was associated with a 0.18 standard deviation decrease in birth weight z-score (95% confidence interval [CI]= −0.33, −0.02). These associations were observed in models that included repeated ultrasound estimates of fetal weight during gestation as well. Also in males, we noted inverse associations between average triclosan exposure over pregnancy and estimated fetal weight combined with birth weight in repeated measures models. For females, associations were generally null. However, mothers with a detectable concentration of bisphenol-S at any of the study visits had lower weight females. In conclusion, we observed inverse associations between indicators of maternal phenol exposure during pregnancy and fetal growth, with several differences observed by sex.
Keywords: Endocrine disruptors, fetal growth, birthweight, growth restriction, ultrasound, anthropometry
1. Introduction
Suboptimal fetal growth during pregnancy is an important risk factor for stillbirth, neonatal death, and morbidity.1 It is also a predictor of adverse health outcomes in adult life, including cardiovascular and metabolic disease.2 Distinguishing normal from abnormal growth in itself is a challenge, and thus understanding of the causes of fetal growth restriction remains limited. Maternal health complications and placental disorders are known risk factors,3 but environmental factors are suspected to play a role as well.
Endocrine disrupting compounds (EDCs) may interfere with normal fetal growth by altering the maternal-fetal compartment hormonal milieu,4 or by interfering with normal implantation or nutrient transfer across the placenta.5 Persistent EDCs such as perfluorinated compounds, polybrominated diphenyl ethers, and polychlorinated biphenyls are associated with reduced fetal growth in humans,6–8 but studies of non-persistent EDCs such as phthalates and phenols are fewer.
Phenols are used in numerous products that we come into contact with on a day to day basis, including pesticides, personal care products like makeups, sunscreen, hand soap, and toothpaste, and plastics.9,10 Environmental exposure is common in the US and elsewhere, and has been linked to perturbations in endocrine activity in animals and humans, with commonly observed sex differences in associations.9,11 By endocrine disruption or other mechanisms, it has been hypothesized that maternal phenol exposure may adversely impact fetal growth. The studies that have investigated these associations in the past have been restricted to examining birth weight or other delivery parameters only, and are potentially missing changes occurring during pregnancy.12–18 Additionally, all but one of these studies have utilized a single spot urine sample to assess phenol exposure during gestation. This could be problematic because phenols have a short half-life in the human body, and one measurement may not accurately reflect maternal body burden over an extended period of time.19,20
Thus, we sought to examine the association between maternal urinary phenol concentrations measured at three time points in pregnancy in relation to fetal growth in a population of 476 pregnant women from Boston. To assess growth, we examined birth weight as well as longitudinal trajectories of anthropometric parameters measured by ultrasound, including head and abdominal circumference, femur length, and estimated fetal weight. Additionally, we examined effect modification by fetal sex as phenols may impact male and female growth differently.
2. Methods
2.1. Study population
The LIFECODES birth cohort is an ongoing prospective study begun in 2006 at Brigham and Women’s Hospital (BWH) in Boston, Massachusetts. Under the study design, mothers are recruited prior to 15 weeks gestation at BWH or affiliated academic practices. Gestational age is estimated according to American College of Obstetricians and Gynecologists (ACOG) guidelines.21 Women approached for participation are included in the study if they are carrying non-anomalous fetuses and plan to deliver at BWH. At the first study visit the mother provides informed consent and is asked to provide spot urine and blood samples as well as questionnaire information pertaining to demographic characteristics and medical history. At subsequent visits, targeted at 18, 26, and 35 weeks gestation, she provides additional spot urine and blood samples. At delivery, detailed information on any complications as well as gestational age and birth weight are recorded. This study protocol was approved by the Institutional Review Board at BWH.
In accordance with the ACOG guidelines, all pregnancies receive a first trimester aneuploidy screening, as well as a 16–22 week ultrasound for assessing fetal anatomy. From the latter ultrasound, measurements of head circumference (mm), femur length (mm), and abdominal circumference (mm) are recorded, and estimated fetal weight is calculated based on the formula of Hadlock.22 Additional ultrasound measurements from scans taken later in pregnancy are collected on many subjects, either for a medically indicated purpose or at the patient’s request, and also include each of these parameters. All scans were performed and reviewed by board-certified sonologists.
For the present analysis, we included participants with singleton deliveries between 2006 and 2008 from LIFECODES. These subjects were part of a case control study designed to assess the relationship between environmental exposures and preterm birth.23 All singleton preterm cases (delivery <37 weeks gestation) were selected for this study (n=130) and controls (delivery ≥37 weeks gestation) were selected randomly in an approximately 3:1 ratio (n=352). Of these participants, we drew unthawed urine aliquots from −80 degree C freezer storage for analysis of phenol concentrations. Phenols were measured in urine samples from at least one of the first three study visits in 476 participants (n=30 with 1 sample; n=106 with two samples; n=340 with three samples), which was the final sample size for the present analysis. To adjust for the study design, inverse probability weightings were applied to all analyses so that the results would be generalizable to the base LIFECODES birth cohort.24
2.2. Fetal growth measures
We excluded from analysis ultrasound measurements from the fetal anatomy screening as the variability in measurements is low at this time point (median 18 weeks gestation) and the likelihood of measurement error is high, which would skew our results toward the null.25,26 Subsequent ultrasound measurements (including head circumference, femur length, abdominal circumference, and the summary measure of estimated fetal weight) were available from 321 of the participants (67%). Participants had 0 (n=155), 1 (n=175), or 2 (n=146) measurements in pregnancy for each participant, collected from median 32.9 (range 19.9–40.3) weeks gestation. All subjects had birth weight measured at delivery (N=476), and delivered at median 39.0 (range 24.3–42.7) weeks gestation (weighted estimates). For statistical analyses, all parameters (i.e., head circumference, femur length, etc.) were standardized to gestational age specific Z-scores from the base BWH population as described elsewhere.27 Means and standard deviations that were used to calculate these Z-scores can be used for interpretation of effect estimates in repeated measures models, although the interpretation will change based on which gestational age is selected. We present interpretations for repeated measures of estimated fetal weight or birth weight at delivery based on the mean (standard deviation) of birth weight at 40 weeks gestation in grams: 3565 (426).27 Means and standard deviations in mm for head circumference (304, 13), abdominal circumference (298 20), and femur length (65, 3.3) from 33 weeks gestation (the median time of ultrasound scan) may also be applied for interpretation purposes.27
On a subset of the population placental weight (n=91) and newborn length (n=389) were measured at delivery. The placenta was weighed within 12–24 hours of delivery after being trimmed of its cord (within 2 cm of the insertion) per published guidelines.28 No attempt was made to control for the blood drained from the placental vasculature. These outcomes were not standardized and were examined in relation to phenols separately as an exploratory analysis.
2.3. Urinary phenol concentrations
Ten phenols were measured in previously unthawed urine samples by NSF International (Ann Arbor, MI) using isotope dilution–liquid chromatography–tandem mass spectrometry (ID–LC–MS/MS): 2,4-dichlorophenol (2,4-DCP); 2,5-dichlorophenol (2,5-DCP); benzophenone-3 (BP3); butyl, ethyl, methyl, and propyl parabens; triclosan; bisphenol-S; and triclocarban. An in-house method was developed, based on the Centers for Disease Control and Prevention Laboratory Procedure Manuals for BPA and Other Environmental Phenols in urine.29 The methods were validated in accordance with Food and Drug Administration Guidance for Industry: Bioanalytical Method Validation.30 Samples underwent enzymatic deconjugation of glucuronidated species, online solid phase extraction, and analysis using a Thermo Scientific (Waltham, MA, USA) Quantiva triple quadrupole mass spectrometer using multiple reaction monitoring in negative ionization APCI mode.
Urine sample online extraction was performed using a Thermo Scientific Cyclone-P (0.5 _ 50 mm) turbulent flow extraction column followed by chromatographic separation using a Waters (Milford, MA, USA) Xbridge C18 5µm (3.0 _ 150 mm) analytical column. Phenolic calibration ranges utilized were based on CDC methods. The validated analyte calibration curve correlation coefficient (R2) range was 0.985–1.000. The method accuracy (% nominal concentration) and precision (%RSD) were determined through six replicate analyses of analytes spiked at four different concentrations in human urine across validation runs on three separate days (n = 18) which reflects both the intra-day and inter-day variability of the assay. The accuracy (% nominal concentration) range across all analytes was 91–109% with precision (%RSD) range for both aqueous and urine quality control samples across all analytes being 2.2–12%. Phenol measurements reported as below the limit of detection were replaced by the limit of detection divided by the square root of 2.
Specific gravity (SG) of the urine samples was also measured using a handheld digital refractometer (ATAGO Company Ltd., Tokyo, Japan) as an indicator of urine dilution. Measurements taken at visits 1–3 were corrected for urinary specific gravity using a previously published formula23 and used to calculate a subject-specific geometric average (hereafter referred to as subject-specific average phenol concentrations). Phenols with low detection (<50 percent) were treated as binary variables representing ever vs. never detection at visits 1–3. While condensing the phenol measures into an average eliminates our ability to examine windows of vulnerability to exposure in relation to growth, it provides much better reliability of assignment of individual exposure levels across pregnancy.31
2.4. Covariates
All models were adjusted for demographic or pregnancy related characteristics that were examined in a forward stepwise procedure and retained in final models if they impacted effect estimates by 10 percent or more. Covariates that were considered included: maternal age (continuous, years); Race/Ethnicity (White, African American, or Other); pre-pregnancy body mass index (BMI, kg/m2); health insurance provider (private or public); education level (high school or less, technical school, junior or some college, or college graduate); fetal sex; use of assisted reproductive technology or in vitro fertilization specifically; parity; gravidity; and tobacco or alcohol use in pregnancy.
2.5 Statistical analysis
Weighted population characteristics within the study population were tabulated. Distributions of subject-specific average phenol concentrations were examined using selected percentiles and Spearman correlation coefficients between compounds were calculated. Geometric mean and geometric standard deviation levels of subject-specific average phenol concentrations were examined by demographic as well as pregnancy characteristics. Differences in levels across groups were tested using generalized linear models.
For the primary analysis, we first examined the relationship between subject-specific average phenol concentrations and gestational age-specific birth weight Z-scores alone using generalized linear models. Sample size available for crude models was 476. The same approach was used for examining associations between subject-specific average phenol concentrations and placental weight (n=91) and birth length (n=389) available on a subset of participants. Effect estimates were converted to standard deviation change in birth weight Z-score (grams or centimeters change for placental weight and birth length, respectively) in association with an interquartile range (IQR) difference in average phenol concentrations.
Second, to fully utilize our repeated growth measures, we examined the relationship between subject-specific average phenol concentrations and repeated measures of head circumference, abdominal circumference, and femur length Z-scores using linear mixed effects models with random intercepts for each subject and random slopes for gestational age at the time of ultrasound (continuous). Sample size available for crude models was 321 subjects, 467 repeated measurements. Estimated fetal weight measurements were examined in the same manner except they were combined with birth weight z-score into one measure. Thus, sample size available for crude models was 476 subjects, 943 repeated measurements. As with models of birth weight z-scores, effect estimates were converted to standard deviation change in growth measurement in association with an IQR difference in average phenol concentration.
Third, we examined these associations in models stratified by fetal sex, as phenols are potential endocrine disrupting compounds and may exhibit sex differences in their effects. Differences in associations by sex were tested in a model that included an interaction term between sex and phenol as well as each covariate.32
All analyses were performed in R version 3.2.3 with packages Hmisc and nlme.
3. Results
The study population (Table 1) included in the present analysis was primarily White (59 percent), well educated (41 percent with a college degree or higher), and of high socioeconomic status (80 percent with private health insurance providers). Tobacco and alcohol use in pregnancy was rare (5 percent for each). In regard to pregnancy characteristics, 11 percent of participants utilized some form of assisted reproductive technology to get pregnant, 55 percent had previously delivered a child, and 56 percent carried a female fetus. With inverse probability weightings, 12 percent delivered preterm, which is within expectations for a tertiary care hospital in the US.
Table 1.
Population characteristics (N=476).
| N | Weighted % | ||
|---|---|---|---|
| Age | <25 years | 52 | 12% |
| 25–30 years | 95 | 20% | |
| 30–35 years | 187 | 39% | |
| >35 years | 142 | 29% | |
|
| |||
| Race/ethnicity | White | 279 | 59% |
| African American | 77 | 16% | |
| Other | 120 | 25% | |
|
| |||
| Pre-pregnancy BMI (missing=11) | < 25 kg/m2 | 257 | 56% |
| 25–30 kg/m2 | 119 | 26% | |
| >30 kg/m2 | 89 | 18% | |
|
| |||
| Health insurance (missing=12) | Private | 375 | 80% |
| Public | 89 | 20% | |
|
| |||
| Education (missing=11) | High school | 67 | 14% |
| Technical school | 77 | 16% | |
| Junior/some college | 136 | 29% | |
| College graduate | 185 | 41% | |
|
| |||
| Fetal sex | Male | 210 | 44% |
| Female | 266 | 56% | |
|
| |||
| Assisted reproductive technology | No | 426 | 89% |
| Yes | 50 | 11% | |
|
| |||
| In vitro fertilization | No | 446 | 94% |
| Yes | 30 | 6% | |
|
| |||
| Nulliparous | No | 266 | 55% |
| Yes | 210 | 45% | |
|
| |||
| Gravid | No | 140 | 30% |
| Yes | 336 | 70% | |
|
| |||
| Tobacco use in pregnancy | No | 448 | 95% |
| Yes | 28 | 5% | |
|
| |||
| Alcohol use in pregnancy (missing=10) | No | 447 | 95% |
| Yes | 19 | 5% | |
|
| |||
| Preterm | No | 347 | 88% |
| Yes | 129 | 12% | |
Most phenols were detected in over 80 percent of samples, with the exception of ethyl paraben (68 percent detection), bisphenol-S (27% percent detection), and triclocarban (12 percent detection; Table 2). In subsequent analysis, bisphenol-S and triclocarban were treated as binary variables (ever vs. never detection at visits 1–3).
Table 2.
Weighted distributions of specific gravity corrected subject-specific phenol averages in µg/L (N=476).
| LOD | N (%) <LOD | 25th | 50th | 75th | 90th | 95th | |
|---|---|---|---|---|---|---|---|
| 2,4-DCP | 0.2 | 48 (10.1) | 0.43 | 0.72 | 1.45 | 3.49 | 7.56 |
| 2,5-DCP | 0.2 | 8 (1.68) | 1.54 | 3.22 | 11.9 | 54.8 | 165 |
| Benzophenone-3 | 0.4 | 0 | 14.0 | 46.5 | 179 | 736 | 1852 |
| Butyl paraben | 0.2 | 93 (19.5) | 0.30 | 1.28 | 4.15 | 13.18 | 23.8 |
| Ethyl paraben | 1.0 | 151 (31.7) | 1.17 | 2.57 | 11.9 | 35.4 | 70.1 |
| Methyl paraben | 1.0 | 0 | 78.1 | 186 | 374 | 681 | 1112 |
| Propyl paraben | 0.2 | 0 | 17.3 | 43.3 | 101 | 212 | 335 |
| Triclosan | 2.0 | 58 (12.1) | 4.35 | 13.5 | 50.3 | 177 | 313 |
| Bisphenol-S | 0.4 | 349 (73.3) | <LOD | <LOD | 0.59 | 0.94 | 1.32 |
| Triclocarban | 2.0 | 417 (88.0) | <LOD | <LOD | 2.64 | 4.23 | 5.99 |
Note: Phenols highlighted in gray had subject-specific averages that were below the detection limit in >50% of samples. Abbreviations: 2,4-DCP, 2,4-dichlorophenol; 2,5-DCP, 2,5-dichlorophenol; LOD, limit of detection.
Phenols generally showed differences by demographic but not pregnancy-related factors (Supplemental Tables 1 and 2). Dichlorophenols and methyl and propyl parabens were higher in younger compared to older mothers, in Blacks compared to Whites, and in public compared to private health insurance holders (i.e., low vs. high socioeconomic status). BP3 concentrations were higher in older compared to younger mothers, in Whites compared to Blacks, in high compared to low BMI groups, and in high compared to low socioeconomic status groups (i.e., by health insurance provider or education level). Detection of bisphenol-S was more common in mothers who were Black, had high BMI, had a public health insurance provider, or who had lower education levels compared to reference categories. Detection was also more common in mothers who were parous, gravid, and who used tobacco during pregnancy. Patterns for triclocarban detection were similar to those observed for detection of bisphenol-S (Supplemental Table 2).
Specific-gravity corrected phenol averages showed low to moderate correlations with one another (Supplemental Table 3). 2,4- and 2,5-DCP were strongly correlated with each other (Spearman R=0.65) but not with other phenols (R<0.3). Parabens were also moderately correlated with one another (R=0.24–0.6) with the exception of propyl and methyl parabens which were highly correlated (R=0.82). Triclosan was moderately correlated with 2,4-DCP (R=0.29) but lowly correlated with other phenols (R<0.15).
In generalized linear models of subject-specific phenol averages in relation to birth weight Z-scores, associations were generally inverse but non-significant in models that were unadjusted or adjusted for maternal age, race/ethnicity, pre-pregnancy BMI, and health insurance provider (Table 3). However, when these associations were stratified by sex some patterns emerged (Table 4). In males, maternal dichlorophenol levels were significantly associated with lower birth weight Z-score. An interquartile range difference in average 2,4-DCP was associated with a 0.18 standard deviation decrease in birth weight z-score (95% confidence interval [CI]= − 0.33, −0.02), which corresponds to a 77 gram decrease in birth weight (based on a mean and standard deviation for birth weight in the overall BWH cohort of 3565 and 427 grams, respectively at 40 weeks).27 For 2,5-DCP, an IQR difference was associated with a 0.21 standard deviation decrease in birth weight z-score (95% CI= −0.40, −0.03), which corresponds to a 90-gram decrease in birth weight. The differences by sex were significant or suggestive (p for interactions=0.04 and 0.06 for 2,4-DCP and 2,5-DCP, respectively). The associations between dichlorophenols and weight in males were likewise observed in repeated measures models that incorporated information on estimated fetal weight during pregnancy (Figure 1d). Some inverse associations were noted with other growth parameters measured by ultrasound (i.e., head circumference, abdominal circumference, and femur length, Figure 1a–c), but in general these associations were null. 2,4-DCP was associated with reduced birth length in males (Supplemental Table 4).
Table 3.
Weighted change (95% confidence intervals) in birth weight z-score in association with an interquartile range differencea in subject-specific specific gravity-corrected phenol average.
| Model 1 (N=476 participants) | Model 2 (N=459 participants) | |||
|---|---|---|---|---|
|
| ||||
| Z-score change (95% CI) | p | Z-score change (95% CI) | p | |
| 2,4-DCP | −0.08 (−0.18, 0.02) | 0.12 | −0.05 (−0.17, 0.06) | 0.35 |
| 2,5-DCP | −0.09 (−0.20, 0.02) | 0.10 | −0.06 (−0.20, 0.07) | 0.37 |
| Benzophenone-3 | 0.01 (−0.11, 0.14) | 0.83 | −0.03 (−0.17, 0.11) | 0.69 |
| Butyl paraben | −0.05 (−0.20, 0.09) | 0.49 | −0.11 (−0.26, 0.04) | 0.16 |
| Ethyl paraben | −0.03 (−0.17, 0.11) | 0.68 | −0.04 (−0.18, 0.11) | 0.62 |
| Methyl paraben | −0.13 (−0.25, −0.01) | 0.03 | −0.07 (−0.19, 0.05) | 0.27 |
| Propyl paraben | −0.09 (−0.20, 0.02) | 0.12 | −0.06 (−0.17, 0.06) | 0.34 |
| Triclosan | −0.02 (−0.15, 0.12) | 0.83 | −0.05 (−0.19, 0.09) | 0.52 |
| Bisphenol-S | −0.14 (−0.33, 0.04) | 0.16 | −0.12 (−0.31, 0.08) | 0.23 |
| Triclocarban | 0.08 (−0.19, 0.34) | 0.14 | 0.22 (−0.05, 0.50) | 0.11 |
In models for phenols highlighted in gray effect estimates correspond to change in birth weight z-score in association with ever vs. never detection at visits 1, 2, or 3. Model 1: unadjusted. Model 2: Adjusted for maternal age, race/ethnicity, pre-pregnancy body mass index, and health insurance provider. Abbreviations: 2,4-DCP, 2,4-dichlorophenol; 2,5-DCP, 2,5-dichlorophenol.
Table 4.
Weighted percent change (95% confidence intervals) in birth weight z-score in association with an interquartile range differencea in subject-specific specific gravity-corrected phenol average, stratified by fetal sex.
| Male (N=205 participants) | Female (N=254 participants) | p (interaction) | |||
|---|---|---|---|---|---|
|
| |||||
| Z-score change (95% CI) | p | Z-score change (95% CI) | p | ||
| 2,4-DCP | −0.18 (−0.33, −0.02) | 0.03 | 0.06 (−0.10, 0.23) | 0.43 | 0.04 |
| 2,5-DCP | −0.21 (−0.40, −0.03) | 0.03 | 0.05 (−0.14, 0.24) | 0.62 | 0.06 |
| Benzophenone-3 | −0.10 (−0.29, 0.09) | 0.32 | 0.01 (−0.18, 0.21) | 0.89 | 0.42 |
| Butyl paraben | −0.09 (−0.30, 0.11) | 0.36 | −0.13 (−0.35, 0.09) | 0.23 | 0.80 |
| Ethyl paraben | −0.02 (−0.24, 0.19) | 0.82 | −0.10 (−0.29, 0.10) | 0.33 | 0.63 |
| Methyl paraben | −0.14 (−0.31, 0.03) | 0.10 | −0.03 (−0.22, 0.15) | 0.72 | 0.40 |
| Propyl paraben | −0.06 (−0.23, 0.10) | 0.45 | −0.06 (−0.22, 0.11) | 0.48 | 0.97 |
| Triclosan | −0.17 (−0.37, 0.02) | 0.08 | 0.06 (−0.14, 0.26) | 0.55 | 0.10 |
| Bisphenol-S | −0.02 (−0.29, 0.26) | 0.91 | −0.19 (−0.46, 0.07) | 0.16 | 0.37 |
| Triclocarban | 0.03 (−0.35, 0.42) | 0.86 | 0.37 (−0.02, 0.76) | 0.06 | 0.23 |
In models for phenols highlighted in gray effect estimates correspond to change in birth weight z-score in association with ever vs. never detection at visits 1, 2, or 3. Models adjusted for maternal age, race/ethnicity, pre-pregnancy body mass index, and health insurance provider. Abbreviations: 2,4-DCP, 2,4-dichlorophenol; 2,5-DCP, 2,5-dichlorophenol.
Figure 1.
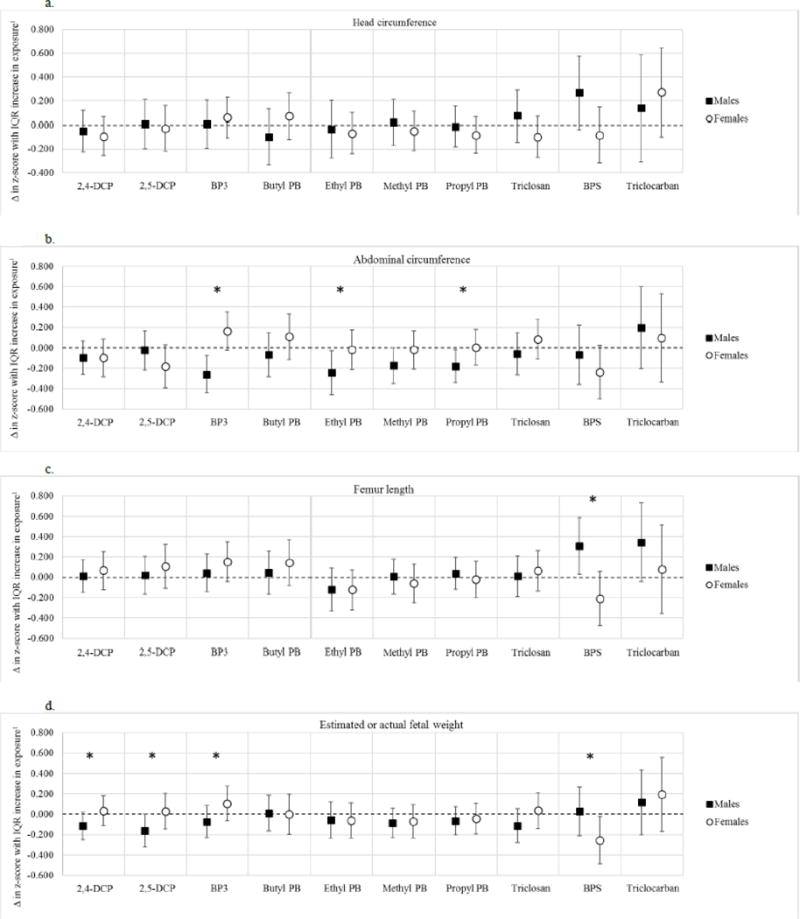
a–d. Adjusted change (Δ) in fetal growth z-score in association with an interquartile (IQR) range difference in specific gravity-corrected urinary exposure biomarker concentrations1 for the following parameters: A) Head circumference; B) Abdominal circumference; C) Femur length; and D) Estimated fetal weight combined with birth weight.
Footnote: Note: For BPS and Triclocarban, results are in association with ever vs. never detection at visits 1–3. *Denotes interaction p values <0.20. Results from linear mixed effects models for males had the following sample sizes: models of head and abdominal circumference or femur length, n=133 participants and 191 observations; models of estimated fetal weight combined with birth weight, n=205 participants and 396 observations. Results from linear mixed effects models for females had the following sample sizes: models of head and abdominal circumference and femur length, n=179 participants and 261 observations; models of estimated fetal weight combined with birth weight, n=254 participants and 517 observations. Models weighted for study design, include subject specific random intercepts and slopes for gestational age at ultrasound measurement, and are adjusted for maternal age, race/ethnicity, pre-pregnancy body mass index, and health insurance provider. Abbreviations: 2,4-DCP, 2,4-dichlorophenol; 2,5-DCP, 2,5-dichlorophenol; BP3, benzophenone-3; PB, paraben; BPS, bisphenol-S.
Triclosan in mothers carrying male fetuses was also associated with a suggestive decrease in birth weight z-score (IQR difference in exposure associated with a 0.17 standard deviation decrease, 95% CI= −0.37, 0.02). Furthermore, despite a small sample size (n=42), an IQR difference in triclosan was associated with a 134 gram decrease in placental weight (95% CI= −218, −49.3; Supplemental Table 4).
Other phenols measured were not associated with birth weight z-scores in males. However, in repeated measures analyses, we found that higher levels of BP3 and methyl, ethyl, and propyl parabens were associated with significantly reduced abdominal circumference (Figure 1). For example, an IQR change in BP3 was associated with a 0.26 standard deviation decrease in abdominal circumference (95% CI= −0.44, −0.08). Additionally, bisphenol-S detection was associated with an increase in head circumference and femur length (Figure 1).
For females, associations were generally null. However, bisphenol-S detection was consistently, though non-significantly, associated with lower birth weight z-score (change in z-score in association with ever vs. never detection= −0.19, 95% CI= −0.46, 0.07) and with repeated measures of abdominal circumference (change in z-score with ever vs. never detection= −0.24, 95% CI= −0.50, 0.02), femur length (change in z-score with ever vs. never detection= −0.21, 95% CI= −0.48, 0.06), and estimated fetal weight combined with birth weight (change in z-score with ever vs. never detection= −0.25, 95% CI= −0.49, −0.02). For the latter, a −0.25 standard deviation change in weight z-score at 40 weeks gestation corresponds to a 108 gram decrease in birth weight. Finally, bisphenol-S was associated with a non-significant decrease in birth length at delivery (change with ever vs. never detection= −0.35 cm, 95% CI= −1.13, 0.43).
4. Discussion
2,4- and 2,5-DCP are used as pesticides and in pharmaceutical products, and exposure in the US is prevalent.33 Previous studies of DCP and fetal growth have similarly suggested an adverse role in male development but have been limited by using a single spot urine sample to assess exposure. One study in males only observed associations between single spot urine measures of DCPs during pregnancy and lower birth weight.15 Another study, also using single spot urine samples, observed an association between 2,5-DCP and reduced birth weight and length in males but not in girls.17 However, the only other study of repeated ultrasound and early life measures of growth in males only (N=520) was unable to detect associations between either of the DCPs and the various growth parameters examined, although this study too utilized a single spot urine sample for exposure assessment.14 As in our study, no associations between DCPs and growth in females have been identified, although this association has only been examined in one other study.17
Parabens are used as preservatives in cosmetics and other personal care products, as well as in some foods. Urine concentrations are higher in women compared to men in the US population.34 Benzophenone-3 is a UV blocker used in sunscreens and other products that is also detected at higher concentrations in women compared to men.35 We observed no associations between parabens or benzophenone-3 and fetal weight in either sex. Previous results have also been largely null, particularly for parabens.12,15,16 However, some studies have found prenatal exposure to parabens14,18 or benzophenone-315,17 to be positively associated with growth parameters in boys. For boys in our study we observed inverse and non-significant associations between parabens and benzophenone-3 and weight; however, we observed significant inverse associations with repeated measures of abdominal circumference. The latter could indicate growth restriction with a brain-sparing effect, or asymmetric fetal growth.36 In the only other study to examine this parameter no associations were observed, which may have been due to the use of a single spot urine sample to assess exposure.14 These associations could indicate that these compounds are adversely impacting growth of the liver – the predominant component of fetal abdominal size. In regard to girls, previous studies have observed suggestive inverse associations between birth weight and benzophenone-317 or parabens.18 We found no evidence for such a relationship in our analysis; however, we did observe suggestive positive associations between benzophenone-3 and repeated measures of fetal growth (abdominal circumference, femur length, and weight).
Triclosan and triclocarban are antimicrobial agents used in personal care products. Their suspected toxicities have resulted in an FDA ban of use of triclosan in hand soaps in the US and voluntary phase outs of the chemicals in other products. Several studies have published null findings on associations between triclosan exposure and fetal growth.12,15 However, three studies observed inverse associations between exposure and various growth parameters that were specific to males.13,14,17 We observed suggestive inverse associations between triclosan and repeated measures of estimated fetal weight combined with birth weight z-scores that were specific to males. We also observed a significant inverse association between triclosan and placental weight in males, despite a small sample size. This is the first study to our knowledge to examine triclocarban in relation to fetal growth. While we did not observe any significant associations, detection of triclocarban at any time point in pregnancy was associated with higher ultrasound measures of fetal growth in both males and females, and with higher birth weight z-scores in females particularly. Since detection was very low in this study population (12%), additional investigation in higher exposed populations is necessary.
Bisphenol-S is a replacement product for bisphenol-A and is used in thermal receipt paper, epoxy resins, and polycarbonate plastics. Some data suggest that it may have similar endocrine disrupting properties to bisphenol-A.37 While a number of studies have examined associations between bisphenol-A and fetal growth,17,38 this is the first study to our knowledge to investigate bisphenol-S in this setting. Detection was low (27%), and thus we treated this variable as ever vs. never detection in pregnancy. This could have been affected by availability of urine samples for measurement (i.e., women with more urine samples available had a greater probability of being classified as exposed compared to women with fewer urine samples available). However, having a urine sample available at any of the three time points examined was not associated with birth weight z-score so we would not expect this to bias our results. Despite the limitations of our ability to assess bisphenol-S exposure, we observed some suggestive associations in girls specifically. Having a detectable concentration at any of the study visits was associated with reduced abdominal circumference, femur length, and the combined measure of estimated fetal weight and birth weight in repeated measures models, with the latter reaching statistical significance. These findings should be explored carefully in a more recent population with higher exposure levels.
The primary limitation of our study was our use of ultrasound measures that were collected clinically and not as part of the study design. Thus, the measures included in the repeated measures analyses may over represent pregnancies that were suspected to have problems with growth. This may have biased our results to the null if interventions were applied to improve growth for those participants (e.g., recommended dietary supplements). However, having additional ultrasound measurements was not associated with exposure to phenols in our study population, and thus we would not expect this to differentially bias our findings. It would, however, limit their generalizability. Especially for the findings on ultrasound parameters only, i.e., head circumference, abdominal circumference, and femur length, the results may only be generalizable to women presenting at a tertiary care facility who are receiving more than one anthropometry ultrasound in pregnancy. Our findings for weight measurements are more generalizable a population of pregnant women receiving prenatal care at a tertiary care facility in the US because all women who had information on birth weight were included in those analyses.
Another limitation from the way the ultrasound data was collected was sample size, particularly in examining associations stratified by fetal sex. Finally, we performed a large number of comparisons in this study which may have led to some chance findings. For associations where we have the greatest consistency across parameters and with previously published results, for example, for dichlorophenols associations, we have the greatest confidence. Others findings should be interpreted with caution and replicated.
Despite these limitations, our study is the only study of phenol exposure and fetal growth to date to examine repeated biomarkers of exposure during gestation. By creating subject-specific averages of these multiple measurements we were able to better estimate individual exposure levels during pregnancy and thus have greater power to detect effects. We also had the ability to assess associations between exposure and repeated measurements of fetal growth parameters which gave us additional power as well.
5. Conclusions
In a population of pregnant women from Boston, we observed sex-specific associations between biomarkers of maternal phenol exposure during pregnancy and reduced fetal growth. For males, 2,4 and 2,5-DCP were associated with lower weight, parabens and benzophenone-3 were associated with lower abdominal circumference, and triclosan was suggestively associated with lower weight and placental weight. For females, detection of bisphenol-S in maternal urine was associated with lower weight, and suggestively associated with lower abdominal circumference and femur length. These associations should be verified in larger study populations with planned repeated ultrasound measures during pregnancy. However, our findings suggest that maternal exposure to phenols during pregnancy could have sexually dimorphic repercussions for the developing fetus.
Supplementary Material
Highlights.
Phenols from three visits were averaged to examine associations with fetal growth.
We examined birth weight on 476 newborns as well as ultrasound parameters.
Dichlorophenols were associated with reduced growth in boys.
Detection of bisphenol-S in pregnancy was associated with reduced growth in girls.
Acknowledgments
Initial funding for the recruitment of the birth cohort was provided by Abbott Diagnostics (9MZ-04-06N03). Support for Dr. Ferguson was provided by the Intramural Research Program of the NIH, National Institute of Environmental Health Sciences. All other funding was provided by the National Institute of Environmental Health Sciences, National Institutes of Health (R01ES018872, P42ES017198, P01ES022844, and P30ES017885).
ABBREVIATIONS
- EDCs
Endocrine disrupting compounds
- BWH
Brigham and Women’s Hospital
- 2,4-DCP
2,4-dichlorophenol
- 2,5-DCP
2,5-dichlorophenol
- BP3
benzophenone-3
- SG
specific gravity
- BMI
body mass index
- IQR
interquartile range
- CI
confidence interval
Footnotes
Publisher's Disclaimer: This is a PDF file of an unedited manuscript that has been accepted for publication. As a service to our customers we are providing this early version of the manuscript. The manuscript will undergo copyediting, typesetting, and review of the resulting proof before it is published in its final citable form. Please note that during the production process errors may be discovered which could affect the content, and all legal disclaimers that apply to the journal pertain.
References
- 1.Figueras F, Gardosi J. Intrauterine growth restriction: new concepts in antenatal surveillance, diagnosis, and management. American journal of obstetrics and gynecology. 2011;204(4):288–300. doi: 10.1016/j.ajog.2010.08.055. [DOI] [PubMed] [Google Scholar]
- 2.Barker DJ. Adult consequences of fetal growth restriction. Clinical obstetrics and gynecology. 2006;49(2):270–283. doi: 10.1097/00003081-200606000-00009. [DOI] [PubMed] [Google Scholar]
- 3.Obstetricians ACo, Gynecologists. ACOG Practice bulletin no. 134: fetal growth restriction. Obstetrics and gynecology. 2013;121(5):1122. doi: 10.1097/01.AOG.0000429658.85846.f9. [DOI] [PubMed] [Google Scholar]
- 4.Bigsby R, Chapin RE, Daston GP, et al. Evaluating the effects of endocrine disruptors on endocrine function during development. Environmental health perspectives. 1999;107(Suppl 4):613. doi: 10.1289/ehp.99107s4613. [DOI] [PMC free article] [PubMed] [Google Scholar]
- 5.Robins JC, Marsit CJ, Padbury JF, Sharma SS. Endocrine disruptors, environmental oxygen, epigenetics and pregnancy. Frontiers in bioscience (Elite edition) 2011;3:690. doi: 10.2741/e279. [DOI] [PMC free article] [PubMed] [Google Scholar]
- 6.Zheng T, Zhang J, Sommer K, et al. Effects of Environmental Exposures on Fetal and Childhood Growth Trajectories. Annals of Global Health. 2016;82(1):41–99. doi: 10.1016/j.aogh.2016.01.008. [DOI] [PMC free article] [PubMed] [Google Scholar]
- 7.Lopez-Espinosa M-J, Costa O, Vizcaino E, et al. Prenatal exposure to polybrominated flame retardants and fetal growth in the INMA Cohort (Spain) Environmental science & technology. 2015;49(16):10108. doi: 10.1021/acs.est.5b01793. [DOI] [PMC free article] [PubMed] [Google Scholar]
- 8.Lopez-Espinosa M-J, Murcia M, Iñiguez C, et al. Organochlorine compounds and ultrasound measurements of fetal growth in the INMA cohort (Spain) Environmental health perspectives. 2016;124(1):157. doi: 10.1289/ehp.1408907. [DOI] [PMC free article] [PubMed] [Google Scholar]
- 9.Darbre PD, Harvey PW. Paraben esters: review of recent studies of endocrine toxicity, absorption, esterase and human exposure, and discussion of potential human health risks. Journal of applied toxicology. 2008;28(5):561–578. doi: 10.1002/jat.1358. [DOI] [PubMed] [Google Scholar]
- 10.Agency for Toxic Substances and Disease Registry. Toxicological profile for chlorophenols. 1999 https://www.atsdr.cdc.gov/toxprofiles/tp107.pdf. Accessed 03/02/2017. [PubMed]
- 11.Koeppe ES, Ferguson KK, Colacino JA, Meeker JD. Relationship between urinary triclosan and paraben concentrations and serum thyroid measures in NHANES 2007– 2008. Science of the Total Environment. 2013;445:299–305. doi: 10.1016/j.scitotenv.2012.12.052. [DOI] [PMC free article] [PubMed] [Google Scholar]
- 12.Geer LA, Pycke BF, Waxenbaum J, Sherer DM, Abulafia O, Halden RU. Association of birth outcomes with fetal exposure to parabens, triclosan and triclocarban in an immigrant population in Brooklyn, New York. Journal of hazardous materials. 2017;323:177–183. doi: 10.1016/j.jhazmat.2016.03.028. [DOI] [PMC free article] [PubMed] [Google Scholar]
- 13.Lassen TH, Frederiksen H, Kyhl HB, et al. Prenatal triclosan exposure and anthropometric measures including anogenital distance in Danish infants. Environmental health perspectives. 2016;124(8):1261. doi: 10.1289/ehp.1409637. [DOI] [PMC free article] [PubMed] [Google Scholar]
- 14.Philippat C, Botton J, Calafat AM, et al. Prenatal exposure to phenols and growth in boys. Epidemiology (Cambridge, Mass) 2014;25(5):625. doi: 10.1097/EDE.0000000000000132. [DOI] [PMC free article] [PubMed] [Google Scholar]
- 15.Philippat C, Mortamais M, Chevrier C, et al. Exposure to phthalates and phenols during pregnancy and offspring size at birth. Environmental health perspectives. 2012;120(3):464. doi: 10.1289/ehp.1103634. [DOI] [PMC free article] [PubMed] [Google Scholar]
- 16.Tang R, Chen M-j, Ding G-d, et al. Associations of prenatal exposure to phenols with birth outcomes. Environmental pollution. 2013;178:115–120. doi: 10.1016/j.envpol.2013.03.023. [DOI] [PubMed] [Google Scholar]
- 17.Wolff MS, Engel SM, Berkowitz GS, et al. Prenatal phenol and phthalate exposures and birth outcomes. Environmental health perspectives. 2008;116(8):1092. doi: 10.1289/ehp.11007. [DOI] [PMC free article] [PubMed] [Google Scholar]
- 18.Wu C, Huo W, Li Y, et al. Maternal urinary paraben levels and offspring size at birth from a Chinese birth cohort. Chemosphere. 2016 doi: 10.1016/j.chemosphere.2016.12.131. [DOI] [PubMed] [Google Scholar]
- 19.Guidry VT, Longnecker MP, Aase H, et al. Measurement of total and free urinary phenol and paraben concentrations over the course of pregnancy: assessing reliability and contamination of specimens in the Norwegian Mother and Child Cohort Study. Environmental health perspectives. 2015;123(7):705. doi: 10.1289/ehp.1408325. [DOI] [PMC free article] [PubMed] [Google Scholar]
- 20.Meeker JD, Cantonwine DE, Rivera-González LO, et al. Distribution, variability, and predictors of urinary concentrations of phenols and parabens among pregnant women in Puerto Rico. Environmental science & technology. 2013;47(7):3439–3447. doi: 10.1021/es400510g. [DOI] [PMC free article] [PubMed] [Google Scholar]
- 21.American College of Obstetricians and Gynecologists. Committee opinion no 611: method for estimating due date. Obstetrics and gynecology. 2014;124(4):863–866. doi: 10.1097/01.AOG.0000454932.15177.be. [DOI] [PubMed] [Google Scholar]
- 22.Hadlock FP, Harrist RB, Sharman RS, Deter RL, Park SK. Estimation of fetal weight with the use of head, body, and femur measurements–a prospective study. Am J Obstet Gynecol. 1985;151(3):333–337. doi: 10.1016/0002-9378(85)90298-4. [DOI] [PubMed] [Google Scholar]
- 23.Ferguson KK, McElrath TF, Meeker JD. Environmental phthalate exposure and preterm birth. JAMA pediatrics. 2014;168(1):61–68. doi: 10.1001/jamapediatrics.2013.3699. [DOI] [PMC free article] [PubMed] [Google Scholar]
- 24.Jiang Y, Scott AJ, Wild CJ. Secondary analysis of case‐control data. Statistics in medicine. 2006;25(8):1323–1339. doi: 10.1002/sim.2283. [DOI] [PubMed] [Google Scholar]
- 25.Casas M, Valvi D, Ballesteros-Gomez A, et al. Exposure to bisphenol A and phthalates during pregnancy and ultrasound measures of fetal growth in the INMA-Sabadell cohort. Environmental health perspectives. 2016;124(4):521. doi: 10.1289/ehp.1409190. [DOI] [PMC free article] [PubMed] [Google Scholar]
- 26.Hindmarsh PC, Geary MP, Rodeck CH, Kingdom JC, Cole TJ. Intrauterine growth and its relationship to size and shape at birth. Pediatric Research. 2002;52(2):263–268. doi: 10.1203/00006450-200208000-00020. [DOI] [PubMed] [Google Scholar]
- 27.Cantonwine DE, Ferguson KK, Mukherjee B, et al. Utilizing longitudinal measures of fetal growth to create a standard method to assess the impacts of maternal disease and environmental exposure. PloS one. 2016;11(1):e0146532. doi: 10.1371/journal.pone.0146532. [DOI] [PMC free article] [PubMed] [Google Scholar]
- 28.Driscoll S, Langston C. College of American Pathologists Conference XIX on the Examination of the Placenta: report of the Working Group on Methods for Placental Examination. Archives of pathology & laboratory medicine. 1991;115(7):704. [PubMed] [Google Scholar]
- 29.Centers for Disease Control and Prevention. Laboratory procedure manual for phenols. 2009 [Google Scholar]
- 30.Food and Drug Administration. Guidance for industry: bioanalytical method validation. 2001 [Google Scholar]
- 31.Meeker JD, Cantonwine DE, Rivera-González LO, et al. Distribution, variability and predictors of urinary concentrations of phenols and parabens among pregnant women in Puerto Rico. Environmental science & technology. 2013;47(7):3439. doi: 10.1021/es400510g. [DOI] [PMC free article] [PubMed] [Google Scholar]
- 32.Buckley J, Doherty B, Keil A, Engel SM. Statistical approaches for estimating sex-specific effects in endocrine disruptors research. Environmental Health Perspectives. doi: 10.1289/EHP334. in press. [DOI] [PMC free article] [PubMed] [Google Scholar]
- 33.Ye X, Lee-Yang W, Zhou X, Calafat AM. Urinary concentrations of 2, 4-dichlorophenol and 2, 5-dichlorophenol in the US population (National Health and Nutrition Examination Survey, 2003-2010): trends and predictors. Environmental Health Perspectives (Online) 2014;122(4):351. doi: 10.1289/ehp.1306816. [DOI] [PMC free article] [PubMed] [Google Scholar]
- 34.Calafat AM, Ye X, Wong L-Y, Bishop AM, Needham LL. Urinary concentrations of four parabens in the US population: NHANES 2005-2006. Environmental health perspectives. 2010;118(5):679. doi: 10.1289/ehp.0901560. [DOI] [PMC free article] [PubMed] [Google Scholar]
- 35.Calafat AM, Wong L-Y, Ye X, Reidy JA, Needham LL. Concentrations of the sunscreen agent benzophenone-3 in residents of the United States: National Health and Nutrition Examination Survey 2003-2004. Environmental health perspectives. 2008;116(7):893. doi: 10.1289/ehp.11269. [DOI] [PMC free article] [PubMed] [Google Scholar]
- 36.Campbell S, Thoms A. Ultrasound measurement of the fetal head to abdomen circumference ratio in the assessment of growth retardation. BJOG: An International Journal of Obstetrics & Gynaecology. 1977;84(3):165–174. doi: 10.1111/j.1471-0528.1977.tb12550.x. [DOI] [PubMed] [Google Scholar]
- 37.Rochester JR, Bolden AL. Bisphenol S and F: a systematic review and comparison of the hormonal activity of bisphenol A substitutes. Environmental Health Perspectives (Online) 2015;123(7):643. doi: 10.1289/ehp.1408989. [DOI] [PMC free article] [PubMed] [Google Scholar]
- 38.Snijder CA, Heederik D, Pierik FH, et al. Fetal growth and prenatal exposure to bisphenol A: the generation R study. Environmental Health Perspectives (Online) 2013;121(3):393. doi: 10.1289/ehp.1205296. [DOI] [PMC free article] [PubMed] [Google Scholar]
Associated Data
This section collects any data citations, data availability statements, or supplementary materials included in this article.