Abstract
We investigated the possibility of Ca2+ signaling in cyanobacteria (blue-green algae) by measuring intracellular free Ca2+ levels ([Ca2+]i) in a recombinant strain of the nitrogen fixing cyanobacterium Anabaena strain sp. PCC7120, which constitutively expresses the Ca2+-binding photoprotein apoaequorin. The homeostasis of intracellular Ca2+ in response to increasing external Ca2+ has been studied in this strain. The resting level of free Ca2+ in Anabaena was found to be between 100 and 200 nm. Additions of increasing concentrations of external Ca2+ gave a transient burst of [Ca2+]i followed by a very quick decline, reaching a plateau within seconds that brought the level of [Ca2+]i back to the resting value. These results indicate that Anabaena strain sp. PCC7120 is able to regulate its internal Ca2+ levels. We also monitored Ca2+ transients in our recombinant strain in response to heat and cold shock. The cell's response to both stresses was dependent on the way they were induced. The use of inhibitors suggests that heat shock mobilizes cytosolic Ca2+ from both intracellular and extracellular sources, while the Ca2+ source for cold shock signaling is mostly extracellular.
Ca2+ is a well-known second messenger in signal transduction of environmental stimuli and hormones in eukaryotic cells (Campbell, 1983). In prokaryotic cells, an equivalent important role for Ca2+ has been harder to demonstrate, but is now becoming clearer (Onek and Smith, 1992; Smith, 1995; Norris et al., 1996). However, the role(s) for Ca2+ is still not well defined. Dating from the pre-Cambrian era, the cyanobacteria have a long history of adaptation to the earth's environment, and that makes them suitable candidates to study adaptation mechanisms and their regulation. In fact, to survive in extreme or variable environments, cyanobacteria have developed specific regulatory systems (those controlling the differentiation of specialized cells), in addition to more general mechanisms equivalent to those of other prokaryotes or photosynthetic eukaryotes. In this context, Ca2+ has attracted the most attention, since it could be implicated in regulatory mechanisms as it is in eukaryotes (in particular, those regulating responses to environmental variables; Smith, 1988, 1995; Tandeau de Marsac and Houmard, 1993; Norris et al., 1996).
To demonstrate a regulatory role for Ca2+ in any cell system, it is essential to measure resting intracellular free Ca2+ levels as well as those arising in response to stimuli or environmental signals; nevertheless, its accurate quantitation during cellular signaling events has proven very difficult. 45Ca2+-based methods and especially Ca2+-sensitive fluorescent dyes have been used over the past quite extensively, but not without problems that limit their application. The fluorescent dyes show a general resistance to entry into plant cells (Bush and Jones, 1990), and in bacteria, considerable problems have been encountered with dye loading and autofluorescence (Gangola and Rosen, 1987).
Fortunately, the possibility of transforming animal, plant, and bacterial cells with the Ca2+-binding-sensitive luminescent protein apoaequorin (Knight et al., 1991a, 1991b; Brini et al., 1995) has allowed the quantitation of intracellular Ca2+ fluxes accompanying diverse stimuli (Knight et al., 1991a, 1991b; Watkins et al., 1995; Okazaki et al., 1996; Sedbrook et al., 1996; Takahashi et al., 1997; Chandra and Low, 1997; Gong et al., 1998; Volotovski et al., 1998).
The present study was undertaken to investigate whether Ca2+ has a regulatory role in cyanobacteria. We report the construction of a recombinant strain of the nitrogen-fixing cyanobacterium Anabaena sp. PCC7120 that constitutively expresses the Ca2+-binding photoprotein apoaequorin. We have used this system to study the homeostasis of intracellular Ca2+ levels in this cyanobacterium and to monitor Ca2+ transients in response to environmental stresses such as heat and cold shock.
RESULTS
Calibration of the Aequorin Signal
To transform luminescence values into [Ca2+]i values, we have basically followed the method described by Allen and Blinks (1978), which relies on the relationship between [Ca2+]i and the ratio L0/ Lmax, where L0, the light intensity at time intervals of 1 s, is obtained by integrating the luminometer output (in millivolts) over these 1-s intervals, and Lmax is defined as the sum of all L0 values from that interval to the end of the experiment. As aequorin is being consumed continuously, the value of Lmax is not constant and decreases steadily during the experiment. The relationship between the ratio (L0/Lmax) and [Ca2+]i has been modeled mathematically (Allen et al., 1976). The model (model B) is based on the assumptions that each of the sites to which Ca2+ binds has two states, T and R, which are in equilibrium, and that light is emitted by the molecule only when all sites are in the R state.
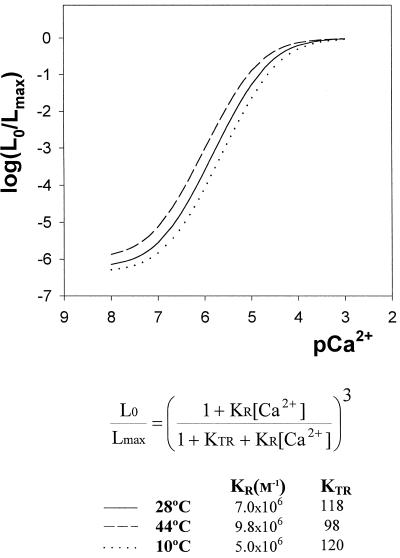
The model contains three parameters: KR, the equilibrium association constant; KTR = [T]/[R]; and n, the number of Ca2+-binding sites of the molecule. Figure 1 shows the calibration curves obtained at different temperatures (44°C, 28°C, and 10°C) of recombinant aequorin from cell lysates of Anabaena strain sp. PCC7120 calculated according to this model. Experimental data were obtained by mixing a solution containing the recombinant aequorin with solutions containing different [Ca2+] that give defined pCa values in the final solutions, as described in “Materials and Methods.” The data plotted in Figure 1 were used to fit a theoretical curve based on the model mentioned above, obtaining the best values for parameters KR, KTR, and n. Fitting was made using a computer routine designed to use the Marquardt-Levenberg algorithm (Marquardt, 1963). The values obtained in this way for the control curve at 28°C (KR = 7 × 10⁶ m−1; KTR = 118; and n = 3) for the fitting of the [Ca2+]/(L0/Lmax) relationship of recombinant aequorin are the same as those found by Allen et al. (1976) with purified aequorin from Aequorea, and very similar to those obtained by Brini et al. (1995) (KR = 7.23 × 10⁶ m−1; KTR = 120; and n = 2.99) using recombinant aequorin from transformed HeLa cells.
Figure 1.
Calibration of recombinant aequorin luminescence at different temperatures (44°C, 28°C, and 10°C). The recombinant aequorin cell lysate (50 μL) at the appropriate temperature was mixed with 950 μL of the Ca2+ buffer at the appropriate temperature (see “Materials and Methods” for details). The shown continuous curves correspond to the best fit of the experimental data to model B of Allen et al. (1976) as detailed in “Results.”
The influence of temperature on the Ca2+ calibration curves, as shown in Figure 1, indicates that warming induces a slight acceleration of the luminescent reaction that is somewhat more pronounced at the lower end of the curve (nanomolar range); as also shown in the figure, cooling has the opposite effect. The calibration curves at different temperatures allowed us to obtain much more accurate data from the heat and cold shock experiments.
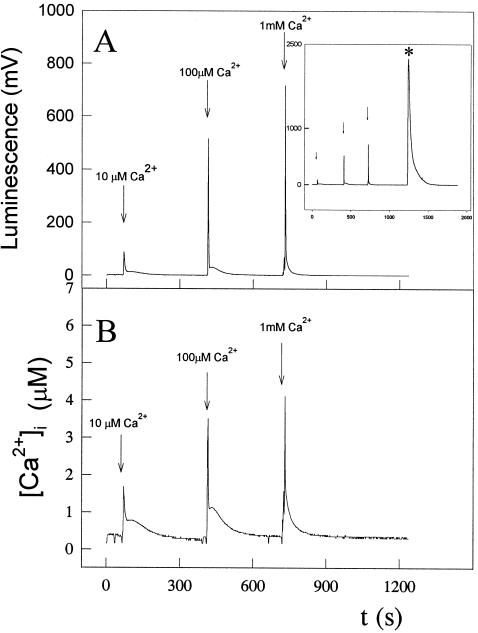
The calibration curves shown in the figure also indicate that the aequorin isoform used for transformation is very sensitive, since the dose-response curve begins below a pCa of 7 (around 100 nm free Ca2+) and is saturated well above pCa 5 (around 10 μm free Ca2+). All in vivo Ca2+ measurements were performed at least three times, and the results were highly reproducible. A representative trace from the replicates was taken for each experiment and is represented in the figures. Luminescence values were transformed into calibrated [Ca2+]i using the appropriate calibration curve according to the temperature needed for the experiment (Fig. 1); as an example, Figure 2B (see below) presents the transformation in free Ca2+ (micromolar) of the luminescence data presented in Figure 2A. As shown by Figure 2A, the final consumption of aequorin was never greater than 6% to 10% of total (the area occupied by the Ca2+/Triton discharge at the end of measurements comprised about 90% to 94% of the total signal) in our experiments, except when 10 mm Ca2+ and 5 μm A23187 were used (see below) and around 28% of aequorin was consumed (the total Ca2+/Triton discharge at the end of measurement of about 72%). However, in the latter case, the fact that the ionophore at such concentration in the presence of 10 mm Ca2+ did not completely discharge the photoprotein is difficult to explain unless, under our experimental conditions, this ionophore concentration does not have a full effect on the cyanobacterial cells.
Figure 2.
Effect of external Ca2+ concentration on the regulation of Anabaena [Ca2+]i. Cell suspensions expressing apoaequorin were reconstituted with coelenterazine, as described in “Materials and Methods.” Coelenterazine-treated cells (0.5 mL) were placed in a luminometer cuvette, and luminescence was recorded every 1 s. CaCl2 was injected in the sample at the times indicated to give external Ca2+ concentrations of 10 μm, 100 μm, and 1 mm. At the end of the experiment, 0.5 mL of 100 mm CaCl2 and 5% (v/v) Triton X-100 was added to discharge the remaining aequorin. A, Light emission of the recombinant aequorin (in mV). In the inset, the asterisk indicates the peak area comprising the remaining aequorin discharge by the addition of an equal volume of 100 mm CaCl2 and 5% Triton X-100. B, Calculated [Ca2+]i values obtained using the calibration curve depicted in Figure 2. These experiments were repeated 15 times, and the traces represented have been chosen to best represent the average result.
Studies on the Regulation of Intracellular Free Ca2+ Levels ([Ca2+]i) by Anabaena Strain sp. PCC7120
A fundamental requirement for Ca2+-mediated regulation is the ability of the species in question to regulate intracellular free Ca2+ levels. Considering the cytotoxic effects of excess Ca2+, all cells are likely to possess a means of keeping their background free Ca2+ levels very low, thus maintaining a Ca2+ concentration gradient across the cell membrane. We therefore studied the ability of Anabaena cells to regulate internal free Ca2+ levels in response to increasing external Ca2+ concentrations.
As Figure 2B shows, external additions of 10 μm, 100 μm, and 1 mm CaCl2 gave a transient burst of intracellular free Ca2+, followed by a very quick decline (fast phase of recovery), reaching a plateau within seconds that brought the level of intracellular free Ca2+ back to the resting value (slow phase of recovery). To rule out the possibility that the observed spikes could be due to a discharge of aequorin released into the medium by lysed cells or by lysis of cells upon addition of Ca2+, we measured luminescence after the addition of Ca2+ to the medium in which reconstituted cells were present after removing cells by centrifugation, and found no luminescence signal. We also measured phycobiliproteins in the supernatant with negative results, indicating that the Ca2+ transients were not due to cell lysis. The resting value of [Ca2+]i was found to be between 100 and 200 nm. These results indicate that Anabaena is apparently able to regulate its internal free Ca2+ levels.
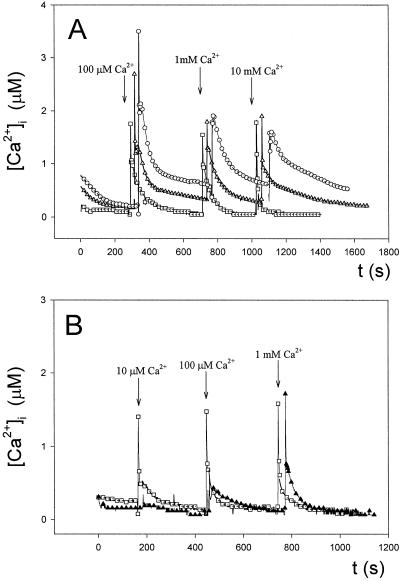
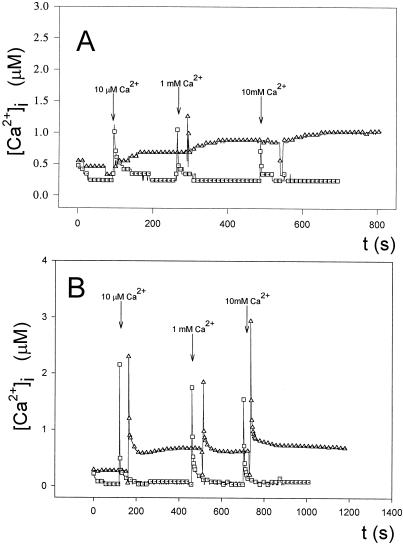
To confirm that the observed intracellular response was specific to external Ca2+ additions, we treated cells with the Ca2+ ionophore calcimycin (A23187) and with the Ca2+ chelator EGTA. Treatment with calcimycin resulted in larger spikes of intracellular Ca2+ compared with controls when cells were challenged with increasing external Ca2+; in addition, the Ca2+ transients in the presence of the ionophore were longer lived (Fig. 3A). On the contrary, EGTA inhibited the response and the only elevation of internal free Ca2+ levels occurred when the concentration of external Ca2+ was higher (1 mm) than the concentration of EGTA used (500 μm) (Fig. 3B). We checked the pH of the EGTA-containing medium throughout the experiment and found no significant lowering of the medium pH (already buffered at pH 7.2) when Ca2+ was added (not shown). The results with the Ca2+ agonist (ionophore) and the Ca2+ antagonist (chelator) show that the observed intracellular Ca2+ transients are indeed a response to challenge with external Ca2+ and that influx of Ca2+ from the extracellular space occurs.
Figure 3.
Effect of the Ca2+ ionophore calcimycin (compound A23187) and the Ca2+ chelator EGTA on the regulation of Anabaena [Ca2+]i. A, Effect of preincubation for 15 min in 1 μm (▵) or 5 μm (○) calcimycin on intracellular Ca2+ transients induced by increasing external Ca2+ concentrations compared with the control (□). B, Effect of preincubation for 15 min in 500 μm EGTA (▴) on intracellular Ca2+ transients compared with the control (□). CaCl2 was injected in the sample when indicated by the arrows. These experiments were repeated 10 times, and the traces represented have been chosen to best represent the average result.
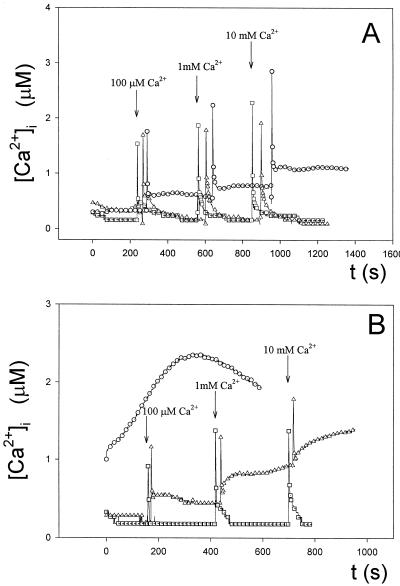
The presence of a Ca2+ homeostat in a cell system implies the existence of mechanisms of Ca2+ regulation that control influx and efflux through the membrane. In cyanobacteria, Ca2+ influx may involve low passive permeability and/or Ca2+-sensitive channels as those described for eukaryotic cells. To investigate that, we used the plasma membrane Ca2+-channel blockers verapamil and La3+ (Fig. 4). The organic blocker verapamil (Fig. 4A) did not inhibit the Ca2+ transients induced by increasing the external Ca2+ concentration. However, with the higher concentration (500 μm), after the initial rapid decline in [Ca2+]i, basal levels were not approached, and instead remained quite high (between 0.5 and 1 μm). In the lysate assay we found that verapamil at the concentrations indicated in Figure 4A did not affect the response of aequorin (not shown).
Figure 4.
Effect of plasma membrane Ca2+ channel blockers verapamil and La3+ (LaCl3) on the regulation of Anabaena [Ca2+]i. A, Effect of preincubation for 30 min in 200 μm (▵) or 500 μm (○) verapamil on intracellular Ca2+ transients induced by increasing external Ca2+ concentrations compared with the control (□). B, Effect of preincubation for 20 min in 100 μm (▵) or 1 mm (○) LaCl3 on intracellular Ca2+ transients induced by increasing external Ca2+ concentrations compared with the control (□). CaCl2 was injected in the sample when indicated by the arrows. These experiments were repeated 10 times, and the traces represented have been chosen to best represent the average result.
La3+ (1 mm but not 100 μm) directly stimulated the luminescence of aequorin in our lysate assay (not shown), which should explain why 1 mm La3+ evoked a significant elevation of the resting levels of [Ca2+]i even before CaCl2 was injected into the sample (Fig. 4B). La3+ (100 μm) did not stimulate aequorin in the lysate assay; in fact, as shown in Figure 4B, the resting level of Ca2+ before the addition of CaCl2 was not modified by this concentration of La3+; the addition of CaCl2 to cells treated with 100 μm of La3+ provoked a significant and apparently uncontrolled elevation of the levels of [Ca2+]i. In response to increasing external Ca2+ concentrations, Ca2+ influx apparently does not depend on the activation of verapamil-sensitive channels. Furthermore, La3+ at 100 μm provokes an uncontrolled increase in [Ca2+]I, probably due to the fact that La3+ may enter the cell and inhibit intracellular Ca2+ channels and/or Ca2+ pumps (ATPases) needed to regulate the efflux of Ca2+ ions. However, when the concentration of La3+ used was higher (1 mm), as shown by our lysate assay, the high levels of luminescence encountered in the in vivo assay could be due mostly to direct stimulation of aequorin by the ion.
In connection with this effect of La3+, and as described above (Fig. 2B), after the initial rise of intracellular Ca2+, there was a decline to homeostatic values. As already described, this decline appears to be a two-phase phenomenon and it is important to determine whether the fast or the slow phase of the decrease in [Ca2+]i is rectified by Ca2+ efflux (Ca2+ pumps and/or Ca2+ exchangers) and/or intracellular binding by Ca2+ binding proteins. To address this question, we treated the cells with the calmodulin inhibitor TFP (Fig. 5A) and the Ca2+-exchanger inhibitor diltiazem (Fig. 5B). Treatment with TFP provoked a poor regulation of [Ca2+]i when cells were challenged with increasing external Ca2+; after the initial rise in [Ca2+]i, the cells maintained throughout the experiment extremely high levels of [Ca2+]i and no decline was observed, suggesting an important role for Ca2+-binding proteins in Ca2+ homeostasis in this cyanobacterium. In this context, one could reasonably expect the observed elevation of the resting [Ca2+]i values caused by TFP.
Figure 5.
Effect of the calmodulin inhibitor TFP and the Ca2+-exchanger inhibitor diltiazem on the regulation of Anabaena [Ca2+]i. A, Effect of preincubation for 1 h in 10 μm TFP (▵) on intracellular Ca2+ transients induced by increasing external Ca2+ concentrations compared with the control (□). B, Effect of preincubation for 45 min in 500 μm diltiazem (▵) on intracellular Ca2+ transients induced by increasing external Ca2+ concentrations compared with the control (□). CaCl2 was injected in the sample when indicated by the arrows. These experiments were repeated eight times, and the traces represented have been chosen to best represent the average result.
These findings are also supported by the fact that, in our lysate assay, TFP at the concentration indicated in Figure 5A did not affect the response of aequorin (not shown). Treatment with diltiazem also elevated the resting level, but had no effect on the initial rise of [Ca2+]i and the subsequent fast phase of recovery, although it impaired the slow phase of regulation of [Ca2+]i levels, as they never settled back to basal values. In the lysate assay, diltiazem at the concentration indicated in Figure 5B did not affect the response of aequorin (not shown). Thus, the effect of diltiazem, although not as pronounced as that of TFP, suggests that in vivo the Ca2+ electroneutral exchangers also may have a role in allowing the return of [Ca2+]i to resting values. The combination of both systems, Ca2+-binding proteins and Ca2+ exchangers (we cannot rule out the possible role of Ca2+ pumps) possibly prevent excessive Ca2+ accumulation and, thus, cell damage in cyanobacteria.
Intracellular Free Ca2+ Changes in Response to Heat Shock
As indicated in “Materials and Methods,” heat shock was applied either by immersing cell suspensions in a water bath at 44°C or by directly irrigating with hot water.
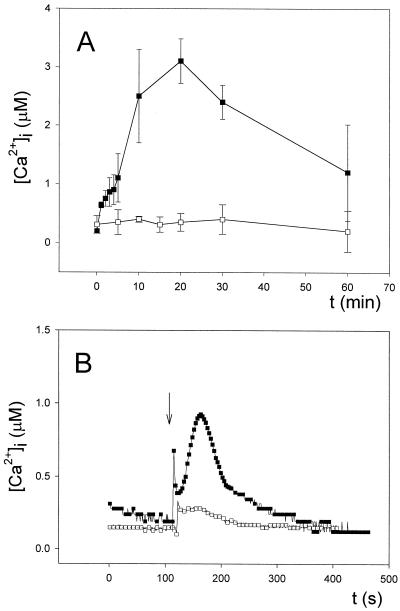
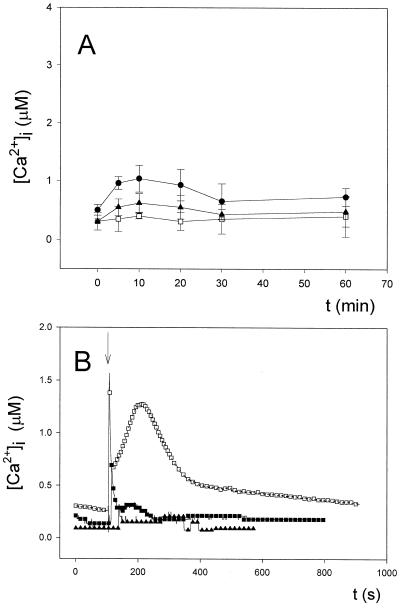
In the first case, cells placed in a luminometer cuvette were heat-shocked at 44°C for periods up to 60 min in a thermostated water bath, and cuvettes were removed at specific times to monitor luminescence (Fig. 6A). As shown in the figure, continued heat shock treatment caused a significant increase in [Ca2+]i that lasted more than 30 min and approached basal levels very slowly. Its magnitude increased from around 1.14 ± 0.17 μm after 2 min, to reach a maximum of 3.10 ± 0.25 μm (n = 15) after 20 min (see Fig. 6A). After that time, no further increases in [Ca2+]i were observed; in fact, a gradual decrease to about 1.22 ± 0.59 μm occurred after 60 min (n = 15). To monitor the actual temperature of the cell suspensions in the water bath throughout the experiment and the temperature fluctuations in the cuvettes during the 15 to 20 s of luminescence measurement, thermocouples were introduced into blank cuvettes containing equal volumes and cell densities as those used for the luminescence assays, and temperatures were recorded continuously.
Figure 6.
Changes in [Ca2+]i in response to heat shock. A, Continued heat shock treatment (up to 60 min) in a water bath at 44°C of coelenterazine-treated cells (▪). Cuvettes were removed from the water bath at specific times to monitor luminescence as described in “Materials and Methods.” Cells maintained in a water bath at 28°C were taken as the control (□). Measurements were made maintaining an external Ca2+ concentration of 0.25 mm. B, Coelenterazine-treated cells were heat-shocked by injecting hot water at 65°C to achieve a final temperature of 44°C in the cuvette and luminescence recorded as described in “Materials and Methods” (▪). Cells irrigated with water at 28°C were taken as the control (□). Measurements were made maintaining an external Ca2+ concentration of 0.25 mm. Experiments were repeated 15 times and the error bars represent ±se (A). Experiments were repeated 15 times, and the traces represented have been chosen to best represent the average result (B). The vertical arrow in B indicates the injection of hot water.
Using these thermocouples, it took around 5 min for the cell suspension to achieve 44°C, indicating that in a water bath, heating of the sample is a slow process. The temperature fluctuations in the cuvette during the 15 to 20 s of luminescence measurement was only 1°C and lasted around 50 s (by 100 s, the temperature had decreased around 3°C) (not shown). Thus, during the 15 to 20 s measurement in the luminometer, the temperature change is very small (only 1°C). Nonetheless, to determine whether this small decrease in temperature at such a specific rate could be responsible for the observed Ca2+ transient, we measured the effect of cooling at that same rate from 28°C (regular growth temperature of Anabaena cells) to 27°C, 26°C, and 25°C and found no observable intracellular Ca2+ increase (not shown). Therefore, these measurements truly reflect a Ca2+ response to heat shock. During the course of the experiment, we did not observe cell lysis.
When heat shock was applied by irrigation of cell suspensions with hot water at temperatures up to 65°C to allow the temperature of the cell suspensions to immediately increase from 28°C to 44°C, the nature of the Ca2+ transient was different: injected hot water triggered two contiguous phases of Ca2+ release that lasted for a total of about 3 min (Fig. 6B). The peak [Ca2+]i concentration was approximately 0.80 ± 0.14 μm for the first pulse and 0.98 ± 0.18 μm (n = 15) for the second. The first phase was very short and the second was bell-shaped, accounting for over 90% of the total duration of the transient. The control (the addition of water at 28°C) did not elicit such a response, although a much smaller Ca2+ transient in magnitude (peak height of 0.40 ± 0.10 μm [n = 6]) and duration (approximately 20 s) was observed. To rule out that this small transient could be due to a hypoosmotic shock caused by water, we injected growth medium (BG11) both at 65°C and at 28°C and essentially found the same results as those obtained with water (not shown). This small transient could therefore represent a small mechanically induced Ca2+ increase.
Thermocouples introduced into blank cuvettes were also used to measure the temperature changes after direct irrigation with hot water or hot growth medium. We found that the actual temperature at the peak of the first phase of the Ca2+ transient (observed 2–3 s after irrigation) was already 44°C, so the change in temperature from 28°C to 44°C is almost instantaneous. Also, the actual temperature at the peak of the second, bell-shaped Ca2+ transient (observed around 50 s from the irrigation) was 42°C, and only after 100 s did the temperature decrease approximately 4°C to 40°C (not shown). As in the water bath experiment, we also checked whether those small decreases in temperature would account for the observed Ca2+ transients and found that cooling Anabaena cells from 28°C to 27°C, 26°C, and 25°C at that specific rate did not induce any observable intracellular Ca2+ increase (not shown). Thus, the observed biphasic Ca2+ transient might correspond to a sudden rise in temperature. Cell lysis was not observed.
The described heat shock experiments were performed with an external Ca2+ concentration of 0.25 mm (the standard Ca2+ concentration of the medium). An increase in the external Ca2+ did not provoke a concomitant increase in [Ca2+]i in either case (data not shown). Control experiments to test the stability of recombinant aequorin to heat treatment showed that the total luminescence signal remained unchanged at 44°C, although at temperatures of 50°C and over, 40% of the signal was lost. Recombinant aequorin was therefore stable to high temperatures (up to 44°C), and we believe that the changes shown in Figure 6 represent true changes in cytosolic free Ca2+.
Intracellular Free Ca2+ Levels in Response to Cold Shock
As indicated in “Materials and Methods,” cold shock was applied either by immersing cell suspensions in a water bath at 0°C or by directly irrigating with cold water.
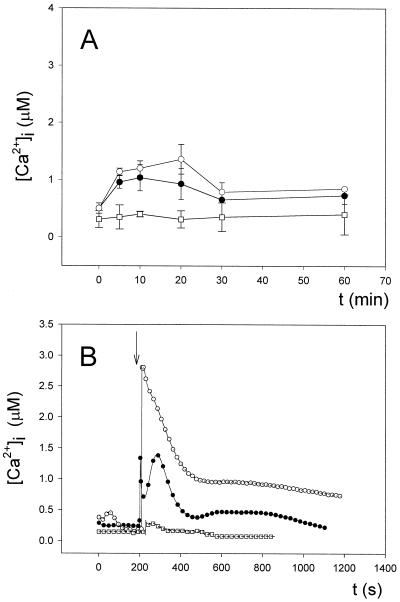
In the first case, cell suspensions placed in luminometer cuvettes were immersed into a water bath at 0°C, removed at specific times, and luminescence recorded. Continued cold shock, applied in this way for up to 60 min, provoked a much smaller increase in [Ca2+]i than continued heat shock with a maximum magnitude of 1.04 ± 0.23 (n = 8) after 10 min (Fig. 7A). The continued cold-shock-induced Ca2+ transient was also shorter in duration than the continued heat-shock-induced Ca2+ transient. We found that when cells were incubated in the presence of higher external Ca2+ concentrations (5 mm as shown in Fig. 7A), there was a significant (Student's t test, P < 0.1) elevation in the Ca2+-induced transient. This result was the opposite of that found with heat shock, after which higher external Ca2+ concentrations did not exert any significant effect. Thermocouples introduced into blank cuvettes showed that the cell suspensions reached a temperature of 10°C after 5 min in the water bath at 0°C and that by 10 min, the temperature of the cell suspension decreased even further to 5°C (not shown). No cell lysis was observed at the end of the experiment.
Figure 7.
Changes in [Ca2+]i in response to cold shock. A, Continued cold-shock treatment (up to 60 min) in a water bath at 0°C of coelenterazine-treated cells incubated with increasing external Ca2+ concentrations (○, 5 mm Ca2+; ●, 0.25 mm Ca2+). Cuvettes were removed from the water bath at specific times to monitor luminescence as described in “Materials and Methods.” Cells maintained in a water bath at 28°C were taken as the control (□). B, Coelenterazine-treated cells incubated with increasing external Ca2+ concentrations (○, 1 mm Ca2+; ●, 0.25 mm Ca2+) were cold-shocked by injecting ice-cold water to achieve a final temperature of 10°C in the cuvette and luminescence recorded as described in “Materials and Methods.” Cells irrigated with water at 28°C were taken as the control (□). Experiments were repeated eight times and error bars represent ±se (A). Experiments were repeated eight times, and the traces represented have been chosen to best represent the average result (B). The vertical arrow in B indicates the injection of cold water.
Cold shock applied by irrigation with ice-cold water induced two well-defined Ca2+ transients (Fig. 7B). The first Ca2+ transient was biphasic, showing two contiguous phases of Ca2+ release that lasted for a total of 3 to 4 min, and was very similar to that found after heat shock by irrigation (Fig. 6B). The second Ca2+ transient was slower and smaller in magnitude, lasting around 7 to 8 min. This second Ca2+ transient after cold shock is a clear difference from that induced by heat shock, since it was never observed under the latter conditions. For the biphasic Ca2+ transient, the peak Ca2+ concentration was approximately 1.27 ± 0.22 μm for the first phase and approximately 1.36 ± 0.16 μm (n = 8) for the second phase. The first phase was very short and the second bell-shaped phase accounted for over 90% of the total duration of the transient. The peak height concentration for the second, slower transient was around 0.67 ± 0.11 μm (n = 8). The control, the addition of water at 28°C, did not elicit such an increase in [Ca2+]i, although, as already described for heat shock, a much smaller Ca2+ transient in magnitude (peak height of approximately 0.40 ± 0.10 μm [n = 6]) and duration (approximately 20 s) was observed. To rule out that this small transient could be due to a hypoosmotic shock caused by water, we injected growth medium (BG11) both at 0°C and at 28°C and essentially found the same results as those obtained with water (not shown). This small transient could, as indicated before, represent a small, mechanically induced Ca2+ increase.
Thermocouples introduced into blank cuvettes showed that the actual temperature at the peak of the first phase of the biphasic Ca2+ transient (observed 2–3 s after irrigation) was 12°C, so the change in temperature from 28°C to 12°C was almost instantaneous. Furthermore, the actual temperature at the peak of the second phase (observed around 100 s after the injection of cold water or growth medium) was 16°C. At the beginning of the second, slower transient, the temperature was around 19°C, still 9°C below room temperature (28°C) (not shown). Thus, the observed biphasic Ca2+ transient corresponds to a sudden drop in temperature. Cold shock by irrigation also did not provoke cell lysis. As already seen with continued cold shock, cold shock by irrigation after pretreatment with higher external Ca2+ concentrations (1 mm, as shown in Fig. 7B), unlike heat shock, induced marked elevations of both the biphasic and the slower Ca2+ transient. These results clearly show a strong dependence between [Ca2+] in the external medium and the response of the cell to both types of cold shock (Fig. 7).
Control experiments to test the stability of recombinant aequorin to cold treatment showed that the total luminescence signal remained unchanged (not shown). Thus, we believe that the data reflect genuine changes in cytosolic Ca2+ in response to cold shock.
Possible Cellular Origin for the Heat- and Cold-Shock-Induced Increase in [Ca2+]i
To explore the source of the Ca2+ for the increased [Ca2+]i under heat and cold shock, additional experiments were carried out in the absence of added Ca2+ in the medium, with EGTA (zero external Ca2+) and with the Ca2+ channel blocker verapamil. Inhibitors were added after reconstitution with coelenterazine, and the cultures were incubated in inhibitor for the times indicated in the figures.
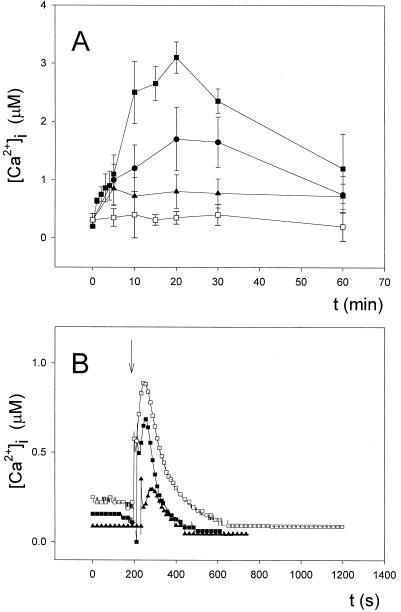
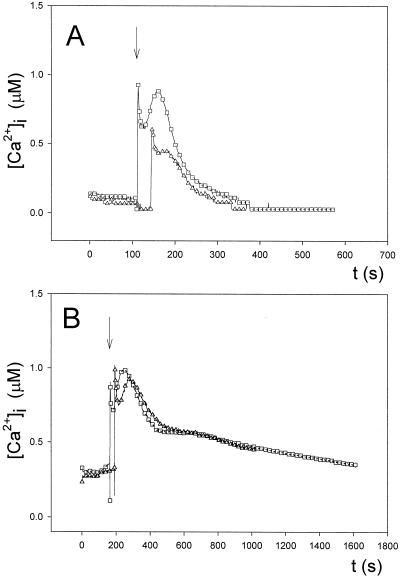
When cell suspensions incubated in the absence of added external Ca2+ were heat-shocked in a water bath at 44°C for periods up to 60 min, a [Ca2+]i elevation was observed that, like the control, peaked around 20 min from the beginning of the heat shock; however, the observed Ca2+ transient was clearly lower in magnitude compared with the control (after 20 min of heat shock, approximately 1.70 ± 0.54 μm [n = 10] versus 3.10 ± 0.25 [n = 10]). The Ca2+ chelator EGTA (zero external Ca2+) induced a significant (Student's t test, P < 0.05), although much smaller, [Ca2+]i transient (maximum value of 0.81 ± 0.29 [n = 10]). These results strongly suggest that both extracellular and intracellular sources contribute to the increase in [Ca2+]i caused by heat shock applied in a water bath at 44°C.
In the absence of added external Ca2+, heat shock applied by irrigation with hot water (Fig. 8B) induced a biphasic [Ca2+]i transient with kinetics very similar to those of the control but smaller in magnitude: a first peak height of approximately 0.58 ± 0.13 μm (n = 10) versus approximately 0.80 ± 0.14 μm in the control culture, and a second peak height of approximately 0.71 ± 0.18 μm (n = 10) versus approximately 0.98 ± 0.18 μm in the control culture. The Ca2+ chelator EGTA induced a somewhat smaller [Ca2+]i transient, with peak heights of approximately 0.43 ± 0.09 and 0.35 ± 0.09 μm (n = 10) for the first and second phase, respectively, and were shorter in duration, too. Thus, the response to heat shock by irrigation also involves Ca2+ release from intracellular stores.
Figure 8.
Effect of external Ca2+ depletion on the heat-shock-induced changes in [Ca2+]i. A, Heat shock applied in a water bath at 44°C up to 60 min. ▪, 0.25 mm Ca2+; ●, 0 mm Ca2+; ▴, 1 mm EGTA; □, control (28°C, 0.25 mm Ca2+). B, Heat shock applied by irrigation with hot water. □, 0.25 mm Ca2+ out; ▪, 0 mm Ca2+ out; ▴, 1 mm EGTA. These experiments were repeated 10 times, and the traces represented have been chosen to best represent the average result. The vertical arrow in B indicates the injection of hot water.
The situation is quite different regarding cold shock (Fig. 9). Continued cold shock in a water bath of cells incubated with EGTA (zero external Ca2+) did not induce a significant (Student's t test, P < 0.05) Ca2+ transient, indicating that extracellular sources are mostly involved in the observed Ca2+ increase. In the absence of added external Ca2+, cold shock applied by irrigation with ice-cold water induced a very small [Ca2+]i transient compared with the control (peak height of approximately 0.38 ± 0.10 μm [n = 6]). The kinetics were also totally different, since the induced transient was not biphasic and was shorter in duration. The Ca2+ chelator EGTA severely limited the capacity of cold shock to increase [Ca2+]i; in fact, its levels remained nearly basal. Thus, after cold shock by irrigation, it appears that the increased [Ca2+]i observed arises, as in the case of continued cold shock in a water bath, mainly from extracellular sources.
Figure 9.
Effect of external Ca2+ depletion on the cold-shock-induced changes in [Ca2+]i. A, Cold shock applied in a water bath at 0°C up to 60 min. ●, 0.25 mm Ca2+; ▴, 1 mm EGTA; □, control (28°C, 0.25 mm Ca2+). B, Cold shock applied by irrigation with ice-cold water. □, 0.25 mm Ca2+ out; ▪, 0 mm Ca2+ out; ▴, 1 mm EGTA. These experiments were repeated six times, and the traces represented have been chosen to best represent the average result. The vertical arrow in B indicates the injection of cold water.
Figure 10 shows the effect of the Ca2+-channel blocker verapamil on heat- and cold-shock-mediated [Ca2+]i increases, respectively. Verapamil significantly (Student's t test, P < 0.05) lowered the observed elevation of [Ca2+]i under heat shock: a first peak height of 0.55 ± 0.15 μm versus 0.76 ± 0.15 μm [n = 6] of the control, and a second peak height of 0.51 ± 0.18 μm versus 0.84 ± 0.16 μm (n = 6) of the control. However, it did not have the same effect on the Ca2+ transient induced by cold shock (Student's t test; P > 0.50): a first peak height of the biphasic transient of 1.07 ± 0.18 μm versus 1.02 ± 0.14 μm (n = 6) of the control; a second peak height of the biphasic transient of 1.10 ± 0.11 μm versus 1.04 ± 0.17 μm (n = 6) of the control. The peak height of the second, slower transient was of 0.63 ± 0.10 μm versus 0.62 ± 0.09 μm of the control). These results suggest that the influx of Ca2+ needed to induce the Ca2+ transient following heat shock may occur through verapamil-sensitive Ca2+ channels, while influx of Ca2+ due to cold shock probably occurs through a different type of Ca2+ channel.
Figure 10.
Effect of plasma membrane Ca2+ channel blocker verapamil on heat (A) or cold shock (B) induced changes in [Ca2+]i. Cells were preincubated with 200 μm verapamil for 30 min prior to heat or cold shock treatment (▵). These experiments were repeated six times and the traces represented have been chosen to best represent the average result. The vertical arrows indicate the injection of hot (A) or cold (B) water. □, Control.
DISCUSSION
We report here, for the first time to our knowledge, the construction of a strain of cyanobacteria that constitutively expresses the apoaequorin gene. Functional recombinant aequorin can be successfully reconstituted upon addition of the hydrophobic luminophore coelenterazine. The Ca2+-sensitive luminescent protein is expressed in cell suspensions of Anabaena at sufficient high levels to allow an accurate calibration of the luminescence data into [Ca2+]i values (Figs. 1 and 2). With regard to the calibration procedure, our results agree with previous observations (Brini et al., 1995) that recombinant aequorin is as sensitive as native aequorin (Allen et al., 1976) to Ca2+ changes, since the dose response curve begins at around 100 nm free Ca2+ and is saturated well above 10 μm free Ca2+ (Fig. 1). Calibration curves should be determined at the temperatures corresponding to that of the experiment, since warming or cooling may have an effect on the luminescent reaction (Fig. 1; Blinks et al., 1982).
The maintenance of a low intracellular free Ca2+ concentration is required not only to protect the cell from the toxic effects of Ca2+, but also to permit the use of Ca2+ as a second messenger: any increase in the free [Ca2+]i due to the propagation of a signal must disappear quickly in order for the next signal to occur. Such regulation is accomplished by a complex of processes collectively called the “Ca2+ homeostat,” which has been mostly studied in eukaryotes (Carafoli, 1987; Bush, 1995).
To assign a regulatory role for Ca2+ in cyanobacteria, we thought it necessary to undertake a study of the functioning of the Ca2+ homeostat in our recombinant strain. We recorded the response of Anabaena cells to increasing external Ca2+ concentrations and assayed the effect of several Ca2+-signaling compounds. Anabaena sp. strain PCC7120 sensed and responded rapidly to an increase in the external Ca2+ concentration (Fig. 2). The induced Ca2+ transient was very short, indicating a quick removal of free Ca2+ from the cytoplasm to maintain the steady-state concentration very low (between 100 and 200 nm). Thus, Anabaena seems to be able to tightly regulate its internal free Ca2+ levels. The Ca2+ ionophore calcimycin (compound A23187) induced a larger Ca2+ transient, while the Ca2+ chelator EGTA abolished it (Fig. 3), indicating that the influx of Ca2+ from the extracellular space occurred to induce such Ca2+ transients.
The results with the plasma membrane Ca2+ channel blocker verapamil showed, however, that influx was not due to the opening of verapamil-sensitive Ca2+ channels (Fig. 4A). The other Ca2+ channel blocker, La3+ provoked an uncontrolled rise of [Ca2+]i when cells were challenged with increasing external Ca2+ concentrations (Fig. 4B). However, the data with La3+ should be taken with caution since, in our lysate assay, we found that La3+ at 1 mm (although not at 100 μm) largely stimulated aequorin luminescence. This effect has already been described by Blinks et al. (1982). Nevertheless, we believe that our data with 100 μm La3+ truly reflects an effect of the ion on Ca2+ levels. The other clear evidence that we get from the lysate assay and the in vivo assay (Fig. 4B) is that La3+ may be entering the cyanobacterial cells and exert its effect intracellularly. In fact, there is evidence that lanthanides can enter eukaryotic cells (Quiquampoix et al., 1990).
In cyanobacteria, it has been found, using 45Ca2+, that La3+ increases the concentration of intracellular Ca2+ between 2- and 3-fold, and this was attributed to increased Ca2+ influx (Smith, 1988). That author suggested that La3+ may enter cells and, by disrupting Ca2+-protein interactions, may lead to the observed effect on Ca2+ uptake. We believe that, rather than affecting Ca2+ uptake, La3+, once inside the cell, may inhibit Ca2+ efflux systems such as Ca2+/nH+ antiporters and Ca2+ ATPases, impairing the homeostasis of Ca2+ and thus giving rise to the observed high levels of intracellular Ca2+. In fact, La3+ is not an specific inhibitor of voltage-operated Ca2+ channels, and in a variety of environmental systems has been found to block Ca2+ pumps, Ca2+ exchangers, and K+ channels (Bush, 1995; Lewis and Spalding, 1998).
The results with the calmodulin inhibitor TFP (Fig. 5A) suggest that Ca2+ binding proteins may play an important role in the rapid reestablishment of the resting levels of [Ca2+]i. Ca2+ efflux by Ca2+ exchangers also appear to contribute to restoration of the steady-state free Ca2+ concentrations, as evidenced by the effect of the Ca2+-exchanger-inhibitor diltiazem (Vaghy et al., 1982; Rizzuto et al., 1987; Brini et al., 1995).
Most of the studies on the regulation of intracellular free Ca2+ levels have been in eukaryotes, and very little is as yet known about real levels of intracellular free Ca2+ in bacteria and how these levels change in response to external stimuli. In fact, in prokaryotes, most if not all of the available data comes from Escherichia coli. Using Fura-2 fluorescence and 45Ca2+, Gangola and Rosen (1987) found that E. coli is able to maintain resting levels of free [Ca2+]i comparable to that of eukaryotic cells. Using recombinant aequorin for the first time in a prokaryotic cell, Knight et al. (1991b) reported that a variety of conditions promote a brief increase in the free [Ca2+]i in E. coli and confirmed the low levels of intracellular free Ca2+ in a steady-state situation (around 100 nm) found by Gangola and Rosen (1987). The fact that a photosynthetic bacterium such as Anabaena also maintains a low level of [Ca2+]i and that this concentration is tightly regulated even when cells are challenged with high external Ca2+ concentrations favors the idea that Ca2+-mediated regulation may be a general feature of prokaryotic organisms.
Ca2+ has been shown to respond to environmental variables in plant cells (Knight et al., 1991a, 1992, 1996; Chandra and Low, 1997; Takahashi et al., 1997; Gong et al., 1998), and there is increasing evidence that the same might be true for cyanobacteria (Smith, 1995; Norris et al., 1996; Giraldez-Ruiz et al., 1997, 1999). In this context, we were interested in determining whether Ca2+ was involved in signaling of heat and cold shock, because little is known about the initial perception of both environmental stresses in cyanobacteria since most of the studies have dealt with environmental-stress-induced modifications of protein synthesis (Borbely et al., 1985; Nicholson et al., 1987; Bhagwat and Apte, 1989). To study Ca2+ involvement and to elucidate whether the cell response varies according to the specific way of inducing the shock, we applied heat and cold shock in two different ways: (a) cells were placed in cuvettes and immersed in water baths at the appropriate temperature, allowing for continuous heat or cold shock (in this method, cells did not come into contact with hot or cold water); (b) water was injected directly into the sample, resulting in an almost instantaneous change of temperature (in this method, cells came into contact with hot or cold water).
We found that continuous heat shock induced [Ca2+]i transients with a maximum magnitude after 20 min of heat shock; after this time, [Ca2+]i gradually returned to resting levels even when heat shock continued to 60 min (Fig. 6B). Surprisingly, our results are almost the same as those found by Gong et al. (1998) using young tobacco seedlings. These authors suggested that refractory periods when a shock is continuously applied (Knight et al., 1991a, 1992, 1996) prevent cells from damage that would be caused by a prolonged increase in [Ca2+]i, which is known to be cytotoxic. Unlike the results of Knight et al. (1991b) and Gong et al. (1998), who reported that irrigation of tobacco seedlings with hot water did not induce detectable changes in luminescence, we found that a biphasic Ca2+ transient was originated when the shock was applied by irrigation (Fig. 6C).
Continued cold shock in a cold water bath elicited a Ca2+ transient that was significantly smaller in magnitude and duration than the one obtained under continued heat shock (Fig. 7A), indicating that Ca2+ changes after a slow decrease in temperature are not so strong as those following a slow increase in temperature. Irrigation of the cell suspension with cold water induced two Ca2+ transients: a biphasic Ca2+ transient with similar kinetics to that obtained with irrigation with hot water, and a second, slower Ca2+ transient (Fig. 7B) that never appeared under heat shock by irrigation. These data suggest that cyanobacterial cells distinguish between these two different ways of inducing heat or cold shock. Also, the fact that irrigation with cold or hot water induces a similar Ca2+ transient might indicate that the cells are sensing a sudden change in temperature, and may discriminate between cold and heat shock by the appearance of that second Ca2+ transient.
A clear difference between both shocks comes from the source of Ca2+ involved in the induction of the Ca2+ transient. The results in the absence of added external Ca2+ and those using the Ca2+ chelator EGTA (zero external Ca2+) indicate that the increased [Ca2+]i observed during heat shock arises from both extracellular and intracellular spaces (Fig. 8), while that of cold shock arises mainly from the extracellular space (Fig. 9). The fact that an increase in extracellular Ca2+ increases the Ca2+ transients induced by cold shock, while after heat shock, an increase of extracellular Ca2+ does not result in a concomitant increase in [Ca2+]i supports the above. The data with the plasma membrane Ca2+ channel blocker verapamil (Fig. 10) indicate that the influx of Ca2+ from the extracellular space after heat shock may occur through a different type of Ca2+ channel than that after cold shock.
A major question remains regarding the intracellular stores of Ca2+ in cyanobacteria. Cytoplasmic Ca2+ chelation by Ca2+-binding proteins could probably complex a significant portion of the total cell Ca2+. Polyphosphate bodies contain significant amounts of K+, Mg2+, and Ca2+ (Jensen et al., 1982) that would meet the needs of cells for these essential metals; however, it is not clear whether Ca2+ can easily be mobilized from such bodies when the propagation of a Ca2+ signal is needed. We present direct evidence that Ca2+ signaling exists in cyanobacteria, but we believe that further research is required to determine the extent of Ca2+-mediated regulation in this relevant group of prokaryotes that, according to the endosymbiotic theory, are phylogenetically and physiologically related to the chloroplast and thus may serve as a model for the photosynthetic eukaryotes.
MATERIALS AND METHODS
Organism and Growth Conditions
The recombinant strain of Anabaena strain sp. PCC7120 expressing apoaequorin was routinely grown in BG11 medium buffered with 25 mm 4-(2-hydroxyethyl)-1-piperazineethanesulfonic acid (HEPES), pH 7.2 (Rippka et al., 1979), at 28°C on a rotary shaker under a constant irradiance of 100 μmol m−2 s−1. The strain was supplemented when grown in liquid cultures with 2.5 μg spectinomycin dihydrochloride mL−1.
Construction of the Apoaequorin Expression Vector for Anabaena Strain sp. PCC7120
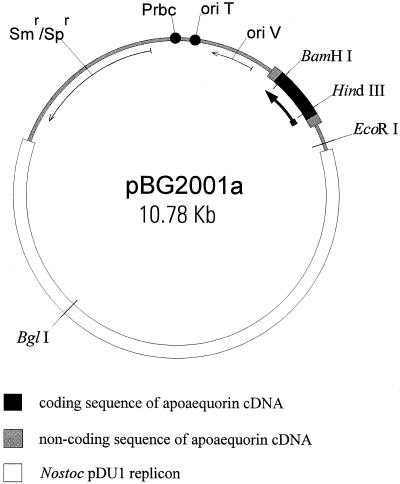
A fragment of 0.78 Kb containing the apoaequorin (aaeq) cDNA was cut with PstI and KpnI from plasmid pSV0AQ (Tanahashi et al., 1990) and ligated into the PstI and KpnI sites of plasmid pBluescript SK+ (Stratagene Cloning Systems, San Diego), generating pBG2000. From pBG2000, the 0.78-Kb fragment with the apoaequorin cDNA could be easily excised with Asp718 and SmaI; after Klenow treatment, the fragment was ligated to pRL1404 (Fernandez-Piñas et al., 1994) cut with SmaI, creating the expression vector pBG2001 (Fig. 11) that can replicate in Anabaena strain sp. PCC7120. The apoaequorin gene is oriented to be transcribed from a promoter within the Nostoc replicon pDU1 (Walton et al., 1992). This promoter has been widely used in filamentous cyanobacteria to promote expression of several genes (Fernandez-Piñas and Wolk, 1994; Fernandez-Piñas et al., 1994; Maldener et al., 1994). Plasmid pBG2001 was introduced into Anabaena strain sp. PCC7120 by conjugation (Wolk et al., 1984; Elhai and Wolk, 1988).
Figure 11.
Physical map of the apoaequorin expression vector pBG2001a. Only positions of relevant restriction sites are indicated. The thick black arrow indicates the direction of transcription of the apoaequorin gene.
In Vivo Reconstitution of Apoaequorin
In vivo reconstitution of apoaequorin was carried out by adding coelenterazine in methanol to a cell suspension (at a cell concentration of 15 μg chlorophyll mL−1) to reach a final concentration of 2.5 μm, and incubating the cells for 4 h in the dark. Before Ca2+ measurements were made, cells were washed twice in BG11 medium buffered with 25 mm HEPES, pH 7.2, containing 0.5 mm EGTA to remove the excess coelenterazine.
Aequorin Luminescence Measurements
Aequorin light emission was measured using a digital luminometer (Bio Orbit 1250, Turku, Finland). The luminometer was calibrated by setting the background counts to 0 and a 0.26 μCi of 14C internal standard to 10 mV. Coelenterazine-treated cultures (0.5 mL) were transferred to a luminometer cuvette and luminescence was recorded every 1 s for the duration of the experiment. At the end of the experiment, the remaining reconstituted aequorin was estimated by discharging with the addition of an equal volume of 100 mm CaCl2 and 5% (v/v) Triton X-100.
In Vitro Reconstitution of Apoaequorin and Quantitation of Intracellular Ca2+ Concentrations
In vitro calibration of recombinant apoaequorin was made by exposing cell lysates of apoaequorin-expressing cells to solutions with known Ca2+ concentrations. For this purpose, the apoaequorin-expressing Anabaena strain sp. PCC7120 strain was grown in BG11 medium plus 2.5 μg spectinomycin dihydrochloride mL−1, washed, and resuspended in a buffer solution containing 0.5 mm EGTA, 10 mm HEPES/NaOH (pH 7.2), and 0.8 mm paramethylsulfoxide, and lysed in a French press (140 MPa). After centrifuging at 23,000g for 10 min at 4°C, the cell pellet was discarded. The supernatant (cell lysate) was utilized for the experiments after reconstituting apoaequorin with 5 μm coelenterazine for 4 h in the presence of 5 mm β-mercaptoethanol, as described previously (Shimomura et al., 1990). The Ca2+ buffers used were the Ca2+ calibration kits no. 2 and no. 3 (C-3009 and C-6775, respectively, Molecular Probes Europe, Leiden, The Netherlands). Kit no. 2 provides the following free Ca2+ concentrations: 0, 0.017, 0.038, 0.065, 0.100, 0.150, 0.225, 0.351, 0.602, 1.35, and 39.8 μm. Kit no. 3 provides the following free Ca2+ concentrations: 0, 1.35, 2.85, 5, 10, 20, 30, 50, 75, 100, and 1,000 μm. In the experiment, 50 μL of the cell lysate at 28°C was added to a luminometer cuvette and transferred to the sample chamber of the luminometer, light emission recording was started, and 950 μL of the Ca2+ buffer at 28°C was injected in the chamber. After approximately 1 min, 100 μL of a 100 mm CaCl2 solution was injected and recording was continued until all aequorin was consumed; i.e. until light emission returned to basal values. Based on the experimental data, the recombinant aequorin calibration curve at 28°C was obtained as explained in the text. The in vitro calibration of recombinant apoaequorin was also made at 44°C and at 10°C; both the cell lysate and the Ca2+-EGTA buffers were maintained at such temperatures before and during luminescence measurements.
Heat Shock Treatments of Apoaequorin-Expressing Anabaena Cells
Heat shock was induced in two different ways. In the first, reconstituted cell suspensions were placed in luminometer cuvettes that were immersed in a water bath at 44°C and removed at specific times to monitor luminescence. At the end of the experiment, aequorin was completely discharged by cell lysis and the addition of a saturating Ca2+ concentration in the luminometer. In the second method of inducing heat shock, reconstituted cell suspensions were placed in a cuvette in the luminometer chamber and directly irrigated at temperatures up to 65°C to achieve a final temperature of 44°C by injecting 0.5 mL of hot water or hot BG11 medium in the cuvette via a light-tight 1-mL syringe inserted into a light-tight port in the luminometer sample housing. Changes in luminescence were then instantaneously recorded. At the end of the experiment, the remaining aequorin was completely discharged as already described.
Intracellular free Ca2+ concentrations were calculated from the luminescence data according to our calibration curve at 44°C, as explained in the text.
Cold Shock Treatments of Apoaequorin-Expressing Anabaena Cells
Cold shock was induced in two different ways. In the first, reconstituted cell suspensions were placed in luminometer cuvettes immersed into a water bath at 0°C, and removed at specific times to monitor luminescence. At the end of the experiments, aequorin was completely discharged as already described. In the second method, reconstituted cell suspensions were placed in a cuvette in the luminometer chamber and directly irrigated at 0°C to achieve a final temperature of around 10°C by injecting 0.5 mL of ice-cold water or ice-cold BG11 medium in the cuvette via a light-tight 1-mL syringe inserted into a light-tight port in the luminometer sample housing. Changes in the luminescence were then instantaneously recorded. At the end of the experiment, the remaining aequorin was completely discharged as already described.
Intracellular free Ca2+ concentrations were calculated from the luminescence data according to our calibration curve at 10°C, as explained in the text.
Extracellular Ca2+, Ca2+ Chelator, Ca2+ Agonist, and Inhibitor Treatment
When CaCl2, EGTA, LaCl3, verapamil, trifluoperazine (TFP), calcimycin (compound A23187), and diltiazem were used, aequorin reconstitution was performed as described above, followed by the incubation with the above-mentioned chemicals at the concentrations and times indicated in the figure legends. After the incubation time, treated cells were challenged with increasing external Ca2+ concentrations or were heat or cold shocked and used for luminescence measurements. For these treatments, stock solutions of CaCl2, EGTA, LaCl3, TFP, and diltiazem were made by dissolving these compounds in water at 10, 10, 10, 1, and 50 mm, respectively. Stock solutions of verapamil and calcimycin (compound A23187) were made by dissolving these compounds in ethanol at 200 and 10 mm, respectively; in the latter case, the amount of ethanol that was present in the assay at the highest concentration of inhibitor added was never above 1‰ to 2‰.
To determine the response of aequorin to each of the inhibitors and to the solvent used for verapamil and calcimycin (ethanol at final concentrations of 1‰-2‰), cell lysates of the apoaequorin-expressing Anabaena strain sp. PCC7120 were reconstituted with coelenterazine, as already described, and aliquots of 0.5 mL were treated with the inhibitors at the same concentrations and times as those used for the in vivo treatments. After the treatments, the aliquots were taken to the luminometer chamber, and aequorin was completely discharged by adding an equal volume of 100 mm CaCl2 to determine the total light output. From all of the tested compounds (including the solvent), only 1 mm La3+ directly stimulated the luminescence in the lysate assay (see “Results”).
Stability Test of Recombinant Aequorin to Heat and Cold Treatment
To test the stability of recombinant aequorin to heat and cold treatment, cell lysates of apoaequorin-expressing Anabaena strain sp. PCC7120 were reconstituted with coelenterazine as described above, and aliquots of 1 mL were cold or heat shocked for different times. After the treatment, the aliquots were taken to the luminometer chamber and aequorin was completely discharged by adding an equal volume of 100 mm CaCl2 to determine the total light output.
Cell Lysis Check
For each of the treatments used in the present work, the occurrence of cell lysis was checked by the following methods: (a) examination by optical microscopy; (b) measurements of luminescence after addition of Ca2+ to the medium in which reconstituted cells were present after removing the cells by centrifugation; (c) measurement of phycobiliproteins in the medium in which reconstituted cells were present after removing the cells by centrifugation.
ACKNOWLEDGMENTS
We thank Dr. Yoshiyuki Sakaki (The Institute of Medical Science, the University of Tokyo) for the gift of plasmid pSV0AQ containing apoaequorin cDNA. We are also grateful to Dr. O. Shimomura (Marine Biological Laboratory, Woods Hole, MA) for his generous gift of coelenterazine.
Footnotes
This work was supported by Direccion General de Ensen̄anza Superior (grant nos. PB96–0487 and PB98–0114–CO2–01). I.T. holds a fellowship from Comunidad Autonoma de Madrid.
LITERATURE CITED
- Allen DG, Blinks JR. Calcium transients in aequorin-injected frog cardiac muscle. Nature. 1978;273:509–517. doi: 10.1038/273509a0. [DOI] [PubMed] [Google Scholar]
- Allen DG, Blinks JR, Prendergast FG. Aequorin luminescence: relation of light emission to calcium concentration, a calcium-independent component. Science. 1976;195:996–998. doi: 10.1126/science.841325. [DOI] [PubMed] [Google Scholar]
- Bhagwat AA, Apte SK. Comparative analysis of proteins induced by heat-shock, salinity, and osmotic stress in the nitrogen-fixing cyanobacterium Anabaena sp. strain L-31. J Bacteriol. 1989;171:5187–5189. doi: 10.1128/jb.171.9.5187-5189.1989. [DOI] [PMC free article] [PubMed] [Google Scholar]
- Blinks JR, Wier WG, Hess P, Prendergast FG. Measurement of Ca2+ concentrations in living cells. Prog Biophys Mol Biol. 1982;40:1–114. doi: 10.1016/0079-6107(82)90011-6. [DOI] [PubMed] [Google Scholar]
- Borbely G, Suranyi G, Korcz A, Palfi Z. Effect of heat shock on protein synthesis in the cyanobacterium Synechococcus sp. strain PCC6301. J Bacteriol. 1985;161:1125–1130. doi: 10.1128/jb.161.3.1125-1130.1985. [DOI] [PMC free article] [PubMed] [Google Scholar]
- Brini M, Marsault TR, Bastianutto C, Alvarez J, Pozzan T, Rizzuto R. Transfected aequorin in the measurement of cytosolic Ca2+ concentration ([Ca2+]i) J Biol Chem. 1995;270:9896–9903. doi: 10.1074/jbc.270.17.9896. [DOI] [PubMed] [Google Scholar]
- Bush DS. Calcium regulation in plant cells and its role in signaling. Annu Rev Plant Physiol Plant Mol Biol. 1995;46:95–122. [Google Scholar]
- Bush DS, Jones RL. Measuring intracellular Ca2+ levels in plant cells using the fluorescent probes indo-2 and fura-2: progress and prospects. Plant Physiol. 1990;93:841–845. doi: 10.1104/pp.93.3.841. [DOI] [PMC free article] [PubMed] [Google Scholar]
- Campbell AK. Intracellular Calcium: Its Universal Role as Regulator. Chichester, UK: John Wiley & Sons; 1983. [Google Scholar]
- Carafoli E. Intracellular calcium homeostasis. Annu Rev Biochem. 1987;56:395–433. doi: 10.1146/annurev.bi.56.070187.002143. [DOI] [PubMed] [Google Scholar]
- Chandra S, Low PS. Measurement of Ca2+ fluxes during elicitation of the oxidative burst in aequorin-trasformed tobacco cells. J Biol Chem. 1997;272:28274–28280. doi: 10.1074/jbc.272.45.28274. [DOI] [PubMed] [Google Scholar]
- Elhai J, Wolk CP. Conjugal transfer of DNA to cyanobacteria. Methods Enzymol. 1988;167:747–754. doi: 10.1016/0076-6879(88)67086-8. [DOI] [PubMed] [Google Scholar]
- Fernandez-Piñas F, Leganés F, Wolk CP. A third genetic locus required for the formation of heterocysts in Anabaena sp. strain PCC7120. J Bacteriol. 1994;176:5277–5283. doi: 10.1128/jb.176.17.5277-5283.1994. [DOI] [PMC free article] [PubMed] [Google Scholar]
- Fernandez-Piñas F, Wolk CP. Expression of lux CD-E in Anabaena sp. can replace the use of exogenous aldehyde for in vivo localization of transcription by Lux AB. Gene. 1994;150:169–174. doi: 10.1016/0378-1119(94)90879-6. [DOI] [PubMed] [Google Scholar]
- Gangola P, Rosen BP. Maintenance of intracellular calcium in Escherichia coli. J Biol Chem. 1987;262:12570–12574. [PubMed] [Google Scholar]
- Giraldez-Ruiz N, Bonilla I, Fernandez-Piñas F. Role of external calcium in homeostasis of intracellular pH in the cyanobacterium Anabaena sp. strain PCC7120 exposed to low pH. New Phytol. 1999;141:225–230. doi: 10.1046/j.1469-8137.1999.00347.x. [DOI] [PubMed] [Google Scholar]
- Giraldez-Ruiz N, Mateo P, Bonilla I, Fernandez-Piñas F. The relationship between intracellular pH, growth characteristics and calcium in the cyanobacterium Anabaena sp. strain PCC7120 exposed to low pH. New Phytol. 1997;137:599–605. doi: 10.1046/j.1469-8137.1999.00347.x. [DOI] [PubMed] [Google Scholar]
- Gong M, Van der Luit AH, Knight MR, Trewavas AJ. Heat-shock-induced changes in intracellular Ca2+ level in tobacco seedlings in relation to thermotolerance. Plant Physiol. 1998;116:429–437. [Google Scholar]
- Jensen TE, Baxter M, Rachlin JW, Jani V. Uptake of heavy metals by Plectonema boryanum (Cyanophyceae) into cellular components, especially polyphosphate bodies: an x-ray energy dispersive study. Environ Pollut. 1982;27:119–127. [Google Scholar]
- Knight H, Trewavas AJ, Knight MR. Cold calcium signaling in Arabidopsis involves two cellular pools and a change in calcium signature after acclimation. Plant Cell. 1996;8:489–503. doi: 10.1105/tpc.8.3.489. [DOI] [PMC free article] [PubMed] [Google Scholar]
- Knight MR, Campbell AK, Smith SM, Trewavas AJ. Transgenic plant aequorin reports the effects of touch and cold-shock and elicitors in cytoplasmic calcium. Nature. 1991a;352:524–526. doi: 10.1038/352524a0. [DOI] [PubMed] [Google Scholar]
- Knight MR, Campbell AK, Smith SM, Trewavas AJ. Recombinant aequorin as a probe for cytosolic free Ca2+ in Escherichia coli. FEBS Lett. 1991b;282:405–408. doi: 10.1016/0014-5793(91)80524-7. [DOI] [PubMed] [Google Scholar]
- Knight MR, Smith SM, Trewavas AJ. Wind induced plant motion immediately increases cytosolic calcium. Proc Natl Acad Sci USA. 1992;89:4967–4977. doi: 10.1073/pnas.89.11.4967. [DOI] [PMC free article] [PubMed] [Google Scholar]
- Lewis BD, Spalding DP. Nonselective block by La3+ of Arabidopsis ion channels involved in signal transduction. J Membr Biol. 1998;162:81–90. doi: 10.1007/s002329900344. [DOI] [PubMed] [Google Scholar]
- Maldener I, Fiedler G, Ernst A, Fernandez-Piñas F, Wolk CP. Characterization of devA, a gene required for the maturation of proheterocysts in the cyanobacterium Anabaena sp. strain PCC7120. J Bacteriol. 1994;176:7543–7549. doi: 10.1128/jb.176.24.7543-7549.1994. [DOI] [PMC free article] [PubMed] [Google Scholar]
- Marquardt DW. An algorithm for least squares estimation of parameters. J Soc Ind Appl Math. 1963;11:431–441. [Google Scholar]
- Nicholson P, Osborn RW, Hower CJ. Induction of protein synthesis in response to ultraviolet light, nalidixic acid and heat shock in the cyanobacterium Phormidium laminosum. FEBS Lett. 1987;221:110–114. [Google Scholar]
- Norris V, Grant S, Freestone P, Canvin J, Sheikh FN, Toth I, Trinei M, Modha K, Norman RI. Calcium signalling in bacteria. J Bacteriol. 1996;178:3677–3682. doi: 10.1128/jb.178.13.3677-3682.1996. [DOI] [PMC free article] [PubMed] [Google Scholar]
- Okazaki Y, Kikuyama M, Hiramoto Y, Iwasaki N. Short-term regulation of cytosolic Ca2+, cytosolic pH and vacuolar pH under NaCl stress in the charophyte alga Nitellopsis obtura. Plant Cell Environ. 1996;19:569–576. [Google Scholar]
- Onek LA, Smith RJ. Calmodulin and calcium mediated regulation in prokaryotes. J Gen Microbiol. 1992;138:1039–1049. doi: 10.1099/00221287-138-6-1039. [DOI] [PubMed] [Google Scholar]
- Quiquampoix H, Ratcliffe RG, Ratkovic A, Vucinic Z. 1H and 31P NMR investigation of gadolinium uptake in maize roots. J Inorg Biochem. 1990;38:265–275. [Google Scholar]
- Rippka R, Deruelles J, Waterbury JR, Herdman M, Stanier RY. Generic assignment, strain histories and properties of pure cultures of cyanobacteria. J Gen Microbiol. 1979;111:1–16. [Google Scholar]
- Rizzuto R, Bernardi P, Favaron M, Azzone GF. Pathway for Ca2+ efflux in heart and liver mitochondria. Biochem J. 1987;246:271–277. doi: 10.1042/bj2460271. [DOI] [PMC free article] [PubMed] [Google Scholar]
- Sedbrook JC, Kronebusch PJ, Borisy GG, Trewavas AJ, Masson PH. Transgenic aequorin reveals organ-specific cytosolic Ca2+ responses to anoxia in Arabidopsis thaliana seedlings. Plant Physiol. 1996;111:243–257. doi: 10.1104/pp.111.1.243. [DOI] [PMC free article] [PubMed] [Google Scholar]
- Shimomura O, Inouye A, Musicki B, Kishi Y. Recombinant aequorin and recombinant semi-synthetic aequorins. Biochem J. 1990;270:309–312. doi: 10.1042/bj2700309. [DOI] [PMC free article] [PubMed] [Google Scholar]
- Smith RJ. Calcium-mediated regulation in the cyanobacteria. In: Rogers LJ, Gallon JR, editors. Biochemistry of Algae and Cyanobacteria. Oxford: Clarendon Press; 1988. pp. 185–189. [Google Scholar]
- Smith RJ. Calcium and bacteria. Adv Microb Physiol. 1995;37:83–103. doi: 10.1016/s0065-2911(08)60144-7. [DOI] [PubMed] [Google Scholar]
- Takahashi K, Isobe M, Knight MR, Trewavas AJ, Muto S. Hypo-osmotic shock induces increases in cytosolic Ca2+ in tobacco suspension-culture cells. Plant Physiol. 1997;105:369–376. doi: 10.1104/pp.113.2.587. [DOI] [PMC free article] [PubMed] [Google Scholar]
- Tanahashi H, Takashi I, Inouye S, Tsuji FI, Sakaki Y. Photoprotein aequorin: use as a reporter enzyme in studying gene expression in mammalian cells. Gene. 1990;96:249–255. doi: 10.1016/0378-1119(90)90260-x. [DOI] [PubMed] [Google Scholar]
- Tandeau de Marsac N, Houmard J. Adaptation of cyanobacteria to environmental stimuli: new steps toward molecular mechanisms. FEMS Microbiol Rev. 1993;104:119–190. [Google Scholar]
- Vaghy PL, Johnson JD, Matlib MA, Wang T, Schwartz A. Selective inhibition of Na+-induced Ca2+ release from heart mitochondria by diltiazem and certain other Ca2+ antagonist drugs. J Biol Chem. 1982;257:6000–6002. [PubMed] [Google Scholar]
- Volotovski ID, Sokolovsky SG, Molchan OU, Knight MR. Second messengers mediate increases in cytosolic calcium in tobacco protoplasts. Plant Physiol. 1998;117:1023–1030. doi: 10.1104/pp.117.3.1023. [DOI] [PMC free article] [PubMed] [Google Scholar]
- Walton DK, Gendel SM, Atherly AG. Nucleotide sequence of the replication region of the Nostoc PCC7524 plasmid pDU1. Nucleic Acids Res. 1992;20:4660. doi: 10.1093/nar/20.17.4660. [DOI] [PMC free article] [PubMed] [Google Scholar]
- Watkins NJ, Knight MR, Trewavas AJ, Campbell AK. Free calcium transients in chemotactic and non-chemotactic strains of Escherichia coli determined by using recombinant aequorin. Biochem J. 1995;306:865–869. doi: 10.1042/bj3060865. [DOI] [PMC free article] [PubMed] [Google Scholar]
- Wolk CP, Vonshak A, Kehoe P, Elhai J. Construction of shuttle vectors capable of conjugative transfer from Escherichia coli to nitrogen-fixing filamentous cyanobacteria. Proc Natl Acad Sci USA. 1984;81:1561–1565. doi: 10.1073/pnas.81.5.1561. [DOI] [PMC free article] [PubMed] [Google Scholar]


