Abstract
Protein synthesis is critical to protein homeostasis (proteostasis), and modifications in protein synthesis influence lifespan and the development of comorbidities associated with obesity. In the present study, we examined the acute response of liver protein synthesis to either high-fat or high-sucrose diets in order to elucidate nutrient-mediated regulation of hepatic protein synthesis in the absence of body fat accumulation. Total and endoplasmic reticulum-associated protein syntheses were assessed by use of the stable isotope, deuterium oxide (2H2O), in rats provided a control diet or diets enriched in polyunsaturated fat, saturated fat, or sucrose for 2, 4, or 7 days. The three experimental diets increased hepatic triglycerides 46–91% on day 7 and fasting insulin levels 83–117% on day 7, but did not result in differences in body weight when compared with control (n = 6/diet/time). The fraction of newly synthesized proteins in total liver lysates and microsomes was not significantly different among dietary groups (n = 3/diet/time). To determine whether the experimental diets provoked a transcriptional response to enhance the capacity for protein synthesis, we also measured a panel of genes linked to amino acid transport, synthesis, and processing. There were no significant differences in any of the genes measured among groups. Therefore, dietary treatments that have been linked to impaired proteostasis and that promote hepatic steatosis and insulin resistance, did not result in significant changes in total or ER-associated protein synthesis in the liver over a 7-day period.
Keywords: proteostasis, endoplasmic reticulum, liver, steatosis, insulin resistance
protein homeostasis (proteostasis) is maintained by a network of cellular processes that broadly include protein synthesis, folding, and degradation (7, 23). Loss of, or impairments in, proteostasis have been linked to aging and multiple metabolic diseases, including obesity, diabetes, and nonalcoholic fatty liver disease (NAFLD) (2, 17, 20, 29). Disruptions in proteostasis initiate adaptive responses, including the heat shock response, mitochondrial unfolded protein response, and the endoplasmic reticulum unfolded protein response (ER UPR) (23, 41). Chronic activation of these responses, in particular, the ER UPR, can lead to inflammation, impaired insulin signaling, and cell death, all of which are hallmark characteristics of obesity, diabetes, and NAFLD (12, 16).
Translation or protein synthesis is the first process that can influence proteostasis (39). Increased protein synthesis that overburdens the processing and folding capacity of the cell can result in protein aggregates and cellular dysfunction (15, 31). Multiple studies have demonstrated that global reduction of translation or modulation in the translation of specific genes can extend lifespan (8, 9, 13, 18, 34, 39). Genetic manipulation of the translation eukaryotic translation initiation factor-2α, which prevented its phosphorylation, resulted in improved glucose tolerance and reduced hepatic steatosis in mice (32). Metabolic diseases, such as obesity, also appear to modify protein synthesis in a time-dependent and tissue-specific manner. For example, high-fat diet-induced obesity over a 9-wk period reduced meal-induced stimulation of muscle protein synthesis; however, it did not affect basal muscle protein synthesis in mice (1). Muscle protein synthesis was increased in rats exposed to a high-fat, high-sucrose diet for 16 wk. In contrast, muscle protein synthesis was reduced at 24 wk on this same diet (26). Likewise, in a mouse model of genetic obesity, the liver was characterized by increased ER-associated protein synthesis at 2 mo of age, but reduced protein synthesis at 3 and 6 mo of age (11). These data suggest that protein synthesis can be modified by diet, aging, and/or obesity, and that modifications in protein synthesis influence lifespan and comorbidities associated with obesity. It is presently unclear whether diet composition can influence protein synthesis independently of changes in body composition.
Nutrient-mediated increases in protein synthesis that challenge the proteostasis network have been observed in pancreatic β-cells. Short-term (1 h) exposure of pancreatic β-cells to high glucose concentrations increased insulin biosynthesis, whereas long-term (24 h) exposure induced the ER UPR. The saturated fatty acid palmitate increased mRNA translation and the protein load to the ER, resulting in the activation of the ER UPR (14, 24). Islets isolated from mice fed a high-fat diet for 7 days were characterized by increased polyribosome-associated RNA and activation of mammalian target of rapamycin (14). These data suggest that stimulation of protein synthesis may be a short-term response to changes in the amount or type of nutrient delivery in tissues and organs characterized by a high secretory capacity (e.g., pancreas and liver). The liver is particularly susceptible to short-term changes in nutrient delivery and diet composition; however, the short-term protein synthetic response to dietary nutrients in the liver has not been characterized (3, 21, 33, 38). Therefore, the present study examined protein synthesis in total liver lysates and microsomes in response to diets enriched in polyunsaturated fat, saturated fat, or sucrose at multiple time points over a 7-day period. These diets and timeframe were chosen because they can provoke hepatic steatosis, hepatic insulin resistance, and perturbations in hepatic proteostasis rapidly and prior to changes in body composition in rodents (21, 33, 42).
METHODS
Animals.
Male Wistar Crl(WI)BR rats (Charles River Laboratory, Wilmington, MA), aged 6–8 wk, were used in all experiments. Rats were housed individually in a temperature- and humidity-controlled environment with a 12:12-h light-dark cycle. All procedures were reviewed and approved by the Colorado State University Institutional Animal Care Committee.
Dietary intervention.
Upon arrival, all rats were placed on a control diet for 1 wk [CON: 20% of kcal from protein, 67% of kcal from carbohydrate (cornstarch), 13% kcal from fat; TD120001, Harlan Laboratories, Madison, WI]. Following the 1-wk acclimation period, rats were randomly assigned to CON or a high-fat diet enriched in saturated fat [SAT: 20% kcal from protein, 35% kcal from carbohydrate, 45% kcal from fat (cocoa butter); TD120003, Harlan Laboratories], a high-fat diet enriched in polyunsaturated fat [PUFA: 20% kcal from protein, 35% kcal from carbohydrate, 45% kcal from fat (corn and safflower oil); TD120002, Harlan Laboratories], or a low-fat diet high in sucrose [SUC: 20% kcal from protein, 67% kcal from carbohydrate (sucrose), 13% kcal from fat; 140194, Harlan Laboratories] for 2, 4, or 7 days (n = 6/diet/time). We have previously demonstrated that a 7-day feeding regimen of the SAT, PUFA, or SUC diets induced hepatic steatosis and insulin resistance, but only SAT and SUC activated the ER UPR (42).
Study design for measurement of protein synthesis.
Following the 1-wk acclimation period, a subset of rats (n = 3/diet/time) received intraperitoneal injections of 2H2O over a two-day period and were then randomly assigned to receive one of the four diets (CON, SAT, PUFA, and SUC) for 2, 4, or 7 days. Rats were provided supplemental 2H2O in their drinking water to achieve and maintain body water enrichment of ~5% (8). Protein synthesis was measured in total liver lysates and subcellular microsomal fractions, as well as skeletal and cardiac muscle, using gas chromatography-mass spectrometry (GC-MS).
Body weight and food intake were monitored in all rats. At the time of death, rats (~6 h fasted) were anesthetized with isoflurane, blood was collected by cardiac puncture, immediately centrifuged, and subsequently stored as plasma. A portion of the right lobe of the liver was dissected and frozen in liquid nitrogen. Gastrocnemius, soleus, and heart muscle were removed and immediately frozen in liquid nitrogen. Epididymal and retroperitoneal fat pads were dissected and weighed. All samples were stored at −80°C.
Subcellular fractionation.
Briefly, liver homogenates were suspended in 30 mM Tris·HCl with 225 mM mannitol, 75 mM sucrose, 0.5% BSA, and 0.5 mM EGTA at pH 7.4, and then washed in a series of centrifugation steps at 740 g at 4°C for 5 min. Following washing, the supernatant was centrifuged at 9,000 g for 10 min at 4°C. The resulting supernatant was centrifuged at 20,000 g for 30 min at 4°C. The final supernatant was then centrifuged at 100,000 g for 1 h to yield the ER microsome fraction (43).
Plasma and liver biochemical analyses.
Glucose was measured using a kit (Sigma-Aldrich, St. Louis, MO). Insulin was analyzed by ELISA (Linco Research, St. Charles, MO). Free fatty acids were analyzed using an HR series nonesterified fatty acid (NEFA) kit (Wako Pure Chemical Industries, Osaka, Japan). Liver triglycerides were extracted using the methods described by Bligh and Dyer (4) and were measured using a kit (Sigma-Aldrich).
RNA isolation and analysis.
Total RNA was extracted from liver tissue using TRIzol reagent, according to the manufacturer’s protocol (Invitrogen, Carlsbad, CA). For real-time PCR, reverse transcription was performed using 0.5 μg of DNase-treated RNA, SuperScript II RNase H and random hexamers. PCR reactions were performed in 96-well plates using transcribed cDNA and IQ-SYBR Green master mix (Bio-Rad Laboratories, Hercules, CA). Primer sets are provided in Table 1. PCR efficiency was between 90% and 105% for all primer and probe sets and linear over five orders of magnitude. The specificity of products generated for each set of primers was examined for each amplicon using a melting curve and gel electrophoresis. Reactions were run in triplicate, and data were calculated as the change in cycle threshold (ΔCT) for the target gene relative to the ΔCT for β2-microglobulin (reference gene), according to the procedures of Muller et al. (30).
Table 1.
Gene primer sequences
| Common Name (Symbol) | Name | Primer Sequence |
|---|---|---|
| Snat2 (Slc38a2) | Solute carrier family 38 member 2 | s: CTCCTGAGTGGCGTAGTCG |
| as: GGTGAAGTCTGAGCGAGTTG | ||
| Snat3 (Slc38a3) | Solute carrier family 38 member 3 | s: ACTCACAGACGGCATACACC |
| as: GACAGCAATGGACAGGTTG | ||
| Slc7a1 | Solute carrier family 7 member 1 | s: CCTGCCGTGCTACTGGTAAG |
| as: AGAGTAAGTGAAGAGGTGTAG | ||
| Slc7a5 | Solute carrier family 7 member 5 | s: GCTGGCTCTACACATTCAAG |
| as: GGAATTATGGAGGTGGACAG | ||
| Eprs | Glyamyl-prolyl-tRNA synthetase | s: CGATGTGAGTGGCTGCTATAT |
| as: CAATGTGGTTCTTCTCCTTCTC | ||
| Sars | Seryl-tRNA synthetase | s: AGCAGGCACTTATCCAGTATG |
| as: CACTTCCTGCATGACCTCTTT | ||
| Sec23a | Sec23 homolog A, coat complex II component | s: GCAACCACCTCCTTCCAATAG |
| as: GTCTCTTTCCTTGTGGTACAG | ||
| Sec31a | SEC31 homolog A, COPII complex component | s: CCGAGAAGATGAGTCAGTATG |
| as: ATATCTGGCTGGTTGGTGTTG | ||
| Sec61a1 | Sec 61 translocon α1 subunit | s: CATCTATTTCCAGGGCTTCC |
| as: GAATGTTGGAGGTGTAGAAGAG | ||
| Srpr (Srpra) | SRP receptor α subunit | s: TACAGTGCCTGGTAGACAAGTG |
| as: CAGACAGCCTTCACCTTATTGC | ||
| Copa | Coatomer protein complex subunit α | s: GAGACATTTGACCCTGAGAAG |
| as: CCTTTGGACACAGTCAGTAAG | ||
| Kdelr1 | KDEL endoplasmic reticulum protein retention receptor 1 | s: GAGACCATCACCAGCCATTAC |
| as: TGGCGATGAGGTCAAAGAAGC | ||
| Sil1 | SIL1 nucleotide exchange factor | s: CTGGAGTAAACGAGGTGAAAC |
| as: GACGTGTAGGTGTTGGTATTG | ||
| Hyou1 | Hypoxia upregulated 1 | s: AAATGGTGGAGGAGATAGGTG |
| as: AGGGTCAAGTCCTCAAGTTTC | ||
| Serp1 | Stress-associated endoplasmic reticulum protein 1 | s: GGGAAACTTGCTACCTGTTCT |
| as: CCTGTGCATCCCTAACTATTC | ||
| Stt3a | STT3A, catalytic subunit of the oligosaccharyltransferase complex | s: AGAAGTGAACGGATGGAAGAC |
| as: CAGAGCTAGTCCTTGAGTTTG | ||
| Calr | Calreticulin | s: CTGACCCTGATGCTAAGAAG |
| as: CTTCCATTCGCCCTTGTATTC | ||
| Canx | Calnexin | s: GTGATCCTCTTCTGCTGTTCT |
| as: CCTTCTTCGTCCTTCACATCT | ||
| Edem2 | ER degradation enhancing α-mannosidase like protein 2 | s: CAGGATGGCGGAGGAAGC |
| as: CCACAATGAAGGTCCCAATCC | ||
| Derl3 | Derlin 3 | s: TCTTCGGTGGTGTTCTTATGAC |
| as: CGCCTGGAAGTTGAGTAAGC | ||
| CHOP (Ddit3) | DNA-damage inducible transcript 3 (C/EBP homologous protein) | s: CCAGCAGAGGTCACAAGCAC |
| as: CGCACTGACCACTCTGTTTC | ||
| GADD34 (ppP1r15a) | Protein phosphatase1, regulatory subunit 15A (Growth arrest and damage-inducible protein 34) | s: CTTCCTCTGTCGTCCTCGTCTC |
| as: CCCGCCTTCCTCCCAAGTC | ||
| GRP78 (Hspa5) | Heat shock protein family A member 5 (78-kDa glucose-regulated protein) | s: AACCCAGATGAGGCTGTAGCA |
| as: ACATCAAGCAGAACCAGGTCAC | ||
| splXBP-1 | Spliced X-box binding protein 1 | s: GTCTGCTGAGTCCGCAGCAGG |
| as: GATTAGCAGACTCTGGGGAAG |
Preparation of liver tissue and microsomes for GC-MS analysis.
Liver, skeletal, and cardiac tissue homogenates and isolated microsomes were solubilized in 1 M sodium hydroxide and agitated at 56°C for 15 min. Cellular proteins were hydrolyzed with 6 M hydrochloric acid at 120°C for 24 h. Cation exchange was accomplished using a Dowex column (AG 50W-X8 resin; Bio-Rad Laboratories). Cation-charged samples were eluted using 4 N ammonium hydroxide. Following vacuum drying, samples were reconstituted in 1 ml of molecular grade water. A portion (500 µl) of the reconstituted samples were then derivatized with 500 µl of acetonitrile (Mallinkrodt, Hazelwood, MO), 50 µl of 1 M potassium phosphate monobasic (ThermoFisher Scientific, Waltham, MA), 20 µl of pentafluorobenzyl bromide (Sigma-Aldrich), and heating at 100°C for 1 h. Dried derivatives were reconstituted in 700 µl ethyl acetate for subsequent GC-MS analysis (5, 8, 28).
GC-MS analysis of derivatized amino acids.
Using negative chemical ionization (NCI), derivatized amino acids were analyzed on a DB5MS gas chromatograph column (Agilent, Santa Clara, CA). The starting temperature was 100°C, increasing 10°C per minute to reach a maximum of 220°C. For MS, NCI with helium was used as the gas carrier and methane was used as the reagent gas. Mass-to-charge ratios of 448, 449, and 450 were monitored for the pentafluorobenzyl-N-N-di(pentafluorobenzyl) alanine derivative. Alanine standards (Fluka Analytical, St. Louis, MO) ranging from 7.8125 to 2000 µg/ml were used. All samples were run in duplicate. Run time was ~25 min, and peak elution occurred at ~17.8 min (8, 28).
Analysis of deuterated water enrichment.
Deuterated water was extracted from plasma samples using heat evaporation overnight. Acetone proton exchange was accomplished by adding 20 µl of acetone and allowing it to sit overnight at room temperature. Acetone extraction was accomplished by the addition of 200 µl hexane, and collection of the organic phase was done via anhydrous sodium sulfate for GC-MS analysis (8, 28).
GC-MS analysis of deuterated water enrichment.
Using electron ionization, we analyzed deuterium-labeled acetone on a DB17MS gas chromatograph column (Agilent). The starting temperature was 60°C, increasing 20°C per minute to reach 100°C, followed by a second temperature ramp increasing 50°C per minute to reach a maximum of 220°C. For MS, helium was used as the carrier gas. Mass-to-charge ratios of 58 and 60 were monitored for 2-pentanone, 4-hydroxy-4-methyl, and 4-hydroxy-2-keto-4-methylpentane (diacetone alcohol). Deuterated water standards ranging from 0 to 20% enrichment were used. All samples were run in duplicate. Run time was ~5.4 min, and peak elution occurred at ~2.9 min (8, 28).
Data analysis.
Protein synthesis was measured via deuterium incorporation into alanine. The fraction of newly synthesized proteins was calculated by dividing protein-bound alanine enrichment by the true precursor enrichment. The true precursor enrichment used plasma deuterium enrichment, which was adjusted to free alanine enrichment using mass isotopomer distribution analysis (5, 8, 27, 45). The fraction of new protein synthesis was determined at 2, 4, or 7 days (5, 8).
Statistical analysis.
Two-way ANOVA was used to examine the effects of diet and time. When appropriate, post hoc analyses were conducted using a Tukey post hoc test. Statistical significance was set at P < 0.05. All values are reported as means ± SD.
RESULTS
General animal characteristics.
Body weight, fat pad weight, plasma glucose and plasma NEFA concentrations were not significantly different among dietary groups (Table 2). Total food intake was significantly increased in SAT compared with CON on day 7 only (Table 2). Plasma insulin concentration was significantly increased in SAT, PUFA, and SUC compared with CON following 4 and 7 days of dietary treatment (Table 2). Hepatic triglyceride concentration was significantly increased in PUFA and SUC compared with CON following 4 and 7 days of dietary treatment (Table 2). The SAT diet tended to result in increased hepatic triglyceride concentrations (24% increase compared with CON at 4 days and 32% compared with CON at 7 days), but this did not reach statistical significance.
Table 2.
Animal characteristics
| Diet | Terminal Body Weight, g | Total Energy Intake, kcal | Epi Fat Pad Weight, g | Retro Fat Pad Weight, g | Plasma Glucose, mM | NEFA, µM | Insulin, ng/ml | Liver TG, mg/g |
|---|---|---|---|---|---|---|---|---|
| 2 Days on Diet | ||||||||
| CON | 223.2 ± 9.1 | 135.8 ± 14.7 | 2.7 ± 0.9 | 2.1 ± 0.9 | 12.1 ± 1.7 | 244.0 ± 101.5 | 0.5 ± 0.0 | 10.7 ± 1.5 |
| SAT | 223.9 ± 15.8 | 149.5 ± 23.9 | 2.9 ± 0.7 | 2.2 ± 0.7 | 10.9 ± 3.0 | 365.0 ± 107.2* | 0.8 ± 0.1 | 14.4 ± 2.3 |
| PUFA | 235.2 ± 11.7 | 152.1 ± 9.3 | 2.6 ± 0.6 | 2.1 ± 0.6 | 10.5 ± 2.3 | 288.2 ± 34.9 | 0.7 ± 0.1 | 16.0 ± 4.0 |
| SUC | 222.97 ± 6.4 | 135.4 ± 18.5 | 2.7 ± 0.5 | 2.0 ± 0.6 | 10.6 ± 1.4 | 293.5 ± 60.1 | 0.8 ± 0.2 | 16.4 ± 2.5* |
| 4 Days on Diet | ||||||||
| CON | 244.1 ± 11.3 | 296.0 ± 36.6 | 3.2 ± 0.9 | 2.9 ± 1.0 | 11.0 ± 2.1 | 359.1 ± 122.9 | 0.7 ± 0.1 | 11.2 ± 1.0 |
| SAT | 236.3 ± 16.9 | 310.4 ± 30.4 | 2.7 ± 0.4 | 2.0 ± 0.9* | 10.3 ± 1.5 | 379.1 ± 75.2 | 1.2 ± 0.2* | 14.7 ± 3.4 |
| PUFA | 240.0 ± 6.7 | 307.4 ± 26.7 | 2.9 ± 0.4 | 2.2 ± 0.2 | 10.8 ± 2.5 | 370.6 ± 65.4 | 1.0 ± 0.2* | 19.4 ± 5.3* |
| SUC | 246.8 ± 14.9 | 286.3 ± 33.2 | 3.2 ± 0.6 | 2.3 ± 0.6 | 11.9 ± 2.4 | 379.9 ± 94.1 | 1.0 ± 0.2* | 17.0 ± 2.7* |
| 7 Days on Diet | ||||||||
| CON | 264.7 ± 9.4 | 500.7 ± 19.3 | 3.6 ± 0.5 | 3.2 ± 0.8 | 12.5 ± 3.0 | 281.6 ± 56.5 | 0.6 ± 0.1 | 11.6 ± 2.6 |
| SAT | 272.2 ± 17.9 | 575.7 ± 83.7* | 3.3 ± 0.5 | 2.9 ± 0.6 | 10.7 ± 1.8 | 348.7 ± 67.4 | 1.3 ± 0.4* | 16.9 ± 1.2 |
| PUFA | 260.6 ± 8.0 | 536.1 ± 62.4 | 3.4 ± 0.5 | 2.9 ± 0.5 | 11.2 ± 2.3 | 316.1 ± 72.8 | 1.1 ± 0.2* | 22.2 ± 4.7* |
| SUC | 267.1 ± 16.4 | 504.9 ± 49.6 | 3.3 ± 0.5 | 3.1 ± 0.8 | 12.2 ± 2.1 | 361.0 ± 56.6 | 1.2 ± 0.2* | 21.1 ± 7.5* |
Values are reported as means ± SD; n = 6. Epi, epididymal; Retro, retroperitoneal; NEFA, nonesterified fatty acids; TG, triglyceride. Diets: CON, control; SAT, high saturated fat; PUFA, high polyunsaturated fat; SUC, high sucrose.
Significant difference compared with CON, P < 0.05.
Protein synthesis in response to dietary treatments.
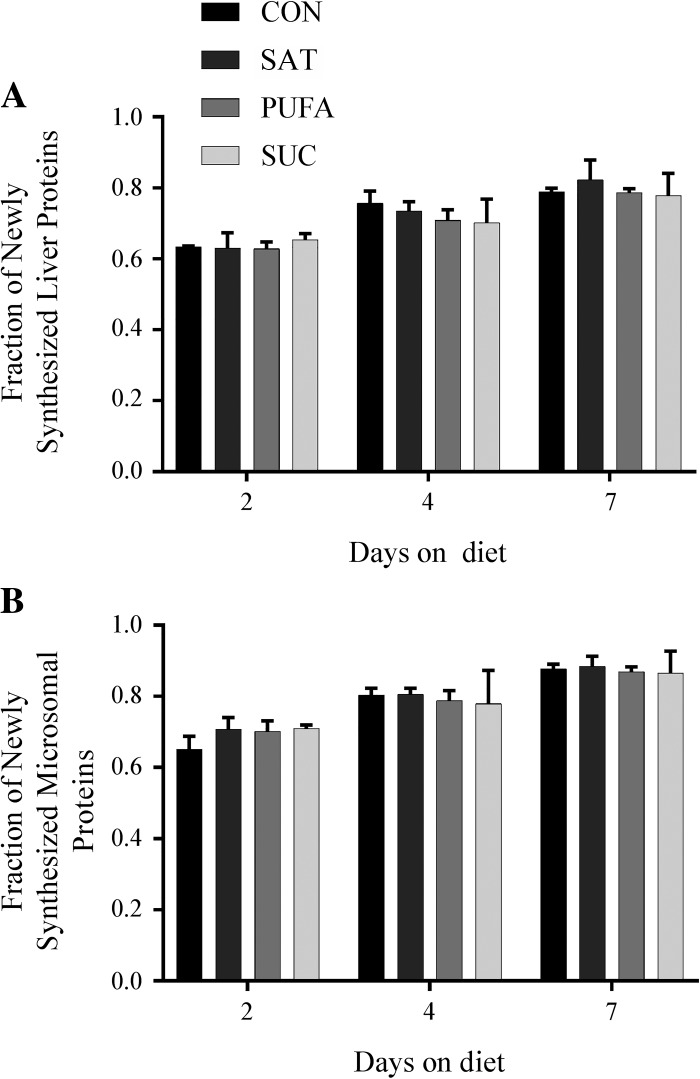
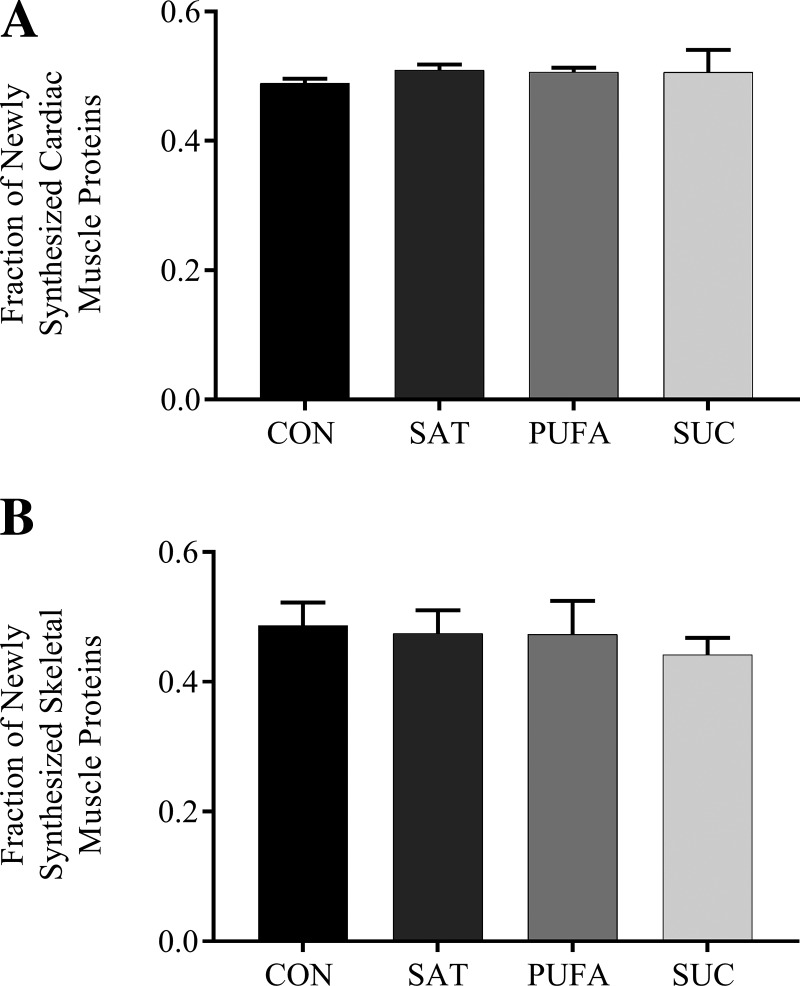
Protein synthesis in total liver lysates and microsomes was not significantly different among dietary groups at 2, 4, or 7 days (Fig. 1). Protein synthesis in skeletal muscle and heart was also not significantly different among dietary groups at 7 days (Fig. 2). Note that protein synthesis was not assessed at 2 or 4 days in skeletal muscle and heart due to low levels of enrichment at these time points.
Fig. 1.
Effect of diet on protein synthesis in total liver lysates and microsomes. The fraction of newly synthesized proteins in total liver (A) and liver microsomes (B) following 2, 4, or 7 days on control (CON), high-saturated fat (SAT), high-polyunsaturated fat (PUFA), or high-sucrose (SUC) diets. Values are reported as means ± SD for n = 3 per group per day.
Fig. 2.
Effect of diet on protein synthesis in cardiac and skeletal muscle. The fraction of newly synthesized proteins in cardiac (A) and skeletal (B) muscle following 7 days on the CON, SAT, PUFA, or SUC diets. Values are reported as means ± SD for n = 3 per group per day.
Gene expression in response to dietary treatments.
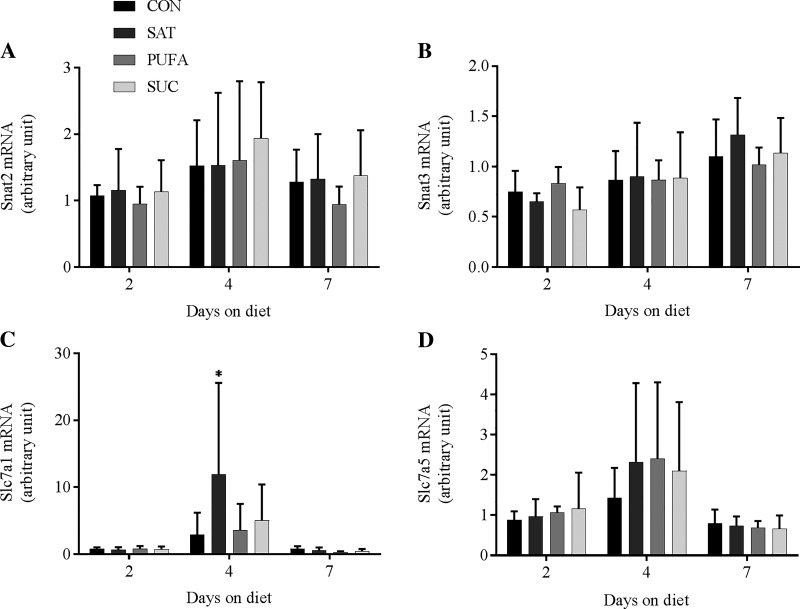
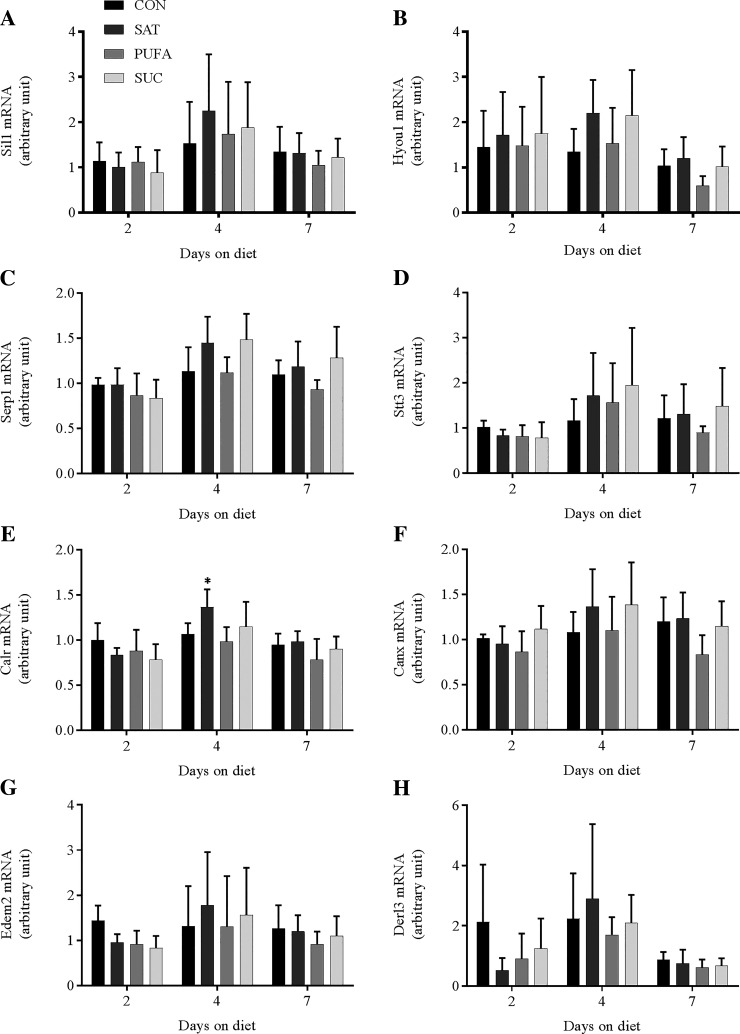
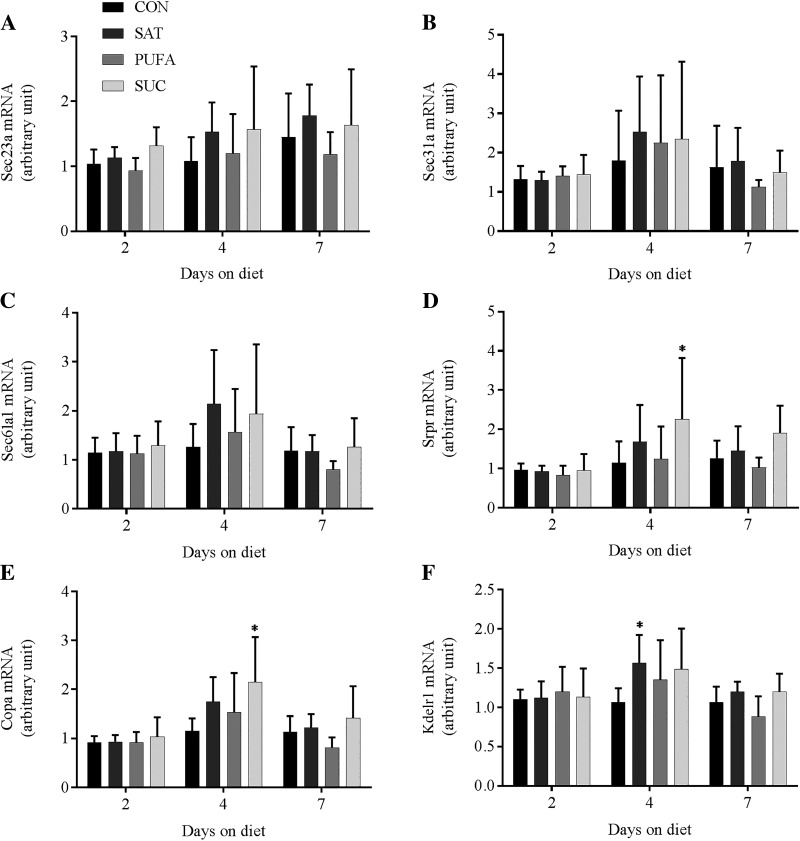
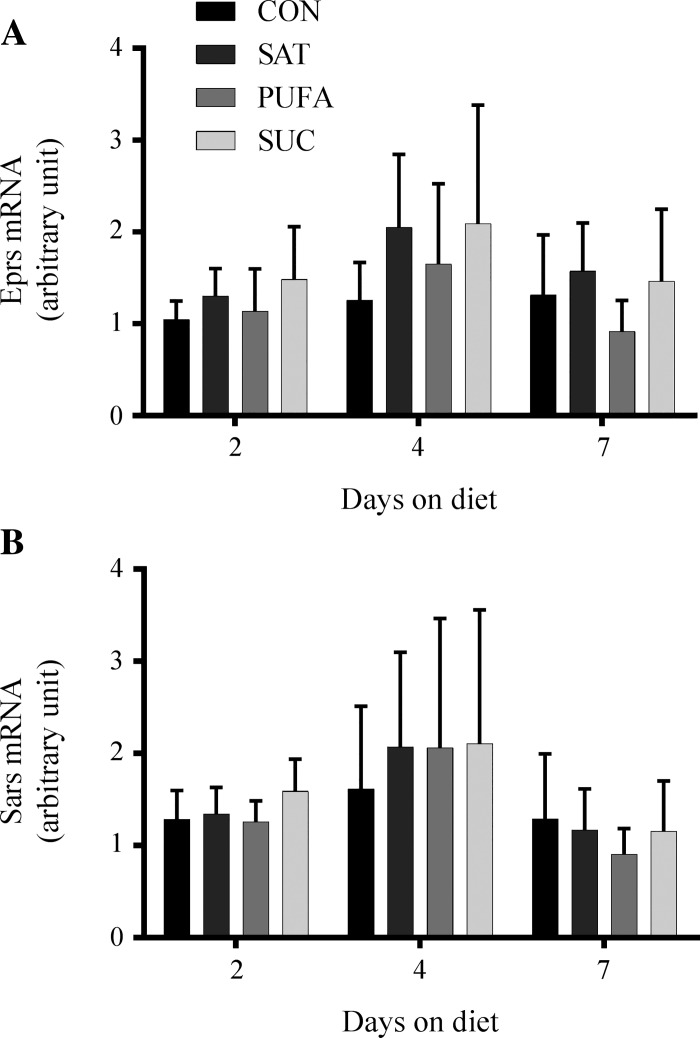
A number of genes that encode proteins involved in amino acid transport (Snat2, Snat3, Slc7a1, and Slc7a5), protein translation (Eprs and Sars), ER import and translocation (Sec23a, Sec31a, Sec61a1, Srpr, Copa, and Kdelr1), and ER quality control and degradation (Sil1, Hyou1, Serp1, Stt3a, Calr, Canx, Edem2, and Derl3) were analyzed. Two previous studies have observed changes in this gene network in response to perturbations that promoted protein remodeling and changes in protein synthesis in HEK-293 cells, Min6 cells, and pancreatic islets (22, 37). In the present study, there was no consistent pattern of change in any of these genes in response to dietary treatments or days on the diet (Figs. 3–6). The only significant changes involved Slc7a1 mRNA in SAT compared with CON at day 4 (Fig. 3), Srpr mRNA in SUC compared with CON at day 4 (Fig. 5), Copa mRNA in SUC compared with CON at day 4 (Fig. 5), and Calr mRNA in SAT compared with CON at day 4 (Fig. 6).
Fig. 3.
Effect of diet on genes involved in amino acid transport in the liver. Solute carrier family 38, member 2 (Snat2; A), solute carrier family 38, member 3 (Snat3; B), solute carrier family 7 member 1 (Slc7a1; C), solute carrier family 7 member 5 (Slc7a5; D) mRNA following 2, 4, or 7 days on the CON, SAT, PUFA, or SUC diets. Values are reported as means ± SD for n = 6 per group per day. *Significant difference from CON, P < 0.05.
Fig. 6.
Effect of diet on genes involved in ER quality control and degradation in the liver. SIL1 nucleotide exchange factor (Sil1; A), hypoxia upregulated 1 (Hyou1; B), stress-associated endoplasmic reticulum protein 1 (Serp1; C), STT3A, catalytic subunit of the oligosaccharyltransferase complex (Stt3a; D), calreticulin (Calr; E), calnexin (Canx; F), ER degradation enhancing α-mannosidase like protein 2 (Edem2; G), derlin 3 (Derl3; H) in the liver following 2, 4, or 7 days on CON, SAT, PUFA, or SUC diets. Values are reported as means ± SD for n = 6 per group per day. *Significant difference from CON, P < 0.05.
Fig. 5.
Effect of diet on genes involved in endoplasmic reticulum (ER) import and translocation in the liver. Sec23 homolog A, coat complex II component (Sec23a; A), SEC31 homolog A, COPII complex component (Sec31a; B), Sec 61 translocon α1 subunit (Sec61a1; C), SRP receptor α subunit (Srpr; D), coatomer protein complex subunit α (Copa; E), KDEL endoplasmic reticulum protein retention receptor 1 (Kdelr1; F) mRNA following 2, 4, or 7 days on CON, SAT, PUFA, or SUC diets. Values are reported as means ± SD for n = 6 per group per day. *Significant difference from CON, P < 0.05.
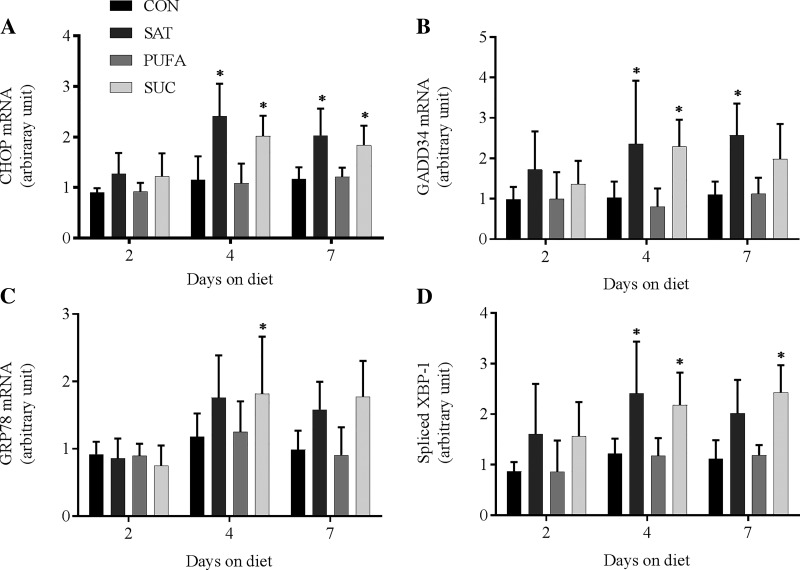
In contrast, several genes linked to the activation of the ER UPR were increased in response to dietary treatments. CHOP, GADD34, and spliced variant of X-box binding protein-1 (splXBP-1) mRNA were significantly increased in SAT and SUC following 4 and 7 days of dietary treatment (Fig. 7).
Fig. 7.
Effect of diet on ER UPR genes. DNA-damage inducible transcript 3 (CHOP; A), protein phosphatase 1, regulatory subunit 15A (GADD34; B), heat shock protein family A member 5 (GRP78; C), and spliced X-box binding protein 1 (splXBP-1; D) mRNA in the liver following 2, 4, or 7 days on CON, SAT, PUFA, or SUC diets. Values are reported as means ± SD for n = 6 per group per day. *Significant difference from CON, P < 0.05.
DISCUSSION
This study examined the short-term effects of diets enriched in fat or sucrose on protein synthesis in rats. The results demonstrate that diets enriched in fat or sucrose do not result in significant changes in hepatic, muscle or heart protein synthesis over a time course of 7 days.
Diets high in fat or sucrose are linked to obesity, insulin resistance, and NAFLD in humans (3, 6, 44). In rodent models, these same diets can induce insulin resistance and steatosis in the liver rapidly and before significant changes in body composition, and have been linked to disturbances in proteostasis (10, 21, 25, 33, 36, 42). Results from the present study suggest that diet-mediated changes in hepatic protein synthesis do not play a significant role in the early development of insulin resistance, steatosis, or impaired proteostasis in the liver. It is important to note that energy intake, body weight, and fat pad weight were not significantly different among dietary groups. The lack of “excess” nutrient intake and positive energy balance, both of which are important stimuli for protein synthesis, may minimize the need for an anabolic response.
Protein synthesis involves the cytosolic, ER, and mitochondrial compartments (35, 40). A lack of change in total protein synthesis does not preclude the possibility that diet composition might change the distribution of proteins synthesized among cellular compartments. Therefore, we monitored both total cellular protein synthesis (total lysate) and ER-associated protein synthesis (microsomal fraction) in the liver. Diet composition had no effect on total cellular or ER-associated protein synthesis.
The short-term nature of this study led us to also investigate the effects of diet composition on genes associated with protein anabolic pathways. We measured the expression of genes involved in amino acid transport (Snat2, Snat3, Slc7a1, and Slc7a5), protein translation (Eprs and Sars), ER import and translocation (Sec23a, Sec31a, Sec61a1, Srpr, Copa, and Kdelr1), and ER quality control and degradation (Sil1, Hyou1, Serp1, Stt3a, Calr, Canx, Edem2, and Derl3). None of the experimental diets elicited consistent or significant changes in any of the genes measured at 2, 4, or 7 days. These data suggest that diets high in sucrose, polyunsaturated fat, or saturated fat do not provoke changes to the transcriptional machinery associated with protein anabolism and are consistent with direct measurement of protein synthesis.
In mammals, the UPR consists of three proximal transmembrane sensors: inositol-requiring ER-to-nucleus signaling protein (IRE1α), RNA-dependent protein kinase-like ER eIF-2α kinase (PERK), and activating transcription factor 6 (ATF6) (19). In the present study, the high saturated fat and high sucrose diets resulted in increased XBP-1 splicing (splXBP-1; mediated by IRE1α) and upregulation of genes associated with the UPR in the liver. A recent study demonstrated that splXBP-1 is important to the remodeling of the ER proteostasis network in HEK-293 cells (37). Selective activation of splXBP-1 resulted in the upregulation of genes involved in amino acid transport, trafficking, protein folding, and quality control. We did not detect changes in genes involved in amino acid transport and trafficking following dietary treatments at 2, 4, or 7 days. These data suggest that the regulation of genes associated with the proteostasis network by splXBP-1 is cell/tissue specific.
Although the high-sucrose and high-saturated fat diets resulted in increased splXBP-1 and upregulation of genes associated with the UPR, we did not observe significant differences in the phosphorylation of eukaryotic translation initiation factor 2α (mediated by PERK) among the dietary groups (data not shown). Therefore, whether short-term exposure to diets enriched in saturated fat or sucrose provokes ER stress or selectively activates only the IRE1 branch of the UPR is presently unclear.
In summary, the present study examined protein synthesis in total liver lysates and microsomes in response to diets enriched in polyunsaturated fat, saturated fat, and sucrose at multiple time points over a 7-day period. All three diets resulted in hepatic steatosis and elevated fasting insulin levels. Diets enriched in saturated fat and sucrose also increased splXBP-1 and several UPR target genes. However, none of these diets increased protein synthesis in the liver.
GRANTS
This project was supported by National Institutes of Health Grants DK-072017 (to M. J. Pagliassotti) and AG-042569 (to K. L. Hamilton and B. F. Miller).
DISCLOSURES
No conflicts of interest, financial or otherwise, are declared by the authors.
AUTHOR CONTRIBUTIONS
A.L.E., K.L.H., B.F.M., and M.J.P. conceived and designed research; A.L.E., W.M.H., and C.M.S. carried out studies; A.L.E., P.Y.K., C.M.S. F.F.P., T.W., D.W. analyzed data; A.L.E., K.L.H., B.F.M., M.J.P. interpreted results of experiments; A.L.E. and M.J.P. drafted manuscript; P.Y.K., C.M.S., K.L.H., B.F.M. edited manuscript; A.L.E., W.M.H., P.Y.K., C.M.S., F.F.P., Y.W., D.W., K.L.H., B.F.M., M.J.P. approved final version of the manuscript.
Fig. 4.
Effect of diet on genes involved in protein translation in the liver. Glutamyl-prolyl-tRNA synthetase (Eprs; A) and seryl-tRNA synthetase (Sars; B) mRNA following 2, 4, or 7 days on the CON, SAT, PUFA, or SUC diets. Values are reported as means ± SD for n = 6 per group per day.
REFERENCES
- 1.Anderson SR, Gilge DA, Steiber AL, Previs SF. Diet-induced obesity alters protein synthesis: tissue-specific effects in fasted versus fed mice. Metabolism 57: 347–354, 2008. doi: 10.1016/j.metabol.2007.10.009. [DOI] [PMC free article] [PubMed] [Google Scholar]
- 2.Baiceanu A, Mesdom P, Lagouge M, Foufelle F. Endoplasmic reticulum proteostasis in hepatic steatosis. Nat Rev Endocrinol 12: 710–722, 2016. doi: 10.1038/nrendo.2016.124. [DOI] [PubMed] [Google Scholar]
- 3.Bisschop PH, de Metz J, Ackermans MT, Endert E, Pijl H, Kuipers F, Meijer AJ, Sauerwein HP, Romijn JA. Dietary fat content alters insulin-mediated glucose metabolism in healthy men. Am J Clin Nutr 73: 554–559, 2001. [DOI] [PubMed] [Google Scholar]
- 4.Bligh EG, Dyer WJ. A rapid method of total lipid extraction and purification. Can J Biochem Physiol 37: 911–917, 1959. doi: 10.1139/y59-099. [DOI] [PubMed] [Google Scholar]
- 5.Busch R, Kim YK, Neese RA, Schade-Serin V, Collins M, Awada M, Gardner JL, Beysen C, Marino ME, Misell LM, Hellerstein MK. Measurement of protein turnover rates by heavy water labeling of nonessential amino acids. Biochim Biophys Acta 1760: 730–744, 2006. doi: 10.1016/j.bbagen.2005.12.023. [DOI] [PubMed] [Google Scholar]
- 6.Chan TF, Lin WT, Huang HL, Lee CY, Wu PW, Chiu YW, Huang CC, Tsai S, Lin CL, Lee CH. Consumption of sugar-sweetened beverages is associated with components of the metabolic syndrome in adolescents. Nutrients 6: 2088–2103, 2014. doi: 10.3390/nu6052088. [DOI] [PMC free article] [PubMed] [Google Scholar]
- 7.Díaz-Villanueva JF, Díaz-Molina R, García-González V. Protein folding and mechanisms of proteostasis. Int J Mol Sci 16: 17193–17230, 2015. doi: 10.3390/ijms160817193. [DOI] [PMC free article] [PubMed] [Google Scholar]
- 8.Drake JC, Bruns DR, Peelor FF III, Biela LM, Miller RA, Miller BF, Hamilton KL. Long-lived Snell dwarf mice display increased proteostatic mechanisms that are not dependent on decreased mTORC1 activity. Aging Cell 14: 474–482, 2015. doi: 10.1111/acel.12329. [DOI] [PMC free article] [PubMed] [Google Scholar]
- 9.Drake JC, Peelor FF III, Biela LM, Watkins MK, Miller RA, Hamilton KL, Miller BF. Assessment of mitochondrial biogenesis and mTORC1 signaling during chronic rapamycin feeding in male and female mice. J Gerontol A Biol Sci Med Sci 68: 1493–1501, 2013. doi: 10.1093/gerona/glt047. [DOI] [PMC free article] [PubMed] [Google Scholar]
- 10.Fengler VH, Macheiner T, Kessler SM, Czepukojc B, Gemperlein K, Müller R, Kiemer AK, Magnes C, Haybaeck J, Lackner C, Sargsyan K. Susceptibility of different mouse wild-type strains to develop diet-induced NAFLD/AFLD-associated liver disease. PLoS One 11: e0155163, 2016. doi: 10.1371/journal.pone.0155163. [DOI] [PMC free article] [PubMed] [Google Scholar]
- 11.Fu S, Fan J, Blanco J, Gimenez-Cassina A, Danial NN, Watkins SM, Hotamisligil GS. Polysome profiling in liver identifies dynamic regulation of endoplasmic reticulum translatome by obesity and fasting. PLoS Genet 8: e1002902, 2012. doi: 10.1371/journal.pgen.1002902. [DOI] [PMC free article] [PubMed] [Google Scholar]
- 12.Gentile CL, Frye M, Pagliassotti MJ. Endoplasmic reticulum stress and the unfolded protein response in nonalcoholic fatty liver disease. Antioxid Redox Signal 15: 505–521, 2011. doi: 10.1089/ars.2010.3790. [DOI] [PMC free article] [PubMed] [Google Scholar]
- 13.Harrison DE, Strong R, Sharp ZD, Nelson JF, Astle CM, Flurkey K, Nadon NL, Wilkinson JE, Frenkel K, Carter CS, Pahor M, Javors MA, Fernandez E, Miller RA. Rapamycin fed late in life extends lifespan in genetically heterogeneous mice. Nature 460: 392–395, 2009. doi: 10.1038/nature08221. [DOI] [PMC free article] [PubMed] [Google Scholar]
- 14.Hatanaka M, Maier B, Sims EK, Templin AT, Kulkarni RN, Evans-Molina C, Mirmira RG. Palmitate induces mRNA translation and increases ER protein load in islet β-cells via activation of the mammalian target of rapamycin pathway. Diabetes 63: 3404–3415, 2014. doi: 10.2337/db14-0105. [DOI] [PMC free article] [PubMed] [Google Scholar]
- 15.Hipp MS, Park SH, Hartl FU. Proteostasis impairment in protein-misfolding and -aggregation diseases. Trends Cell Biol 24: 506–514, 2014. doi: 10.1016/j.tcb.2014.05.003. [DOI] [PubMed] [Google Scholar]
- 16.Hotamisligil GS. Endoplasmic reticulum stress and the inflammatory basis of metabolic disease. Cell 140: 900–917, 2010. doi: 10.1016/j.cell.2010.02.034. [DOI] [PMC free article] [PubMed] [Google Scholar]
- 17.Jaisson S, Gillery P. Impaired proteostasis: role in the pathogenesis of diabetes mellitus. Diabetologia 57: 1517–1527, 2014. doi: 10.1007/s00125-014-3257-1. [DOI] [PubMed] [Google Scholar]
- 18.Kaeberlein M, Powers RW III, Steffen KK, Westman EA, Hu D, Dang N, Kerr EO, Kirkland KT, Fields S, Kennedy BK. Regulation of yeast replicative life span by TOR and Sch9 in response to nutrients. Science 310: 1193–1196, 2005. doi: 10.1126/science.1115535. [DOI] [PubMed] [Google Scholar]
- 19.Kaufman RJ. Stress signaling from the lumen of the endoplasmic reticulum: coordination of gene transcriptional and translational controls. Genes Dev 13: 1211–1233, 1999. doi: 10.1101/gad.13.10.1211. [DOI] [PubMed] [Google Scholar]
- 20.Kaushik S, Cuervo AM. Proteostasis and aging. Nat Med 21: 1406–1415, 2015. doi: 10.1038/nm.4001. [DOI] [PubMed] [Google Scholar]
- 21.Kraegen EW, Clark PW, Jenkins AB, Daley EA, Chisholm DJ, Storlien LH. Development of muscle insulin resistance after liver insulin resistance in high-fat-fed rats. Diabetes 40: 1397–1403, 1991. doi: 10.2337/diab.40.11.1397. [DOI] [PubMed] [Google Scholar]
- 22.Krokowski D, Han J, Saikia M, Majumder M, Yuan CL, Guan BJ, Bevilacqua E, Bussolati O, Bröer S, Arvan P, Tchórzewski M, Snider MD, Puchowicz M, Croniger CM, Kimball SR, Pan T, Koromilas AE, Kaufman RJ, Hatzoglou M. A self-defeating anabolic program leads to β-cell apoptosis in endoplasmic reticulum stress-induced diabetes via regulation of amino acid flux. J Biol Chem 288: 17202–17213, 2013. doi: 10.1074/jbc.M113.466920. [DOI] [PMC free article] [PubMed] [Google Scholar]
- 23.Labbadia J, Morimoto RI. The biology of proteostasis in aging and disease. Annu Rev Biochem 84: 435–464, 2015. doi: 10.1146/annurev-biochem-060614-033955. [DOI] [PMC free article] [PubMed] [Google Scholar]
- 24.Lipson KL, Fonseca SG, Ishigaki S, Nguyen LX, Foss E, Bortell R, Rossini AA, Urano F. Regulation of insulin biosynthesis in pancreatic beta cells by an endoplasmic reticulum-resident protein kinase IRE1. Cell Metab 4: 245–254, 2006. doi: 10.1016/j.cmet.2006.07.007. [DOI] [PubMed] [Google Scholar]
- 25.Maher JJ. New insights from rodent models of fatty liver disease. Antioxid Redox Signal 15: 535–550, 2011. doi: 10.1089/ars.2010.3749. [DOI] [PMC free article] [PubMed] [Google Scholar]
- 26.Masgrau A, Mishellany-Dutour A, Murakami H, Beaufrère AM, Walrand S, Giraudet C, Migné C, Gerbaix M, Metz L, Courteix D, Guillet C, Boirie Y. Time-course changes of muscle protein synthesis associated with obesity-induced lipotoxicity. J Physiol 590: 5199–5210, 2012. doi: 10.1113/jphysiol.2012.238576. [DOI] [PMC free article] [PubMed] [Google Scholar]
- 27.McCabe BJ, Bederman IR, Croniger C, Millward C, Norment C, Previs SF. Reproducibility of gas chromatography-mass spectrometry measurements of 2H labeling of water: application for measuring body composition in mice. Anal Biochem 350: 171–176, 2006. doi: 10.1016/j.ab.2006.01.020. [DOI] [PubMed] [Google Scholar]
- 28.Miller BF, Wolff CA, Peelor FF III, Shipman PD, Hamilton KL. Modeling the contribution of individual proteins to mixed skeletal muscle protein synthetic rates over increasing periods of label incorporation. J Appl Physiol (1985) 118: 655–661, 2015. doi: 10.1152/japplphysiol.00987.2014. [DOI] [PMC free article] [PubMed] [Google Scholar]
- 29.Morimoto RI, Cuervo AM. Proteostasis and the aging proteome in health and disease. J Gerontol A Biol Sci Med Sci 69, Suppl 1: S33–S38, 2014. doi: 10.1093/gerona/glu049. [DOI] [PMC free article] [PubMed] [Google Scholar]
- 30.Muller PY, Janovjak H, Miserez AR, Dobbie Z. Processing of gene expression data generated by quantitative real-time RT-PCR. Biotechniques 32: 1372–1374, 2002. [PubMed] [Google Scholar]
- 31.Ostankovitch M, Buchner J. The network of molecular chaperones: insights in the cellular proteostasis machinery. J Mol Biol 427: 2899–2903, 2015. doi: 10.1016/j.jmb.2015.08.010. [DOI] [PubMed] [Google Scholar]
- 32.Oyadomari S, Harding HP, Zhang Y, Oyadomari M, Ron D. Dephosphorylation of translation initiation factor 2α enhances glucose tolerance and attenuates hepatosteatosis in mice. Cell Metab 7: 520–532, 2008. doi: 10.1016/j.cmet.2008.04.011. [DOI] [PMC free article] [PubMed] [Google Scholar]
- 33.Pagliassotti MJ, Prach PA, Koppenhafer TA, Pan DA. Changes in insulin action, triglycerides, and lipid composition during sucrose feeding in rats. Am J Physiol Regul Integr Comp Physiol 271: R1319–R1326, 1996. [DOI] [PubMed] [Google Scholar]
- 34.Pan KZ, Palter JE, Rogers AN, Olsen A, Chen D, Lithgow GJ, Kapahi P. Inhibition of mRNA translation extends lifespan in Caenorhabditis elegans. Aging Cell 6: 111–119, 2007. doi: 10.1111/j.1474-9726.2006.00266.x. [DOI] [PMC free article] [PubMed] [Google Scholar]
- 35.Roy A, Wonderlin WF. The permeability of the endoplasmic reticulum is dynamically coupled to protein synthesis. J Biol Chem 278: 4397–4403, 2003. doi: 10.1074/jbc.M207295200. [DOI] [PubMed] [Google Scholar]
- 36.Savage DB, Choi CS, Samuel VT, Liu ZX, Zhang D, Wang A, Zhang XM, Cline GW, Yu XX, Geisler JG, Bhanot S, Monia BP, Shulman GI. Reversal of diet-induced hepatic steatosis and hepatic insulin resistance by antisense oligonucleotide inhibitors of acetyl-CoA carboxylases 1 and 2. J Clin Invest 116: 817–824, 2006. doi: 10.1172/JCI27300. [DOI] [PMC free article] [PubMed] [Google Scholar]
- 37.Shoulders MD, Ryno LM, Genereux JC, Moresco JJ, Tu PG, Wu C, Yates JR III, Su AI, Kelly JW, Wiseman RL. Stress-independent activation of XBP1s and/or ATF6 reveals three functionally diverse ER proteostasis environments. Cell Reports 3: 1279–1292, 2013. doi: 10.1016/j.celrep.2013.03.024. [DOI] [PMC free article] [PubMed] [Google Scholar]
- 38.Stanhope KL, Schwarz JM, Keim NL, Griffen SC, Bremer AA, Graham JL, Hatcher B, Cox CL, Dyachenko A, Zhang W, McGahan JP, Seibert A, Krauss RM, Chiu S, Schaefer EJ, Ai M, Otokozawa S, Nakajima K, Nakano T, Beysen C, Hellerstein MK, Berglund L, Havel PJ. Consuming fructose-sweetened, not glucose-sweetened, beverages increases visceral adiposity and lipids and decreases insulin sensitivity in overweight/obese humans. J Clin Invest 119: 1322–1334, 2009. doi: 10.1172/JCI37385. [DOI] [PMC free article] [PubMed] [Google Scholar]
- 39.Steffen KK, Dillin A. A ribosomal perspective on proteostasis and aging. Cell Metab 23: 1004–1012, 2016. doi: 10.1016/j.cmet.2016.05.013. [DOI] [PubMed] [Google Scholar]
- 40.Stephens SB, Nicchitta CV. Divergent regulation of protein synthesis in the cytosol and endoplasmic reticulum compartments of mammalian cells. Mol Biol Cell 19: 623–632, 2008. doi: 10.1091/mbc.E07-07-0677. [DOI] [PMC free article] [PubMed] [Google Scholar]
- 41.Taylor RC, Dillin A. Aging as an event of proteostasis collapse. Cold Spring Harb Perspect Biol 3: a004440, 2011. doi: 10.1101/cshperspect.a004440. [DOI] [PMC free article] [PubMed] [Google Scholar]
- 42.Wang D, Wei Y, Pagliassotti MJ. Saturated fatty acids promote endoplasmic reticulum stress and liver injury in rats with hepatic steatosis. Endocrinology 147: 943–951, 2006. doi: 10.1210/en.2005-0570. [DOI] [PubMed] [Google Scholar]
- 43.Wieckowski MR, Giorgi C, Lebiedzinska M, Duszynski J, Pinton P. Isolation of mitochondria-associated membranes and mitochondria from animal tissues and cells. Nat Protoc 4: 1582–1590, 2009. doi: 10.1038/nprot.2009.151. [DOI] [PubMed] [Google Scholar]
- 44.Xiao C, Giacca A, Carpentier A, Lewis GF. Differential effects of monounsaturated, polyunsaturated and saturated fat ingestion on glucose-stimulated insulin secretion, sensitivity and clearance in overweight and obese, non-diabetic humans. Diabetologia 49: 1371–1379, 2006. doi: 10.1007/s00125-006-0211-x. [DOI] [PubMed] [Google Scholar]
- 45.Yang D, Diraison F, Beylot M, Brunengraber DZ, Samols MA, Anderson VE, Brunengraber H. Assay of low deuterium enrichment of water by isotopic exchange with [U-13C3]acetone and gas chromatography-mass spectrometry. Anal Biochem 258: 315–321, 1998. doi: 10.1006/abio.1998.2632. [DOI] [PubMed] [Google Scholar]


