Abstract
Lysosomal storage diseases (LSDs) are a group of genetic disorders, resulting from deficiencies of lysosomal enzyme. Genotype-phenotype correlation is essential for timely and proper treatment allocation. Recently, by integrating prediction outcomes of 7 bioinformatics tools, we developed a SAAMP algorithm to predict the impact of individual amino acid substitution. To optimize this approach, we evaluated the performance of these bioinformatics tools in a broad array of genes. PolyPhen and PROVEAN had the best performances, while SNP&GOs, PANTHER and I-Mutant had the worst performances. Therefore, SAAMP 2.0 was developed by excluding 3 tools with worst performance, yielding a sensitivity of 94% and a specificity of 90%. To generalize the guideline to proteins without known structures, we built the 3D model of iduronate-2-sulfatase by homology modeling. Further, we investigated the phenotype severity of known disease-causing mutations of the GLB1 gene, which lead to two LSDs (GM1 gangliosidosis; Morquio disease type B). Based on previous literature and structural analysis, we associated these mutations with disease subtypes and proposed a theory to explain the complicated genotype-phenotype correlation. Collectively, an updated guideline for phenotype prediction with SAAMP 2.0 was proposed, which will provide essential information for early diagnosis and proper treatment allocation, and may be generalized to many monogenic diseases.
Keywords: genotype-phenotype correlation, GM1 gangliosidosis, homology modeling, in silico, lysosomal storage disease, Morquio syndrome
Graphical Abstract
1. Introduction
Lysosomal storage diseases (LSDs) represent a group of approximately 70 inborn errors of metabolism, and the total incidence of is approximately 1:5,000 to 1:10,000 [1,2]. LSDs result from accumulation of specific macromolecules including lipids, glycoproteins and glycosaminoglycans (GAG) inside the organelles, e.g., endosome, autophagosome and lysosome. Accumulation of these macromolecules leads to tissue damage in multiple organs and subsequent disease-specific symptoms [3]. The age of clinical onset and spectrum of symptoms exhibited among different LSDs and subtypes of one LSD vary. It depends on the degree of protein function affected by specific mutations, the biochemistry of the storage materials, as well as the cell types where storage occurs.
Diagnosis of LSDs is an often long and burdensome odyssey [4], which usually includes quantification of macromolecules excreted in urine, enzyme assay with leukocytes (or cultured skin fibroblasts), mutation analysis and symptoms-based judgment. An alternative approach is newborn screening (NBS) program, which shortens the diagnostic process. Early detection by NBS allows for early initiation of disease modifying treatment which is essential for optimal treatment efficacy. However, NBS usually leads to the identification of individuals with low enzyme activity with previously unreported genetic variants of unknown significance [5]. Therefore, decisions on treatment initiation can be complicated in pre-symptomatic patients, and a robust phenotypic prediction is essential.
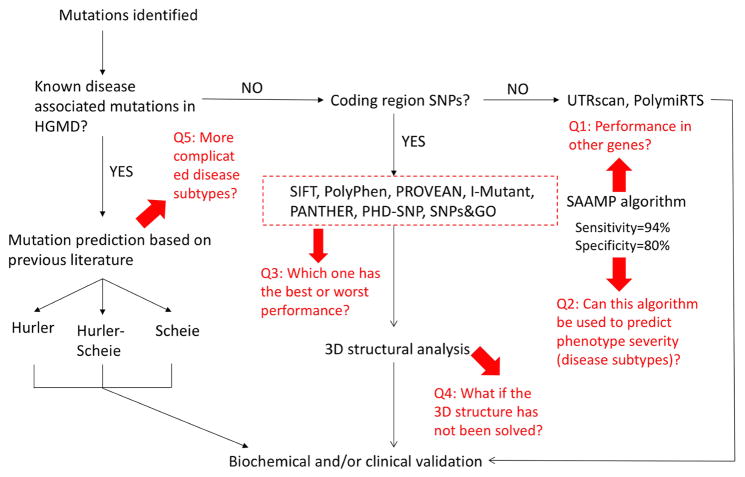
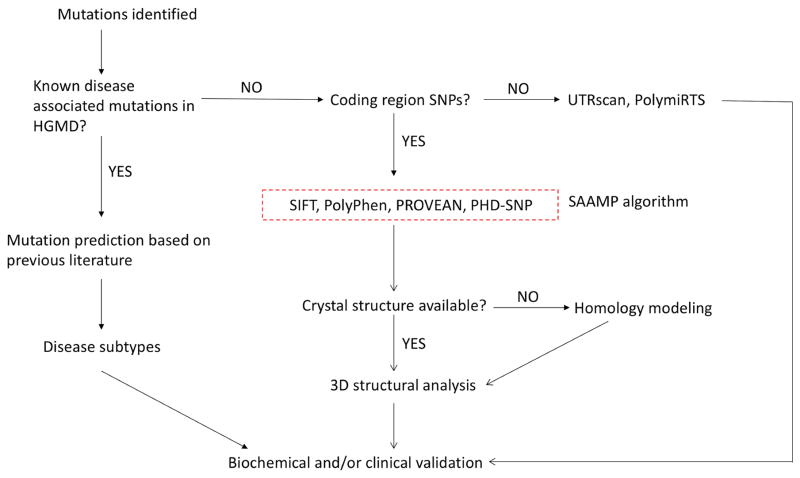
To this end, we utilized the bioinformatics tools to analyze mutations in the IDUA gene and established a guideline for predicting genotype-phenotype correlation of MPS I disease (Figure 1) [6]. More importantly, a SAAMP algorithm was established to predict the phenotype of amino acid changes by integrating prediction results of these 7 bioinformatics tools. When tested in the IDUA gene, the SAAMP algorithm yielded a sensitivity of 94% and a specificity of 80%. This model represents a readily accessible and reliable method to predict phenotype of a variety of monogenic diseases.
Figure 1.
The original guideline for phenotype prediction and unsolved problems.
However, as shown in Figure 1 (highlighted in red), there are still several unsolved problems. Q1: What is the performance of the SAAMP algorithm for other genes? Q2: Can this algorithm be used to predict phenotype severity (disease subtypes)? Q3: Which one of the 7 tools has the best or worst performance? Q4: What if the 3D structure has not been solved? Q5: How to deduce phenotype severity in more complicated scenarios? To answer these questions and optimize the guideline and SAAMP algorithm, we first evaluated the performances of these tools in a broad array of genes, and optimized the SAAMP algorithm by excluding those with poor performances. Further, by homology modeling, we built the 3D model of IDS, a lysosomal enzyme without solved crystal structures, which enables further structural analysis. Additionally, we investigated the phenotype severity (disease subtypes) of the GLB1 gene, and proposed a theory to explain its complicated genotype-phenotype correlation. In summary, this study updated the guideline and established an optimized version of SAAMP: SAAMP 2.0, which can predict outcomes of mutations more accurately.
2. Materials and methods
2.1 Dataset
Known disease-associated mutations were obtained from The Human Gene Mutation Database (http://www.hgmd.cf.ac.uk/ac/index.php). The benign polymorphisms were obtained from the NCBI dbSNP (http://www.ncbi.nlm.nih.gov/snp/) and previous literature. A variety of genes responsible for different lysosomal diseases were analyzed in this study and listed here. IDUA, mucopolysaccharidosis type I (MPS I); IDS, MPS II; GLB1, GM1 gangliosidosis or Morquio disease, type B (MDB); HEXA, Tay-Sachs disease; HEXB, Sandhoff disease; GBA, Gaucher disease; CTNS, cystinosis; GAA, Pompe disease; GUSB, MPS VII; SGSH, MPS IIIA; LIPA, lysosomal acid lipase deficiency.
2.2 Predicting Functional Context of Missense Mutation
A total of 7 bioinformatics tools were used as previously described [6]. These tools include: SIFT (http://sift.jcvi.org/), PolyPhen (http://genetics.bwh.harvard.edu/pph2/), I-Mutant (http://gpcr2.biocomp.unibo.it/cgi/predictors/I-Mutant3.0/I-Mutant3.0.cgi), PROVEAN (http://provean.jcvi.org/index.php), PANTHER (http://www.pantherdb.org/), SNPs&GO (http://snps.biofold.org/snps-and-go/snps-and-go.html), PHD-SNP (http://snps.biofold.org/phd-snp/phd-snp.html).
2.3 Modeling of mutant protein structures
I-TASSER (Iterative Threading ASSEmbly Refinement; http://zhanglab.ccmb.med.umich.edu/I-TASSER/) can reliably build the 3D structure model by using replica-exchanged Monte Carlo simulations [14]. The quality of predicted structure is estimated by I-TASSER in the form of confidence score (C-score). The C-score ranges from −5 to 2, with higher values depicting the high confidence for predicted models. A TM-score>0.5 highlights a model of correct topology and a TM-score <0.17 indicates a random similarity. Further, the Swiss-PDB viewer and Project Have yOur Protein Explained (HOPE; http://www.cmbi.ru.nl/hope/home) were used for analyzing structural impacts of these mutations as previously described [6].
3. Results
3.1 Genotype-phenotype correlation prediction by in silico approaches
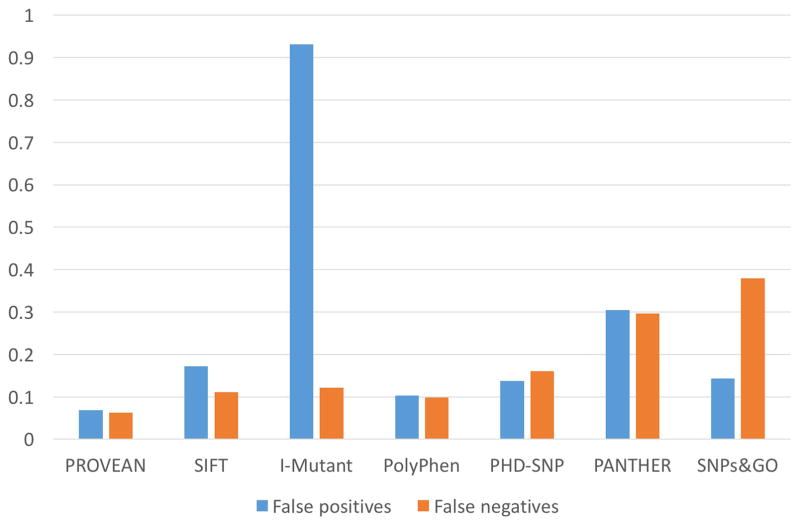
To solve Q1 and Q3 in Figure 1, we evaluated the performance of each tool in a variety of genes associated with lysosomal diseases. To evaluate the false negative rate of each tool, we submitted all 385 known disease-associated missense mutations of IDUA, IDS and GLB1 genes into these tools. There was a significant concordance between the prediction results by these 7 bioinformatics tools. Out of 385 known disease-causing mutations, 155 (40.3%) were predicted to be ‘damaging’ by all 7 tools and 197 (51.2%) were predicted to be ‘damaging’ by at least 6 tools. As shown in Figure 2, PROVEAN and PolyPhen turned out to be the most sensitive tools with 6.2% and 9.9% false negatives, respectively; where SNPs&GO and PANTHER had the highest false negative rates: 37.9% and 29.7%, respectively. Besides, PANTHER failed to give predictions of 18.7% mutations. Further, we submitted 29 benign amino acid substitutions of multiple genes associated with lysosomal diseases into these tools. PolyPhen and PROVEAN achieved the lowest false positive rates, 10.3% and 6.9%, respectively (Figure 2). Surprisingly, I-Mutant was associated with extremely high false positives (93.1%) with the binary prediction system. When the ternary prediction system was adopted, I-Mutant still had 69% false positive rate at the price of increasing the false negative rate. In addition, PANTHER failed to give predictions for 20.7% mutations and had the second highest false positive rates (30.4%). In summary, PROVEAN and PolyPhen provided the best performances in terms of both false negatives and false positives, while I-Mutant, SNPs&GO and PANTHER had the worst performances. Notably, the performances of each tool in different genes were similar, indicating the steady performance of these tools (data not shown). Further, no significant patterns were observed among the false positives and false negatives of each tool. This phenomenon is expected partly because these tools utilize quite different methodologies and algorithms.
Figure 2. Performance of each bioinformatics tool.
False negative percentage are calculated using known disease-causing mutations (amino acid substitutions only, n=385) of IDUA, IDS and GLB1 gene. False positive percentages are calculated using known benign polymorphism (amino acid substitutions only, n=29) of genes (CTNS, GAA, GBA, GLB1, GUSB, HEXA, HEXB, IDUA, IDS, LIPA and SGSH) associated with lysosomal diseases.
3.2 SAAMP algorithm 2.0
Due to the inherent false positives and negatives associated with each tool, combing different tools is expected to remarkably increase the accuracy. In our previous study [6], by integrating outcomes of these 7 tools (SIFT, PolyPhen, PROVEAN, PHD-SNP, PANTHER, SNPs&GO and I-Mutant), a SAAMP algorithm with a pathogenic index (PI) was developed. PI is defined as ratio of ‘damaging’ predictions from these 7 tools (ranging from 0 to 1), where the higher the PI is, the more pathogenic the mutation is. The cut-off value was set at 0.43. When PI was ≥ 0.43 (≥3 ‘damaging’ predictions), the mutation was defined as ‘pathogenic’, otherwise ‘benign’. When tested in the IDUA gene, a sensitivity of 94% and a specificity of 80% was achieved, which was better than any individual tool. In this study, by testing each tool in a total of 13 genes associated with LSDs (Figure 2), we determined the widely varying performances of these tools. Therefore, we decided to improve the performance of the SAAMP algorithm by excluding PANTHER, SNPs&GO and I-Mutant based on their modest performances. SAAMP 2.0 only included PROVEAN, PHD-SNP, SIFT and PolyPhen, and defined the cut-off value of PI as 0.5 (≥2 ‘damaging’ predictions). Notably, there was no specific sequential order for utilizing these 4 bioinformatics tools. Since the performances of the remaining four tools were quite similar, we treated each tool equally without giving different weights in SAAMP 2.0. This strategy also makes it easy and accessible to physicians or other researchers. SAAMP 2.0 yielded a total sensitivity of 94.9% (95.1% in IDS, 95.1% in IDUA and 94.3% in GLB1), and a specificity of 89.7%. Considering the importance of early diagnosis, even a seemingly small increase in sensitivity and specificity represents a significant improvement over the SAAMP 1.0 [6].
Since these bioinformatics tools are not specifically designed for an individual lysosomal disease, they cannot predict the phenotype severity (disease subtypes). Nonetheless, we investigated the possibility of using the SAAMP 2.0 algorithm to predict phenotype severity. Interestingly, there was a weak positive correlation (r2=0.043, p=0.02) between PI and phenotype severity in MPS II disease (IDS gene). However, there were no such correlations in the IDUA (p=0.16) or GLB1 (p=0.49) genes. When combining the results of all three genes, no significant correlation was observed (p=0.15). This discrepancy between IDS and the other two genes may be explained by the simplicity of genotype-phenotype correlation in the IDS gene. The IDS gene is involved in an X-linked disease associated with only 2 subtypes (attenuated and severe). In sharp contrast, IDUA and GLB1 are involved in autosomal recessive diseases associated with 3 or more subtypes, and many cases of compound heterogeneity. In summary, the PI may have the potential to be used as a predictor in diseases with simple genotype-phenotype correlation, but should be further assessed.
3.3 Phenotype severity of missense mutations in the GLB1 gene
Q4 is about whether we can deduce phenotype severity (disease subtypes) from previous literature in more complicated scenarios. The GLB1 gene is an ideal option because its deficiency causes two LSDs: GM1 gangliosidosis and MDB [17]. GM1 gangliosidosis is a primarily neurological disease, resulting from accumulation of GM1 gangliosides. Based on severity and onset of symptoms, GM1 gangliosidosis is classified into three major subtypes: infantile, juvenile and adult form. MDB, also known as mucopolysaccharidosis type IV B (MPS IVB), is mainly a skeletal disease, caused by accumulation of keratan sulfate. Both GM1 gangliosidosis and MDB are due to mutations in the GLB1 gene and subsequent deficiency of lysosomal enzyme β-Gal. The same active site of β-Gal releases terminal β,1-4 or β,1-3 linked galactose residues from GM1 gangliosides and keratan sulfate-derived oligosaccharides [17]. We analyzed the phenotypes (based on clinical/biochemical results) of patients in the original reports, and summarized phenotype severity of each mutation. The lack of enough information and consensus of phenotype severity makes it difficult to comprehensively evaluate reliability of the original reports. Accordingly, the severity predictions with relatively low reliability was highlighted with ‘*’ in Table 1. Similar analyses have been conducted with other genes associated with LSDs (data not shown).
Table 1. Phenotype severity deduction of mutations in the GLB1 gene through investigations of previous literature.
I, II and III represent infantile, juvenile and adult GM1 gangliosidosis, respectively. MDB represents Morquio disease, type B.
| Mutation | Phenotype | Mutation | Phenotype | Mutation | Phenotype | Mutation | Phenotype |
|---|---|---|---|---|---|---|---|
| p.Tyr36Ser | I | p.Cys230Arg | I | p.Tyr591Asn | I | p.Thr420Lys | III |
| p.Arg38Gly | I | p.Thr239Met | I | p.Tyr591Cys | I | p.Arg442Gln | III |
| p.Ile51Asn | I | p.Val240Met | I | p.Pro597Ser | I | p.Gly438Glu | III; MDB |
| p.Ser54Asn | I | p.Gln255His | I | p.Leu608Pro | I | p.Tyr83His | MDB |
| p.Ser54Ile | I | p.Tyr270Asp | I | p.Gly579Asp | I;II * | p.Tyr83Cys | MDB |
| p.Arg59His | I | p.Tyr270Phe | I | p.Arg49Cys | II | p.Trp273Leu | MDB |
| p.Arg59Cys | I | p.Gly272Asp | I | p.Arg68Gln | II | p.Trp273Arg | MDB |
| p.Arg68Trp | I | p.His281Tyr | I | p.His102Asp | II | p.Tyr333Cys | MDB |
| p.Leu69Pro | I | p.Tyr316Cys | I | p.Phe107Leu | II | p.Tyr485Cys | MDB |
| p.His112Pro | I | p.Thr329Ile | I | p.Cys127Tyr | II | p.Thr500Ala | MDB |
| p.Arg121Ser | I | p.Thr329Ala | I | p.Arg201Cys | II | p.Tyr64Phe | unknown |
| p.Gly123Arg | I | p.Asp332Asn | I | p.Cys230Tyr | II | p.Ser149Phe | unknown |
| p.Glu131Lys | I | p.Asp332Glu | I | p.Gly262Glu | II | p.Asp198Tyr | unknown |
| p.Met132Thr | I | p.Leu337Pro | I | p.Leu264Ser | II | p.Gly262Val | unknown |
| p.Gly134Val | I | p.Lys346Asn | I | p.Ala301Val | II | p.Gly311Arg | unknown |
| p.Pro136Ser | I | p.Tyr347Cys | I | p. Tyr333His | II | p.Asn318His | unknown |
| p.Lys142Gln | I | p.Pro397Ala | I | p.Leu389Pro | II | p.Tyr324Cys | unknown |
| p.Arg148Ser | I | p.Thr420Pro | I | p.Gln580Arg | II | p.Phe357Leu | unknown |
| p.Arg148His | I | p.Leu422Arg | I | p.Arg590His | II | p.Gln408Pro | unknown |
| p.Asp151Val | I | p.Asp441Asn | I | p.Glu632Gly | II | p.Ser434Leu | unknown |
| p.Asp151Tyr | I | p.Asp448Val | I | p.Leu155Arg | II, III | p.Val439Gly | unknown |
| p.Trp161Gly | I | p.Met480Val | I | p.Arg201His | II; MDB * | p.Tyr444Cys | unknown |
| p.Leu162Ser | I | p.Arg482His | I * | p.Arg49His | III | p.Arg457Gln | unknown |
| p.Leu173Pro | I | p.Arg482Cys | I | p.Ile51Thr | III | p.Asn484Lys | Unknown |
| p.Ile181Lys | I | p.Asp491Asn | I | p.Phe63Tyr | III | p.Gly494Ser | unknown |
| p.Gln184Arg | I | p.Asp491Tyr | I | p.Lys73Glu | III | p.Trp509Cys | unknown |
| p.Gly190Asp | I | p.Gly494Val | I | p.Thr82Met | III | p.Gly554Glu | unknown |
| p.Ser191Asn | I | p.Gly494Cys | I | p.Arg148Cys | III | p.Arg590Ser | unknown |
| p.Tyr199Cys | I | p.Pro549Leu | I | p.Asp214Tyr | III | p.Cys626Arg | unknown |
| p.Arg208Cys | I | p.Lys578Arg | I | p.Pro263Ser | III | ||
| p.Val216Ala | I | p.Arg590Cys | I | p.Asn266Ser | III |
was added to predictions with relatively low reliability.
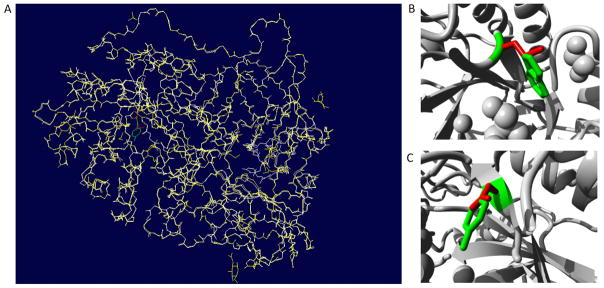
To gain further insights into the impact of the mutations, we extracted the structure of β-Gal from the PDB database (ID 3wf2) [18], and conducted structural analyses. β-Gal forms a homodimer, and it has three domains: β domain 1 (amino acid 397–514), β domain 2 (545–647) and TIM barrel domain (49–359). TIM barrel domain is catalytic domain with the active site in the core. Based on results in Table 1, mutations responsible for a certain disease subtype were scattered through all domains. It was shown that the active site is comprised of Tyr83, Ile126, Cys127, Ala128, Glu129, Asp187, Glu188, Glu268, Tyr270, Trp273, Leu274, Tyr306, Tyr331 and Tyr333 [19]. Out of these amino acids, Glu188 and Glu268 were responsible for the catalytic reaction, while Tyr83, Ala128, Glu129, Asp187 and Tyr333 were involved in ligand recognition. Mutations in the active site led to different subtypes including infantile, juvenile GM1 gangliosidosis and MDB. To further analyze the structural impact of mutations, we built 3D models of 4 representative mutated proteins by SWISS-MODEL, using the native structure as the template. SWISS-MODEL is a fully automated protein structure homology modelling server [20]. Superimposition of native protein and mutant were investigated with Swiss-PDB viewer (Figure 3A). RMSD values between the native and each mutant structures are <0.5 Å, indicating a minor structural change due to these mutations. Further, Project Hope revealed the 3D structure of the mutants, and described the physiochemical properties of specific mutations. p.Tyr270Asp, a mutation at a 100% conserved site, was found to cause infantile GM1 gangliosidosis. p.Tyr270Asp introduced a charge in the buried residue, which could lead to protein folding problems (Figure 3C). This mutation could also cause loss of hydrophobic interaction and empty space within the core of the protein. More importantly, Tyr270 was located in the active site, and also interacted with Glu268, which was the catalytic nucleophile. Therefore, p.Tyr270Asp could affect the catalytic activity of Glu268, and thus cause a complete loss of enzyme activity. p.Cys127Tyr, another mutation at a 100% conserved amino acid within the active site, was found to cause juvenile GM1 gangliosidosis. The mutant residue (tyrosine) was bigger than the wild-type residue (cysteine). Since the cysteine residue was buried in the core of the protein, the mutant residue was bigger and probably would not fit. This mutation would also cause loss of hydrophobic interactions within the core of the protein. p.Arg49His, a mutation outside the active site, was found to cause adult GM1 gangliosidosis. The charge of the wild-type residue was lost by this mutation, which could cause loss of interactions with other molecules. Additionally, the mutant residue was smaller than the wild-type residue, which would cause a possible loss of external interactions. p.Trp273Leu was the most frequently reported mutation associated with MDB. Trp273 was located in the entrance of the ligand binding pocket (Figure 3B). Together with Tyr270 and Leu274, it covered the pocket by interacting with the ligand. Introducing a residue with a smaller side chain, e.g., Leucine, the ligand could not be effectively covered in the proper position, leading to loss of enzyme activity.
Figure 3. Superimposed structure of native protein with modeled mutant protein for D349G.
(A) Overall structure of the superimposed model. Native protein in white (cartoon shape), mutant protein in yellow, wild type residue (Trp273) in green, and mutated residue (Leu273) in red. Close-up view of the superimpose model of p.Trp273Leu (B) and p.Tyr270Asp (C). Main protein backbone in gray, wild type residue in red, and mutated residue in yellow.
3.4 Homology modeling to build 3D structure models
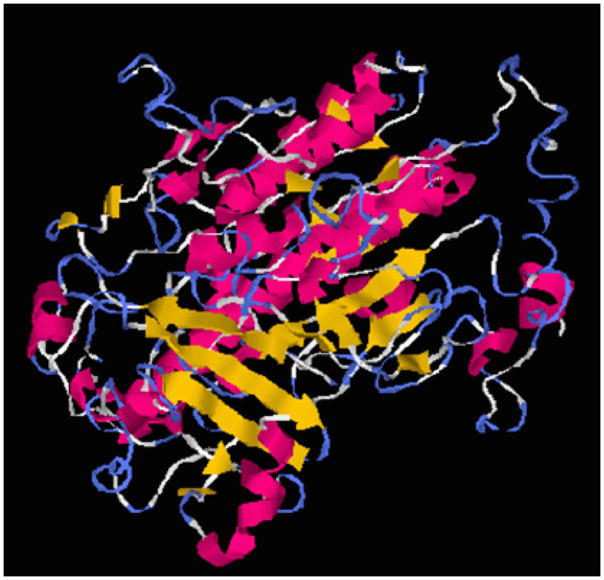
Several 3D models of the IDS protein have been proposed [21–25], but its crystal structure has not been solved yet. To establish a readily accessible and easy-to-use homology modeling method, we generated a 3D model of IDS with I-TASSER, which is a hierarchical approach for protein structure and function prediction. I-TASSER can identify structural templates from the PDB, construct atomic models, and derive function insights of the target. The I-TASSER tool created the 5 full-length models for the IDS protein (with C-scores: −1.44, −1.68, −1.89, −1.86 and −1.8) by excising top 10 structures with C-scores after targeting the PDB library hits (Table 2). Among the 5 predicted models, model 1 carried the high-quality confidence in terms of C-score (−1.44), TM-score (0.54 ± 0.15), and the RMSD (10.9 ± 4.6Å). The structure of model 1 (Figure 4) consisted of α/β folds, and also contained two antiparallel β-sheets (4 β strands with each sheet) with α helixes around them. The active site was located in the loop region near the N-terminal β-strand, and the putative active site was comprised of Asp45, Asp46, Cys84, Lys135 and Asp334 residues. By establishing the 3D model, structural analysis can be performed in a similar manner as β-gal in section 3.3.
Table 2. Top 10 templates used by I-TASSER to create the high quality models for human IDS secondary structure.
Ident1 is the percentage sequence identity of the templates in the threading aligned region with the query sequence. Ident2 is the percentage sequence identity of the whole template chains with query sequence. Cov represents the coverage of the threading alignment and is equal to the number of aligned residues divided by the length of query protein. Norm.Z-score is the normalized Z-score of the threading alignments. Alignment with a Norm.Z-score > 1 mean a good alignment and vice versa.
| Rank | PDB hit | Iden1 | Iden2 | Cov. | Norm.Z-score |
|---|---|---|---|---|---|
| 1 | 4ug4A | 0.25 | 0.28 | 0.79 | 2.84 |
| 2 | 4uplA | 0.22 | 0.24 | 0.81 | 5.09 |
| 3 | 2vqrA | 0.21 | 0.24 | 0.83 | 4.13 |
| 4 | 1hdhA | 0.2 | 0.22 | 0.81 | 2.16 |
| 5 | 4uphA | 0.21 | 0.23 | 0.82 | 4.82 |
| 6 | 1hdhA | 0.19 | 0.22 | 0.81 | 3.11 |
| 7 | 2qzuA | 0.22 | 0.21 | 0.77 | 5.12 |
| 8 | 4uphA | 0.22 | 0.23 | 0.82 | 3.34 |
| 9 | 4uphA | 0 | 0.23 | 0.82 | 2.19 |
| 10 | 4uphA | 0.21 | 0.23 | 0.82 | 5.31 |
Figure 4.
3D structure model of IDS built by homology modeling with I-TASSER.
4. Discussion
4.1 Updated guideline
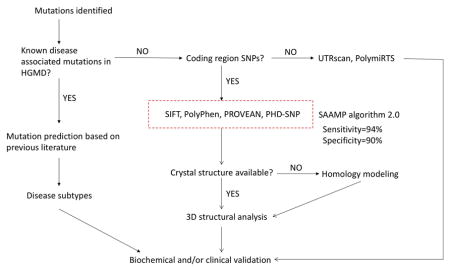
Collectively, by answering the 5 questions listed in Figure 1, the protocol for phenotype prediction proposed was optimized and might be generalized to all monogenic diseases. Therefore, a revised protocol for phenotype prediction was proposed and illustrated in Figure 5. When a mutation is identified, 1) if it is a known disease-associated mutation, refer to original publications to deduce phenotype severity; 2) if not, conduct the in silico analysis of novel mutations.
Figure 5.
The updated guideline for phenotype prediction.
SAAMP 2.0 has been shown to accurately and reliably predict phenotype based on genotype in a variety of genes, and may be applied in most monogenic diseases. Notably, the major limitation of SAAMP is that it can only predict whether a mutation will be ‘pathogenic’ or ‘benign’, but cannot predict specific subtypes (e.g., Hurler, Hurler-Scheie, or Scheie in MPS I disease). Further refinement is necessary to improve its ability in predicting disease subtypes. In a compound heterozygote with one mutation on each allele, SAAMP algorithm can be used to predict phenotype of each mutation first. Then, valuable inferences about the phenotype of patients can be made, which are essential for early diagnosis and proper treatment allocation. For instance, if both mutations are predicted to be ‘pathogenic’, then the patient phenotype is expected to be ‘disease’. If only one mutation is predicted to be ‘pathogenic’, then the patient phenotype is expected to be ‘normal’ (autosomal recessive) or ‘disease’ (autosomal dominant). If both mutations are predicted to be ‘benign, then the phenotype is expected to be ‘normal’. Further confirmation should be conducted through biochemical and/or clinical analyses. Future refinements of this protocol can be conducted by investigating amino acid substitutions that can affect transcriptional and splicing regulation. For instance, ESEfinder (rulai.cshl.edu/ESE) [26] and FAS-ESS (genes.mit.edu/fas-ess/) [27] can predict the impact of mutations on splicing.
4.2 Hypothesis about predicting type I, II, III or MDB
Generally speaking, the higher the residual enzyme activity is, the less severe the phenotype is. However, the residual enzyme activity cannot predict the disease subtypes caused by mutations in the GLB1 gene. This may result from the use of artificial substrates in the enzyme assay, which cannot accurately replicate enzyme reaction with natural substrates under physiological conditions. Also, it is likely that modifier genes can alter enzyme activity and thereby disease severity [17]. Based results presented in this study and previous findings, we developed a theory to explain the relationship between mutations and specific disease subtypes. Infantile GM1 (<1% of wildtype enzyme activity) represents almost complete loss of activities degrading all substrates including GM1 gangliosides and keratan sulfate. This is supported by the fact that in addition to neurological disorders, infantile has significant skeletal abnormalities [28] and accumulation of keratan sulfate [29]. Additional evidence is that most nonsense mutations lead to infantile GM1 gangliosidosis. Juvenile (1–10%) and adult GM1 (5–10%) represent reduced activities degrading GM1 gangliosides only. These mutations mainly affect the ligand binding of GM1 gangliosides or association of activator protein (e.g., saposin B). MDB (2–12%) represents reduced activities degrading keratan sulfate only. These mutations mainly affect the ligand binding of keratan sulfate, which is thought to be favored over GM1 gangliosides [17]. For similar reasons, mutations affecting the stability of the proteins have more impact on degradation of GM1 gangliosides than keratan sulfate. It also explains why the worldwide incidence of MDB was less compared with GM1 gangliosidosis [30]. Further, there is an alternative spliced product of GLB1 gene, elastin/laminin-binding protein (EBP). Loss of EBP function may be responsible for cardiomyopathy in GM1 gangliosidosis [31]. Therefore, if the mutations occur in the common region between EBP and β-gal, there might be a loss of EBP function and cardiomyopathy, which warrants extra attention.
Acknowledgments
This work is supported by NIH grant P01HD032652. Dr. Li Ou is a fellow of the Lysosomal Disease Network (U54NS065768). The Lysosomal Disease Network is a part of the Rare Diseases Clinical Research Network (RDCRN), an initiative of the Office of Rare Diseases Research (ORDR), and NCATS. This consortium is funded through a collaboration between NCATS, the National Institute of Neurological Disorders and Stroke (NINDS), and the National Institute of Diabetes and Digestive and Kidney Diseases (NIDDK).
Footnotes
Conflict of interest statement: All authors have no potential conflict of interest to declare.
References
- 1.Fuller M, Meikle PJ, Hopwood JJ. Epidemiology of lysosomal storage diseases: an overview. In: Mehta A, Beck M, Sunder-Plassmann G, editors. Fabry Disease: Perspectives from 5 Years of FOS. Chapter 2. Oxford: Oxford PharmaGenesis; 2006. [PubMed] [Google Scholar]
- 2.Meikle PJ, Hopwood JJ, Clague AE, Carey WF. Prevalence of lysosomal storage disorders. JAMA. 1999;281:249–254. doi: 10.1001/jama.281.3.249. [DOI] [PubMed] [Google Scholar]
- 3.Neufeld EF, Muenzer J. The mucopolysaccharidoses. In: Scriver CR, et al., editors. The metabolic and molecular bases of inherited disease. McGraw-Hill; New York: 2001. pp. 3421–3452. [Google Scholar]
- 4.D’Aco K, Underhill L, Rangachari L, et al. Diagnosis and treatment trends in mucopolysaccharidosis I: findings from the MPS I Registry. Eur J Pediatr. 2012;171:911–919. doi: 10.1007/s00431-011-1644-x. [DOI] [PMC free article] [PubMed] [Google Scholar]
- 5.Scott CR, Elliott S, Buroker N, et al. Identification of infants at risk for developing Fabry, Pompe, or mucopolysaccharidosis-I from newborn blood spots by tandem mass spectrometry. J Pediatr. 2013;163:498–503. doi: 10.1016/j.jpeds.2013.01.031. [DOI] [PMC free article] [PubMed] [Google Scholar]
- 6.Ou L, Przybilla MJ, Whitley CB. Phenotype prediction for mucopolysaccharidosis type I by in silico analysis. Orphanet J Rare Dis. 2017;12:125. doi: 10.1186/s13023-017-0678-1. [DOI] [PMC free article] [PubMed] [Google Scholar]
- 7.Ng PC, Henikoff S. Predicting deleterious amino acid substitutions. Genome Res. 2001;11:863–874. doi: 10.1101/gr.176601. [DOI] [PMC free article] [PubMed] [Google Scholar]
- 8.Adzhubei IA, Schmidt S, Peshkin L, et al. A method and server for predicting damaging missense mutations. Nat Methods. 2010;7:248–249. doi: 10.1038/nmeth0410-248. [DOI] [PMC free article] [PubMed] [Google Scholar]
- 9.Bava KA, Gromiha MM, Uedaira H, Kitajima K, Sarai A. ProTherm, version 4.0: thermodynamic database for proteins and mutants. Nucleic Acids Res. 2004;32:D120–121. doi: 10.1093/nar/gkh082. [DOI] [PMC free article] [PubMed] [Google Scholar]
- 10.Choi Y, Sims GE, Murphy S, Miller JR, Chan AP. Predicting the functional effect of amino acid substitutions and indels. PLoS One. 2012;7:e46688. doi: 10.1371/journal.pone.0046688. [DOI] [PMC free article] [PubMed] [Google Scholar]
- 11.Mi H, Guo N, Kejariwal A, Thomas PD. PANTHER version 6: protein sequence and function evolution data with expanded representation of biological pathways. Nucleic Acids Res. 2007;35:D247–252. doi: 10.1093/nar/gkl869. [DOI] [PMC free article] [PubMed] [Google Scholar]
- 12.Calabrese R, Capriotti E, Fariselli P, Martelli PL, Casadio R. Functional annotations improve the predictive score of human disease-related mutations in proteins. Hum Mutat. 2009;30:1237–1244. doi: 10.1002/humu.21047. [DOI] [PubMed] [Google Scholar]
- 13.Capriotti E, Fariselli P, Casadio R. I-Mutant 2.0: predicting stability changes upon mutation from the protein sequence or structure. Nucleic Acids Res. 2005;33:W306–310. doi: 10.1093/nar/gki375. [DOI] [PMC free article] [PubMed] [Google Scholar]
- 14.Yang J, Yan R, Roy A, Xu D, Poisson J, Zhang Y. The I-TASSER Suite: Protein structure and function prediction. Nat Methods. 2015;12:7–8. doi: 10.1038/nmeth.3213. [DOI] [PMC free article] [PubMed] [Google Scholar]
- 15.Guex N, Peitsch MC, Schwede T. Automated comparative protein structure modeling with SWISS-MODEL and Swiss-PdbViewer: A historical perspective. Electrophoresis. 2009;30:S162–173. doi: 10.1002/elps.200900140. [DOI] [PubMed] [Google Scholar]
- 16.Venselaar H, Te Beek TA, Kuipers RK, Hekkelman ML, Vriend G. Protein structure analysis of mutations causing inheritable diseases. An e-Science approach with life scientist friendly interfaces. BMC Bioinformatics. 2010;11:548. doi: 10.1186/1471-2105-11-548. [DOI] [PMC free article] [PubMed] [Google Scholar]
- 17.Callahan JW. Molecular basis of GM1 gangliosidosis and Morquio disease, type B. Structure-function studies of lysosomal beta-galactosidase and the non-lysosomal beta-galactosidase-like protein. Biochim Biophys Acta. 1999;1455:85–103. doi: 10.1016/s0925-4439(99)00075-7. [DOI] [PubMed] [Google Scholar]
- 18.Suzuki H, Ohto U, Higaki K, et al. Structural basis of pharmacological chaperoning for human β-galactosidase. J Biol Chem. 2014;289:14560–14568. doi: 10.1074/jbc.M113.529529. [DOI] [PMC free article] [PubMed] [Google Scholar]
- 19.Ohto U, Usui K, Ochi T, Yuki K, Satow Y, Shimizu T. Crystal structure of human β-galactosidase: structural basis of Gm1 gangliosidosis and morquio B diseases. J Biol Chem. 2012;287:1801–1812. doi: 10.1074/jbc.M111.293795. [DOI] [PMC free article] [PubMed] [Google Scholar]
- 20.Biasini M, Bienert S, Waterhouse A, et al. SWISS-MODEL: modelling protein tertiary and quaternary structure using evolutionary information. Nucleic Acids Res. 2014;42:W252–258. doi: 10.1093/nar/gku340. [DOI] [PMC free article] [PubMed] [Google Scholar]
- 21.Saito S, Ohno K, Okuyama T, Sakuraba H. Structural Basis of Mucopolysaccharidosis Type II and Construction of a Database of Mutant Iduronate 2-Sulfatases. PLoS One. 2016;11:e0163964. doi: 10.1371/journal.pone.0163964. [DOI] [PMC free article] [PubMed] [Google Scholar]
- 22.Kato T, Kato Z, Kuratsubo I, et al. Mutational and structural analysis of Japanese patients with mucopolysaccharidosis type II. J Hum Genet. 2005;50:395–402. doi: 10.1007/s10038-005-0266-4. [DOI] [PubMed] [Google Scholar]
- 23.Sukegawa-Hayasaka K, Kato Z, Nakamura H, et al. Effect of Hunter disease (mucopolysaccharidosis type II) mutations on molecular phenotypes of iduronate-2-sulfatase: enzymatic activity, protein processing and structural analysis. J Inherit Metab Dis. 2006;29:755–761. doi: 10.1007/s10545-006-0440-7. [DOI] [PubMed] [Google Scholar]
- 24.Kim CH, Hwang HZ, Song SM, et al. Mutational spectrum of the iduronate 2-sulfatase gene in 25 unrelated Korean Hunter syndrome patients: Identification of 13 novel mutations. Hum Mutat. 2003;21:449–450. doi: 10.1002/humu.9128. [DOI] [PubMed] [Google Scholar]
- 25.Parkinson-Lawrence E, Turner C, Hopwood J, Brooks D. Analysis of normal and mutant iduronate-2-sulphatase conformation. Biochem J. 2005;386:395–400. doi: 10.1042/BJ20040739. [DOI] [PMC free article] [PubMed] [Google Scholar]
- 26.Smith PJ, Zhang C, Wang J, Chew SL, Zhang MQ, Krainer AR. An increased specificity score matrix for the prediction of SF2/ASF-specific exonic splicing enhancers. Hum Mol Genet. 2006;15:2490–2508. doi: 10.1093/hmg/ddl171. [DOI] [PubMed] [Google Scholar]
- 27.Wang Z, Rolish ME, Yeo G, Tung V, Mawson M, Burge CB. Systematic identification and analysis of exonic splicing silencers. Cell. 2004;119:831–845. doi: 10.1016/j.cell.2004.11.010. [DOI] [PubMed] [Google Scholar]
- 28.Regier DS, Tifft CJ. GLB1-Related Disorders. In: Adam MP, Ardinger HH, Pagon RA, Wallace SE, Bean LJH, Mefford HC, Stephens K, Amemiya A, Ledbetter N, editors. SourceGeneReviews® [Internet] Seattle (WA): University of Washington, Seattle; pp. 1993–2017. [PubMed] [Google Scholar]
- 29.Yutaka T, Okada S, Kato T, Yabuuchi H. Impaired degradation of keratan sulfate in GM1-gangliosidosis. Clin Chim Acta. 1982 Oct 27;125(2):233–40. doi: 10.1016/0009-8981(82)90199-1. [DOI] [PubMed] [Google Scholar]
- 30.Caciotti A, Garman SC, Rivera-Colón Y, et al. GM1 gangliosidosis and Morquio B disease: an update on genetic alterations and clinical findings. Biochim Biophys Acta. 2011 Jul;1812(7):782–90. doi: 10.1016/j.bbadis.2011.03.018. [DOI] [PMC free article] [PubMed] [Google Scholar]
- 31.Caciotti A, Donati MA, Procopio E, et al. GM1 gangliosidosis: molecular analysis of nine patients and development of an RT-PCR assay for GLB1 gene expression profiling. Hum Mutat. 2007;28:204. doi: 10.1002/humu.9475. [DOI] [PubMed] [Google Scholar]


