Abstract
The prefrontal cortex (PFC) is usually defined as the frontal cortical area receiving a mediodorsal thalamic innervation. Certain areas in the medial wall of the rat frontal area receive an MD innervation. A second frontal area that is the target of MD projections is located dorsal to the rhinal sulcus and often referred to as the orbitofrontal cortex (OFC). Both the mPFC and OFC are comprised of a large number of cytoarchitectonic regions. We assessed the afferent innervation of the different areas of the OFC, with a focus on projections arising from the mediodorsal thalamic nucleus, the basolateral nucleus of the amygdala, and the midbrain dopamine neurons. Although there are specific inputs to various OFC areas, a simplified organizational scheme could be defined, with the medial areas of the OFC receiving thalamic inputs, the lateral areas of the OFC being the recipient of amygdala afferents, and a central zone that was the target of midbrain dopamine neurons. Anterograde tracer data were consistent with this organization of afferents, and revealed that the OFC inputs from these three subcortical sites were largely spatially segregated. This spatial segregation suggests that the central portion of the OFC (pregenual agranular insular cortex) is the only OFC region that is a prefrontal cortical area, analogous to the prelimbic cortex in the medial prefrontal cortex. These findings highlight the heterogeneity of the OFC, and suggest possible functional attributes the three different OFC areas.
Keywords: agranular insular cortex, basolateral amygdala, dopamine, mediodorsal thalamus, orbitofrontal cortex, prefrontal cortex, RRID: AB_231637, RRID: AB_2314408, RRID: AB_90755, RRID: AB_572268
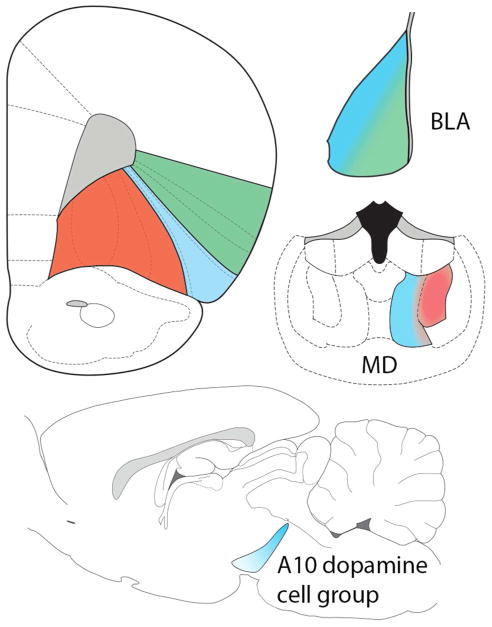
Graphical Abstract
We assessed the organization of afferents to the orbitofrontal cortex (OFC), focusing on projections from the thalamus, amygdala, and the midbrain dopamine neurons. Although specific inputs to certain architectonically-defined OFC areas were identified, a simplified organization was evident: medial OFC areas receive mediodorsal thalamic inputs, lateral areas of the OFC are the target of basolateral amygdala projections, and a central zone is innervated by caudal midbrain dopamine neurons.
Since the pioneering work of Rose and Woolsey (1948a,b), who posed the question “can … a projection area be regarded as a cortical field?”, the framework for defining the prefrontal cortex (PFC) has been based on the projections of the mediodorsal thalamic nucleus (MD) (Groenewegen, 1988, Hoover and Vertes, 2007; Krettek and Price, 1977b; Leonard, 1969; Ray and Price, 1992; see Carlen, 2017). Although other thalamic nuclei also innervate various areas in the frontal lobe (Domesick, 1972; Groenewegen, 1988; Hoover and Vertes, 2007; Krettek & Price, 1977b), the MD projection remains central to defining the PFC. In the rat, the MD projects to the prelimbic (area 32) and pregenual cingulate (area 24b) cortices in the medial wall of the hemisphere, and to a ventrolateral frontal region located dorsal to the rhinal sulcus (Groenewegen, 1988, Hoover and Vertes, 2007; Krettek and Price, 1977b; Leonard, 1969; Ray and Price, 1992).
Extra-thalamic nuclei also innervate the frontal cortex, overlapping the distribution of MD axons. Krettek and Price (1974) first reported that the basolateral amygdala (BLA) of the rat projects to the frontal cortex. Although these BLA-derived afferents to the frontal cortex extend outside of areas innervated by the MD, both MD and BLA neurons innervate the prelimbic cortex (Divac et al., 1978a). Similarly, Beckstead (1976) and Divac et al. (1978b) reported that both the MD and the midbrain ventral tegmental area (VTA) project to the prelimbic and pregenual cingulate cortices. Based on these and other data, Divac and colleagues (1978a,b) suggested that the convergence of MD, BLA, and dopaminergic VTA afferents defines the PFC across species.
The ventral midbrain projection to the medial PFC (mPFC) originates from dopaminergic and non-dopaminergic neurons that are located in the VTA (Mingote et al., 2015; Phillipson, 1979; Root et al., 2016; Seroogy et al., 1988; Swanson, 1982; Taylor et al., 2014). The mPFC dopamine innervation was first described and characterized more than 40 years ago (Beckstead, 1976; Berger et al., 1976; Bunney and Aghajanian, 1976; Fuxe et al., 1974; Hökfelt et al., 1974; Lindvall and Bjorklund, 1974; Thierry et al., 1973), and over the ensuing years has been the subject of intense scrutiny. The sustained interest in the mPFC is in part is attributable to dysfunction of the PFC in schizophrenia and other neuropsychiatric disorders (Abi-Dargham, 2014; Bolkan et al., 2016; Davis et al., 1991; Deutch, 1992; Kambeitz et al., 2014).
In contrast to the mPFC, there have been relatively few anatomical studies of the orbitofrontal cortex (OFC) (Gerfen and Clavier, 1979; Hoover and Vertes, 2011; Kalsbeek et al., 1988; Thompson et al., 2017; van der Werd and Uylings, 2008; van der Werd et al., 2010; van Eden et al., 1987), despite a renewed interest in the behavioral attributes of the OFC (Fettes et al., 2017; Izquierdo, 2017; Padoa-Schioppa and Conen, 2017; Rich et al., 2017; Schoenbaum et al., 2016; Zald and Rauch, 2006). Unfortunately, many functional studies operationally define the OFC rather than adhere to a common nomenclature based on cytoarchitectonics or other criteria. In particular, the designation of the ventrolateral frontal cortical area commonly referred to as the OFC seems to vary across authors as well as across cytoarchitectonic boundaries. Moreover, it is not known if the projections of the MD, BLA, and midbrain dopamine cells converge in the OFC.
Although there have been a small number of studies defining afferents to discrete fields within the OFC (Alcaraz et al., 2016; Chandler et al., 2013; Gerfen and Clavier, 1979; Hoover and Vertes, 2011; Mátyás et al., 2004; Reep and Winans, 1982; Reep et al., 1996), no contemporary examination has determined the inputs to different areas across the OFC. We therefore examined the afferent organization of the rat OFC. In addition, we determined if thalamic, amygdaloid, or midbrain neurons collateralize to innervate both the OFC and mPFC. Finally, we assessed if the MD, BLA, and midbrain dopamine inputs converge in the OFC, or if these inputs are spatially segregated.
Methods
Animals
Adult male Sprague-Dawley rats (Envigo; Indianapolis, IN) were group-housed with food and water available ad libitum. All experiments were performed in accordance with the Guide for the Care and Use of Laboratory Animals as promulgated by the National Institutes of Health and under the oversight of the Vanderbilt University Institutional Animal Care and Use Committee.
Tracer Deposition
24 animals received retrograde tracer deposits into various sites in the OFC. Both Fluoro-Gold (FG; Fluorochrome, Denver, CO) and AlexaFluor 555-conjugated cholera toxin subunit B (CTB; ThermoFisher Scientific, Waltham, MA) were used. In two of the animals the tracer ejection failed, and in three others a deposit was seen but no transport, resulting in 19 cases being analyzed. Fluoro-Gold was iontophoretically deposited through fiber-filled pipettes (15–25 μm tip diameter) by applying +2.0 μA current for 15 min (7 sec on/off). Cholera toxin B (75 nl of a 1.5% solution in .05M phosphate buffer, pH 7.4) was injected through a 27g cannula at a rate of 25 nL/min. In eight animals, the two different retrograde tracers were deposited into the medial PFC and OFC, which allowed us to determine if single neurons in the thalamus, amygdala, or brainstem collateralize to innervate both the mPFC and OFC. In most of these cases FG was iontophoretically deposited into the mPFC and CTB was injected into the OFC.
Anterograde tracing experiments (N=13) were performed to determine if the MD, BLA, and dopamine neurons of the midbrain sent convergent axonal projections to the OFC. In these cases, MiniRuby (lysine-fixable tetramethylrhodamine-conjugated biotinylated dextran amine, 10,000 MW; Molecular Probes, Waltham, MA; 10% in 10mM sodium phosphate buffer) was iontophoretically deposited (+5.0 μA (pulsed 7sec on/off) for 30 min through micropipette tips of 15–30 μm diameter) into the MD or BLA, and MiniEmerald (lysine-fixable flourescein-conjugated biotinylated dextran amine, 10,000 MW (Molecular Probes)) into the other subcortical site. The contribution of the midbrain dopamine neurons was evaluated by examining the distribution of tyrosine hydroxylase (TH)-immunoreactive (-ir) axons in the OFC (see Noack and Lewis, 1989).
Seven to ten days post-operatively, animals were overdosed with isofluorane and transcardially perfused with phosphate-buffered saline (pH 7.4) followed by 4% paraformaldehyde in phosphate-buffered saline. Brains were removed and post-fixed in 4% paraformaldehyde before being cryoprotected in 30% sucrose. Frozen sections were then cut at 40μm and collected into six alternating sets.
Immunohistochemical procedures
Both immunofluorescence and immunoperoxidase methods were used. The latter material was used for charting of retrograde tracer deposits. Fluorescence procedures were used to examine the termination areas within the OFC of projections originating in the MD, BLA, and VTA and potential collateralization of afferent neurons, as well as the percentage of midbrain cells innervating the OFC that are dopaminergic.
Sections stained using immunoperoxidase methods were incubated in methanolic peroxide for 20 min, washed in 50 mM Tris-buffered saline (TBS), and blocked in TBS containing 4% normal horse serum (Gibco; ThermoFisher Scientific) and 0.2% Triton X-100 (TBS++) before being incubated in the primary antibody overnight at room temperature. Sections were then washed repeatedly in TBS++ and incubated in biotinylated secondary antibody in TBS++ (1:1000; Jackson ImmunoResearch, West Grove, PA) for 2 hours at room temperature, washed, and incubated in HRP-conjugated streptavidin (1:1600; Jackson ImmunoResearch) prepared in TBS containing 0.2% Triton X-100 for 90 minutes. After being washed, sections were developed in a 0.025% diaminobenzidine tetrahydrochloride (DAB) solution in TBS containing 1.5% nickel ammonium sulfate and 0.15% cobalt chloride with 0.0009% hydrogen peroxide, resulting in a blue-black reaction product. Sections were then mounted onto subbed slides, cleared, and coverslipped.
In cases involving immunofluorescent detection, sections were incubated in the primary antibody overnight, after which they were washed and placed in a secondary antibody conjugated to either Alexa 488, Cy3, or Alexa 647 (all 1:1200, Jackson ImmunoResearch) for two hours. Sections were then washed and mounted in Prolong Antifade (ThermoFisher Scientific, Waltham, MA). In material stained to visualize TH-ir axons, sections were pretreated in 0.25% trypsin (Sigma-Aldrich, St. Louis, MO) for 7 min at 37°C, and the fluorescently-conjugated secondary antibody was used at a 1:1500 dilution.
Images were acquired and charted using a Nikon Eclipse Ni-U microscope. The brightness and contrast of some figures was adjusted; in all cases in which these parameters were modified the entire image was adjusted.
Antibodies
We used a rabbit anti-Fluoro-Gold (FG) antibody (Lot 529600, RRID: AB_2314408) from Fluorochrome (Denver, CO) at a dilution of 1:50,000 for immunoperoxidase localization of retrogradely-labeled cells (see Table 1). Endogenous FG fluorescence under UV illumination was present in almost all cells that were FG-imuunoreactive (-ir); the FG antibody did not detect cells that were not endogenously fluorescent. A goat anti-cholera toxin, subunit B (CTB) antibody (List Biological Laboratories, Campbell, CA; #703, Lot 7032AA, RRID: AB_231637) was used at a dilution of 1:9,000 to reveal retrogradely-labeled cells. No CTB-ir neurons were observed in tissue from animals that did not receive a CTB tracer injection.
Table 1.
Primary Antibodies
| Antigen | Immunogen | Source | Manufacturer | Dilution |
|---|---|---|---|---|
| Cholera Toxin, subunit B | choleragenoid | goat, polyclonal | List Biologicals, #903, RRID: AB_231637 | 1:9,000 |
| Fluoro-Gold | Fluoro-Gold (hydroxystilbamidine) | rabbit, polyclonal | Fluorochrome, RRID: AB_2314408 | 1:50,000 (immunoperoxidase) 1:20,000 (immunofluorescence) |
| Tyrosine Hydroxylase (TH) | native TH from rat pheochromocytoma | sheep, polyclonal | Millipore, AB1542, RRID: AB_90755 | 1:1,000 |
| Tyrosine Hydroxylase (TH) | TH purified from rat PC12 cells | mouse, monoclonal | Immunostar, 22941, RRID: AB_572268 | 1:6,000 |
In order to visualize the dopaminergic innervation of the OFC and to identify retrogradely-labeled midbrain cells that were dopaminergic, we used one of two different tyrosine hydroxylase (TH) antibodies. One was a mouse anti-TH antibody (ImmunoStar, Hudson, WI; 22941, Lot 907001, RRID: AB_572268), which was used at a dilution of 1:6000. According to the vendor characterization, a western blot of HEK293 cells transfected with TH shows a single band of the anticipated mass, and the antibody does not cross-react with dihydropterdine reductase, dopamine-β-hydroxylase, phenylethanolamine-N-methyltransferase, phenylalanine hydroxylase, or tryptophan hydroxylase. The other was a sheep anti-TH (AB1542, Lot 2896740, RRID: AB_90755) from Millipore (Billerica, MA), used at a dilution of 1:1000. This antibody was raised against TH isolated from rat pheochromocytoma, and an immunoblot of mouse brain lysate detected a single band of appropriate mass. The two TH antibodies resulted in very similar staining, with the exception that the staining intensity relative to background was greater with the sheep antibody.
Monoamine concentrations in the OFC
The OFC was dissected from 1.0 mm thick coronal sections of four rats; this tissue sample included most of the OFC, except for the most anterior portion. Concentrations of dopamine and its acidic metabolites 3,4-dihydroxyphenylacetic acid (DOPAC) and homovanillic acid (HVA), as well as norepinephrine and serotonin, were measured by HPLC with electrochemical detection, following our previously described methods (Deutch and Cameron, 1992).
Results
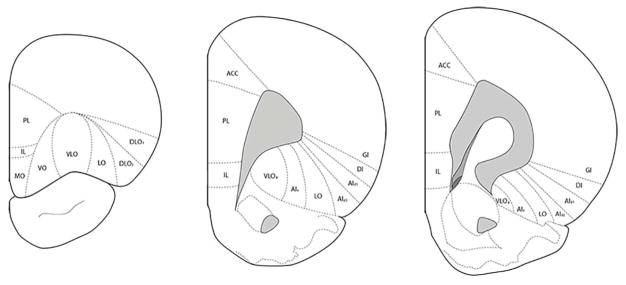
The organization of the ventrolateral frontal cortex is complex, with the boundaries of the various cytoarchitectonic areas in the OFC difficult to discern and subject to different definitions. We followed the nomenclature of van der Werd and Uylings (2008) for the frontal cortices, which expands on the terminology of Krettek and Price (1977a,b) and Ray and Price (1992) (see Fig. 1).
Figure 1.
Schematic representation of the cytoarchitectonic regions of the orbitofrontal cortex at three different rostrocaudal levels. Adapted from van de Werd & Uylings (2008).
Afferents to the OFC
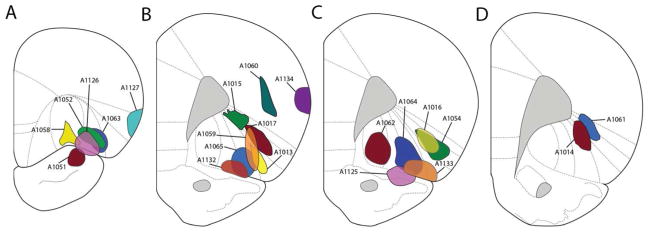
The distributions of retrogradely-labeled cells seen after tracer deposits into the ventrolateral frontal cortex are discussed for five cases that involve different sites in the OFC and a single case in which the deposit was into the anterior pyriform cortex. A schematic representation of the retrograde tracer deposits is shown in Figure 2.
Figure 2.
Schematic representation of the core of the tracer deposits into the OFC and surrounding regions, illustrated at the level of maximal deposit.
Case A1062
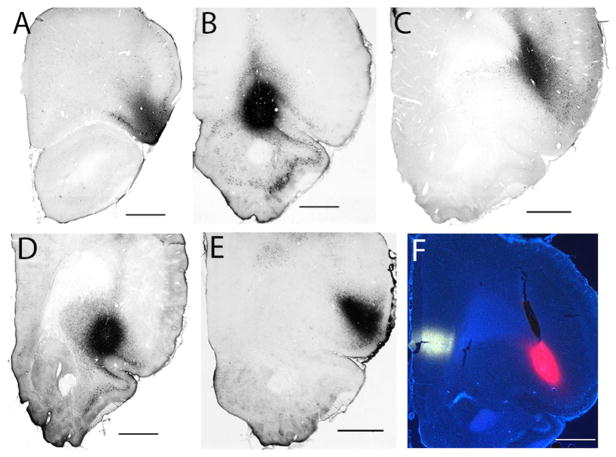
The core of the tracer deposit (see Figures 3B, 4) was centered in the mid-anterior OFC and crossed the rhinal fissure to involve the rostral medial pyriform cortex. Within the OFC the core of the FG deposit was in the posterior ventrolateral orbital cortex (VLOp), with some extension into the ventral agranular insular cortex (AIv).
Figure 3.
Photomicrographs of tracer deposits centered in (A) DLO (case A1013), (B) VLOp (A1062), (C) DI-GI (A1061), (D) LO (A1065), (E) AId1 (A1054). (F) A dual retrograde tracer deposit in the frontal cortices, with the Fluoro-Gold deposit into the prelimbic cortex in the mPFC (white) and tetramethylrhodamine-cholera toxin B injected into the AId2 of the OFC (case A1014). Scale bar: 1000 μm.
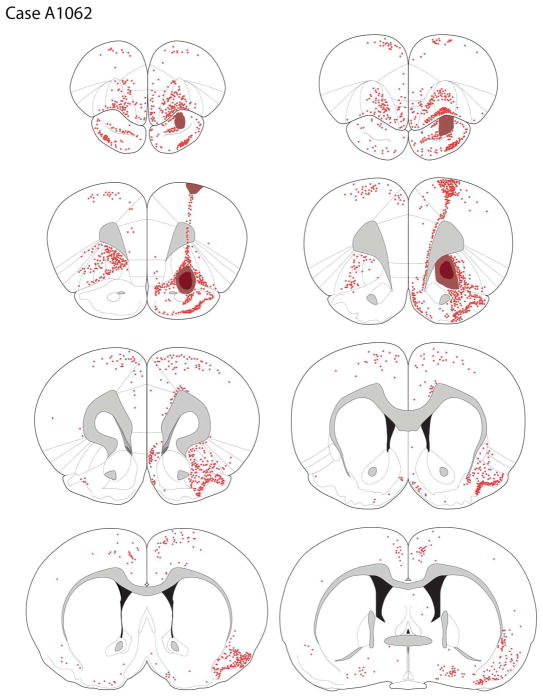
Figure 4.
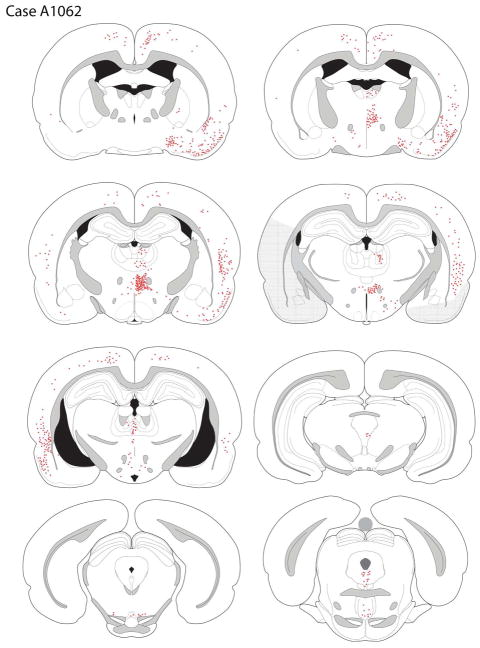
The distribution of retrogradely-labeled cells after a tracer deposit into the VLOp region (case A1062). Darkly shaded region represents tracer deposit core, with the lighter shading depicting the penumbra of tracer deposit. The chartings were made onto plates modified from Paxinos & Watson (2007).
Cortical Afferents
Ipsilateral to the tracer deposit retrograde labeling was mainly observed in the medial aspects of the frontal lobe, involving the medial orbital, rostral prelimbic, pregenual anterior cingulate, and medial precentral cortices; additional scattered cells were seen rostral to the injection site, in the ventrolateral orbital cortex (VLO) and LO and rare labeled cells were seen in the dorsolateral orbital area (DLO) and AId. More posterior the prelimbic (PL) and infralimbic (IL) cortices were notable for their lack of labeling, the exception being a band of cells along the white matter, extending from the tenia tecta into the IL, PL, and more dorsal regions. A dense collection of retrogradely-labeled cells was seen in the ipsilateral pyriform cortex.
Contralateral to the injection site, labeling was seen in the more medial OFC, extending from the MO, VO, VLO, and AIv (Fig. 5A). Retrogradely-labeled cells were present in the contralateral LO, but less frequently in the DLO and AId (see Fig. 4). In the medial wall of the contralateral frontal cortex, only rare labeled cells were seen in the IL and PL, with a slightly greater number more dorsally in the anterior cingulate and medial precentral cortices. A low density of labeled cells was present in the rostral somatomotor cortex.
Figure 5.
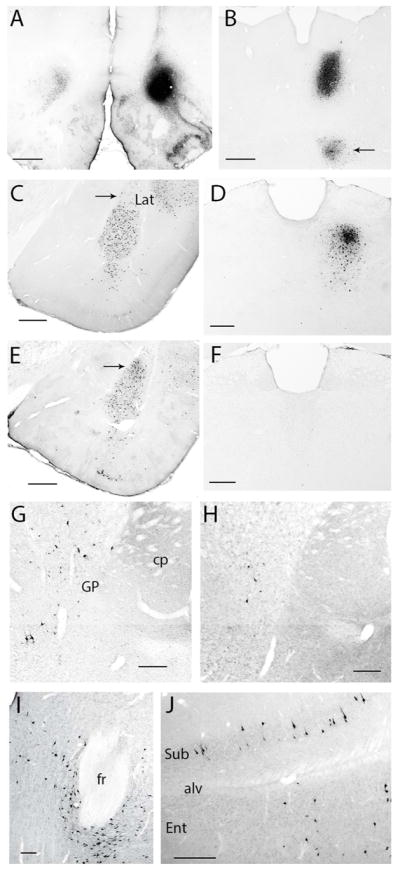
Retrograde labeling following tracer deposits into the OFC. (A) Tracer deposit into VLOp and contralateral labeling (case A1062). (B) Dense retrograde labeling in case A1052 in the central segment of MD, with the arrow pointing to labeling in the submedius nucleus. (C, E) Retrograde labeling in the amygdala following tracer deposits in AId2 (C; A1014) and the LO (E; A1064). Note the greater density of labeled cells in the lateral nucleus after FG was iontophoresed into the LO. (D, F) Retrograde labeling in the MD following tracer deposits into either the LO (D; A1065 or the DI-GI (F; A1060). (G, H) Retrogradely-labeled cells in the globus pallidus and substantia innominata following a deposit into AId (G; A1016) or DI-GI (H; A1061). Labeled neurons in the parafascicular nucleus (I) and subiculum and entorhinal cortex (J) in case A1014 (AId2 deposit). Scale bars: (A) 1000 μm; (B, C, E) 500 μm; (D, F–H, J) 250 μm; (I) 250 μm. Abbreviations: alv, alveus; CP, caudatoputamen (striatum); fr, fasciculus retroflexus; ENT, entorhinal cortex; GP, globus pallidus; Lat, lateral amygdala nucleus; PF, parafascicular nucleus; Sub, subiculum.
Caudal to the genu, cortical labeling was mainly seen in the perirhinal and pyriform cortices and the entire rostrocaudal extent of the cingulate cortex. At levels rostral to the crossing of the anterior commissure, a moderate number of labeled cells was present in the agranular insular cortex with fewer extending into the dysgranular and granular cortices; few claustral cells were labeled. The pyriform cortex was densely labeled. More caudally, the density of labelling dorsal to the rhinal fissure increased but there were fewer cells ventral to the fissure, in the pyriform cortex. At these levels a moderate number of retrogradely-labeled neurons were seen in the visceral areas, and still more posteriorly filled cells in the rostral pole of the entorhinal cortex, the rostral auditory cortex, and the ventral somatosensory cortex were observed. The neurons in the rostral entorhinal cortex did not extend posteriorly to the rest of the entorhinal cortex.
Retrograde labeling contralateral to the tracer deposit mirrored that of the ipsilateral hemisphere, albeit with a much reduced density of labeling.
Amygdala and Hippocampus
The basolateral amygdala was almost devoid of retrograde labeling; this stands in sharp contrast to other cases with more lateral tracer deposits. Similarly, the hippocampus and subiculum did not contain back-filled cells.
Diencephalon
Retrograde labeling was most prevalent in the ipsilateral thalamus, with a dense aggregate of labeled cells seen in the nucleus submedius and in the reuniens. In contrast, relatively few labeled cells were seen in the MD, where they were concentrated in the central segment. A small number of cells was present in most of the midline nuclei and in the thalamic paraventricular nucleus (PVT), particularly its posterior (bilateral) half. A small number of labeled cells was present in the central medial (CM) nucleus; very few labeled neurons were in the parafascicular nucleus (PF), with most being concentrated in the posterior and ventral PF. Some retrogradely labeled cells were present in the parataenial nucleus. There was almost no labeling in the contralateral MD and adjacent areas.
In the hypothalamus, few retrogradely-labeled cells were seen in the parasubthalamic and preparasubthalamic nuclei (see Swanson et al., 2005) of the lateral hypothalamus (LH); almost no labeled cells were seen in the perifornical area.
Mesencephalon
Sparse labeling was observed in the supramammillary nucleus, and the VTA exhibited few labeled cells. Moving caudally, some labeled cells were present in the caudal linear nucleus, and a small cluster of FG-positive cells was seen in the posterior parabrachial nucleus. A moderate number of back-filled cells were in the ventral periaqueductal gray and the medial dorsal raphe.
The A10 dopamine neurons are located in a broad band extending from the supramammillary nucleus to the VTA and thence to the dorsal raphe. We therefore determined if any of the retrogradely-labeled cells were dopaminergic, using tyrosine hydroxylase-immunoreactivity to mark dopamine neurons. Of the retrogradely-labeled cells in this case, only 2.4% also expressed TH, i.e., were dopaminergic.
Other areas
Labeling was seen in both the horizontal and vertical limb of the diagonal band of Broca (DBB). Labeled cells were also seen in the substantia innominata (SI) and in the ventral aspects of the globus pallidus (GP). There appeared to be two types of labeled pallidal cells, one with a large cross-sectional soma (298.6 ± 19.9 μm2) and the other with much smaller soma (128.1 ± 14.8 μm2). Rare back-filled cells were seen in the ventrolateral septum.
Case A1065
The core of the deposit was centered in the superficial layers of the lateral orbital cortex (LO) and extended medially into the superficial AIv and laterally into the dorsal agranular insular cortex, ventral part (AId2; Fig. 3D, 6). The penumbra surrounding the tracer core involved the deep layers of the LO and slightly extended into rostral pyriform cortex, ventral to the rhinal fissure.
Figure 6.
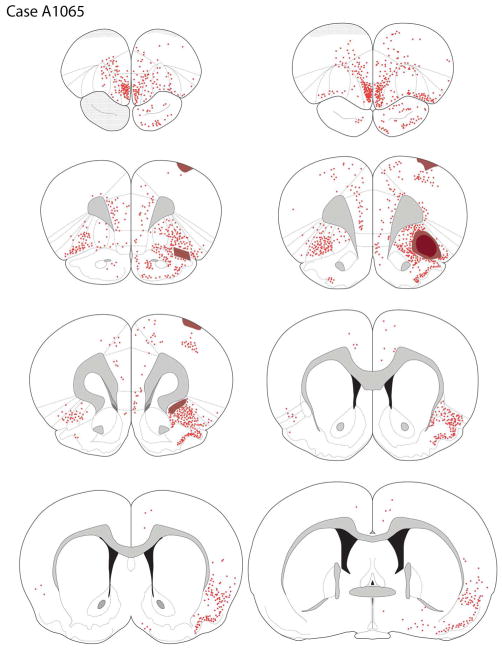
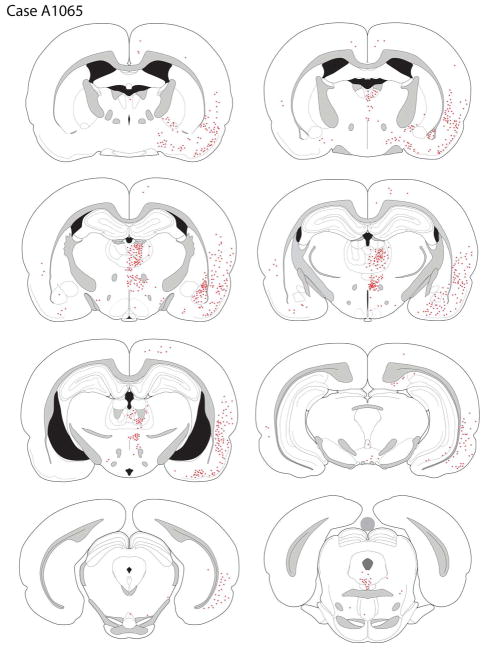
The distribution of retrogradely-labeled cells after a tracer deposit of the LO (case A1065).
Cortical Afferents
Retrogradely-labeled cells were seen across the medial and lateral regions of the ipsilateral frontal cortex. Within the orbital regions, labeling was seen in the VO, VLO, AIv, and LO, with scattered labeling in AId2 (Fig. 6). In the medial wall of the hemisphere, there was a dense accumulation of retrogradely-labeled cells in the rostral MO. More caudally in the medial frontal lobe, the density of labeled neurons decreased, with a few small clusters of labeled neurons in the rostral IL, PL, pregenual cingulate, and medial precentral cortices. The tracer deposit extended slightly into to the rhinal fissure, resulting in dense labeling of cells in the rostrocaudal extent of the pyriform cortex.
Labeling in the contralateral frontal cortices largely mirrored that of the ipsilateral cortex but with fewer labeled cells present. However, the caudal half of the contralateral infralimbic region was largely devoid of labeled cells.
Posterior to the genu, retrograde labeling was most predominant in the peri- and ento-rhinal cortices, with sparse labeling in the cingulate cortex (Fig. 6). At mid-rostral striatal levels, retrogradely-labeled cells were present in the ipsilateral agranular insular cortex across L2/3 and L5, as well as in the dysgranular and granular cortices. Labeling ventral to the rhinal fissure, in the pyriform cortex, was progressively less dense along the anterior-posterior domain. More caudally, the posterior insular cortex had some labeled cells, with a very low density of backfilled cells more dorsally, in the auditory cortex. In the entorhinal region retrogradely-labeled cells were present in area 25 and the lateral entorhinal cortex, with minimal labeling in the medial entorhinal zone.
In the contralateral hemisphere, there was sparse of labeling in the granular, dysgranular and agranular insular cortices and perirhinal cortex; only rarely were labeled cells present in the contralateral entorhinal cortex.
Amygdala and Hippocampus
Retrograde labeling was detected through the rostro-caudal extent of the ipsilateral amygdala (Fig. 6). Labeling was present in the BLA and extended dorsally into the lateral nucleus. Retrograde labeling appeared roughly comparable in the lateral and basolateral nuclei. In addition, the density of labeled cells appeared somewhat greater in the dorsal than ventral aspects of the basolateral nucleus. A few labeled cells were also seen in the anterior amygdaloid area and the basomedial amygdala (BMA). No labeled cells were observed in the central nucleus. Retrograde labeling of the amygdala was almost exclusively ipsilateral to the injection site.
Light labeling was detected in the hippocampus. In particular, clusters of retrogradely-labeled cells were seen in both the subiculum and to a lesser degree in the CA1 field of the ipsilateral hippocampus.
Diencephalon
Many retrogradely-labeled cells were present in the ipsilateral thalamus, most densely in the MD and nucleus submedius; minimal labeling was seen in the contralateral thalamus. Labeled cells in the anterior MD were mainly concentrated in the central portion of the structure, with some extension into the medial and lateral segments. More caudally, labeled MD neurons were primarily localized to the central and lateral aspects of the nucleus, with a dorsal bias (see Fig. 5D). Moderately dense labeling of the parataenial nucleus was observed. Along the midline, scattered labeled cells were present in the anterior PVT; labeling decreased as one moved caudally in the PVT. In the intermediodorsal (IMD) nucleus, ventral to the PVT, a somewhat greater number of filled neurons were seen; scattered retrogradely-labeled cells were present in the reuniens and rhomboid nuclei. Dense labeling was seen in the nucleus submedius.
Retrograde labeling was seen in the central medial-parafascicular (CM-PF) complex, primarily in the central medial (CM) and paracentral (PC) portions. Moderately dense labeling was present in the parafascicular nucleus, particularly in the medial PF (Fig. 6).
In the hypothalamus, a very small number of retrogradely-labeled cells was observed in the dorsal perifornical area (Fig. 6). In contrast to case A1014, only rarely were labeled cells seen in the remainder of the LH, where they were restricted to the ventrolateral area.
Mesencephalon
Sparse retrograde labeling was seen in the VTA, primarily in the nucleus parabrachialis. Labeled cells were also present in the rostral linear nucleus, and increased in number as one moved posteriorly to the caudal linear nucleus. Rare labeled cells were seen in the pars lateralis of the substantia nigra, retrorubral field, and interpedencular nucleus.
Caudally, in the dorsocaudal extension of the A10 cell group (A10dc; Hokfelt et al, 1984), where the caudal linear nucleus merges dorsally with the ventral periaqueductal gray, a few retrogradely-labeled cells were present. These cells were continuous with a more dense collection of filled cells in the dorsal raphe. We observed a single labeled cell in the median raphe.
Of the small number of retrogradely-labeled cells observed in the VTA and A10dc region, 29.5% of these neurons expressed TH, i.e., were dopaminergic.
Other areas
Retrogradely-labeled cells were detected in several other forebrain areas. A few labeled neurons were present in the DBB. Labeled cells were also seen in the substantia innominata and nucleus basalis, but rarely did labeling extend dorsally into the globus pallidus. The nucleus basalis differed from most other subcortical nuclei by displaying bilateral labeling after LO injections, although the density of labeling in the contralateral hemisphere was less than observed ipsilaterally.
Case A1014
The dense core of the tracer deposit primarily involved the deep layers of the dorsal agranular cortices, with the penumbra surrounding the core extending from L2-L6 (Fig 3F, 7). In addition to AId1/2, the core of the deposit extended rostrally into the dorsal aspect of the dorsolateral orbital cortex 1 (DLO1; see Fig. 7) and minimally into the LO.
Figure 7.
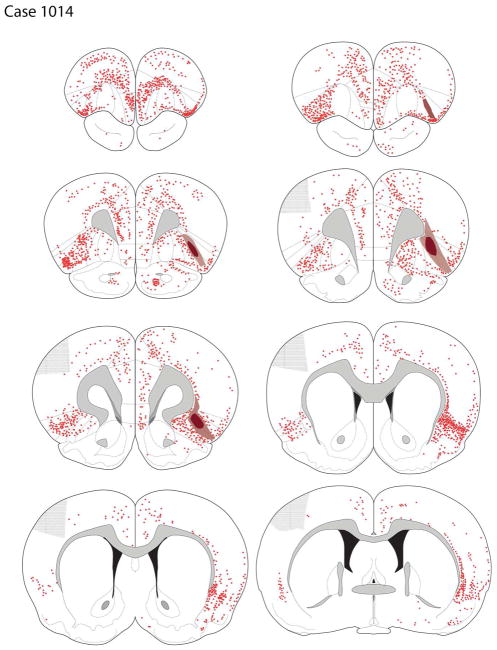
Retrograde labeling following a tracer deposit into AId2 (case A1014).
Cortical Afferents
Retrogradely labeled cells were seen in much of the ispilateral frontal cortex, with prominent labeling seen across the cortex above the rhinal sulcus, from the ventrolateral orbital cortex (VLO) into the lateral aspect of the LO (see Fig. 7); a moderate number of labeled cells was seen in the anterior pyriform cortex, ventral to the rhinal sulcus.
The entire medial wall of the ipsilateral hemisphere showed moderate labeling, including the MO, layer 5 of the infralimbic (IL), prelimbic (PL), pregenual anterior cingulate, and medial precentral cortices, extending into the forelimb representation of the motor cortex.
In most frontal areas, the density of labeling was roughly comparable in the ipsilateral and contralateral hemispheres. Very dense labeling was present in the AId1 and AId2 cortices contralaterally, extending rostrally to the DLO and medially into the LO. In contrast to the largely symmetric labeling across the two hemispheres in the OFC regions, in the caudal aspects of the contralateral mPFC there were very few labeled cells in the ventral PL and IL cortices (Fig. 7). Labeling was largely absent in the rostral somatosensory cortices. In the posterior aspects of the frontal cortex retrogradely-labeled cells were present in the pyriform cortex.
Posterior to the genu of the corpus callosum, cortical labeling was largely restricted to two broad regions: the peri- and ento-rhinal cortices laterally, and the cingulate cortices dorsomedially. There was extensive labeling of neurons across the granular, dysgranular, and agranular insular cortices (Fig. 7). Ventral to the insula, there was light-to-moderate labeling of the pyriform cortex. The dorsal half of the anterior claustrum contained scattered retrogradely-labeled cells; in the more posterior claustrum labeling was more dense and uniformly distributed. Dorsal to the granular insular cortex was a thin band of deep layer neurons that followed the curve of the white matter to the motor cortex. In addition, a small number of labeled neurons were present in the auditory cortex.
Labeling was also present in the entorhinal cortex (ENT), primarily in the deep layers of the lateral entorhinal area (Fig. 5J, 7); far fewer cells were seen in the medial ENT.
Retrograde labeling was seen across the rostrocaudal extent of the cingulate cortex, from the pregenual aspects to the retrosplenial cortex; labeled cells were present in both the deep (L5) and superficial layers, with few labeled cells seen in the medial-most motor cortex.
Amygdala and Hippocampus
Ipsilaterally, dense labeling was seen in the basolateral (BLA) nucleus, with labeling of the lateral nucleus being less dense (Fig. 5C, 7). Labeling in the contralateral BLA was sparse. A few scattered cells were present in the intercalated nuclei and AST. The entire mediolateral extent of the basolateral complex contained labeled cells, with no apparent mediolateral bias. Moving caudally in the amygdala, light to moderate labeling was present in the basomedial nucleus (BMA). Only rarely were labeled cells seen in the corticomedial amygdala.
Moderate labeling of pyramidal cells in the hippocampal formation was observed. These labeled neurons were restricted to the CA1 field and the subiculum and presubiculum (Fig. 5J, 7).
Diencephalon
Retrograde labeling was dense in the ipsilateral thalamus, primarily in the mediodorsal nucleus (MD) and midline intralaminar nuclei, with less dense labeling in the central medial complex. There was relatively little labeling in the contralateral thalamus. Retrogradely-labeled cells were present in the lateral hypothalamus (LH) and contiguous nuclei.
Dense but heterogeneous labeling was seen in the MD (Fig. 7), with more cells labeled in the medial MD and spilling over into the central part of the MD; fewer labeled cells were seen in the lateral MD. A moderately dense group of labeled cells was present in the parataenial nucleus, but only rare filled cells were seen in the anteromedial nucleus. Retrogradely-labeled cells were also present medial to the MD, in the thalamic paraventricular nucleus (PVT); the density of labeled cells was greater in the posterior PVT (where the nucleus bifurcates) than rostral PVT. Other midline thalamic nuclei, including the intermediodorsal (IMD) and interanteromedial (IAM) nuclei, as well as the rhomboid and reuniens, also contained labeled cells (Fig. 7). The nucleus submedius contained numerous labeled cells.
Labeled neurons were detected across in the central medial-parafascicular complex. These retrogradely-filled cells were moderately dense in the CM, and diminished in number moving laterally to the paracentral (PC) and central lateral (CL) nuclei. Posteriorly, the medial parafascicular nucleus was densely labeled (Fig. 5I, 7).
In the ventral diencephalon a small number of retrogradely-labeled cells was seen in the lateral hypothalamic region. A small cluster of labeled cells was present in the dorsal perifornical area (Fig. 7). More scattered cells were seen in other territories of the lateral hypothalamus, particularly in more lateral areas of the LH, with most of these seen in the parasubthalamic and preparasubthalamic nuclei (see Swanson et al., 2005). Very rare labeled neurons were seen in the ventromedial nucleus and the posterior hypothalamus.
Mesencephalon
Light labeling was seen in the midbrain dopamine cell-rich areas. Scattered cells were present medially in the ventral tegmental area (VTA), with cells mainly present in the nucleus parabrachialis and nucleus paranigralis; a few labeled neurons were seen in the rostral linear nucleus. Further caudally, a substantially greater number of retrogradely-labeled cells was present, primarily in the caudal linear nucleus, the ventral periaqueductal gray, and the dorsal raphe. Few labeled cells were seen in the medial substantia nigra, with rare back-filled neurons seen in the medial retrorubral field (Fig. 7). Of the retrogradely-labeled cells seen across the rostrocaudal extent of the A10 cell group, 22% were also TH-ir, i.e., about one fifth of the midbrain neurons innervating the AId2 region were dopaminergic.
Other Areas
Some other areas of the brain contained retrogradely-labeled neurons. Labeled cells were seen in the DBB, mainly in the vertical limb. Moving posteriorly cells were seen in the substantia innominata and extending dorsally with a few labeled cells in the ventral-most globus pallidus. Retrogradely labeled cells were not seen in the nucleus accumbens or the septal nuclei.
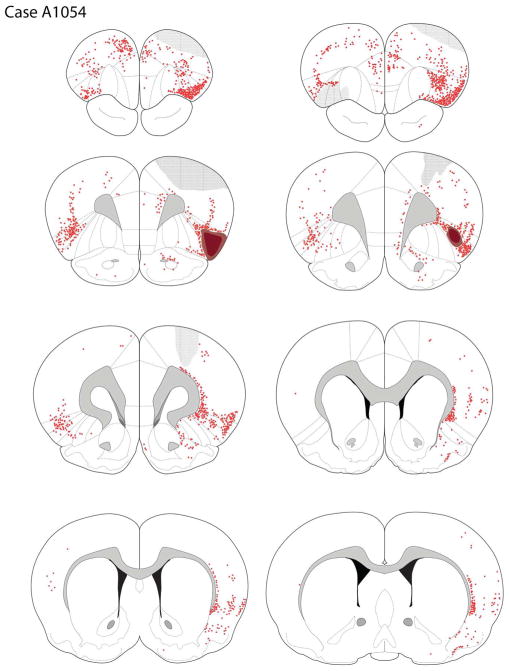
Case A1054
The Fluoro-Gold deposit primarily involved AId1 and DI (see Figures 3E, 8). The core of the deposit was in the mid-anteroposterior level of AId1 and DI, with the penumbra extending rostrally into DLO1.
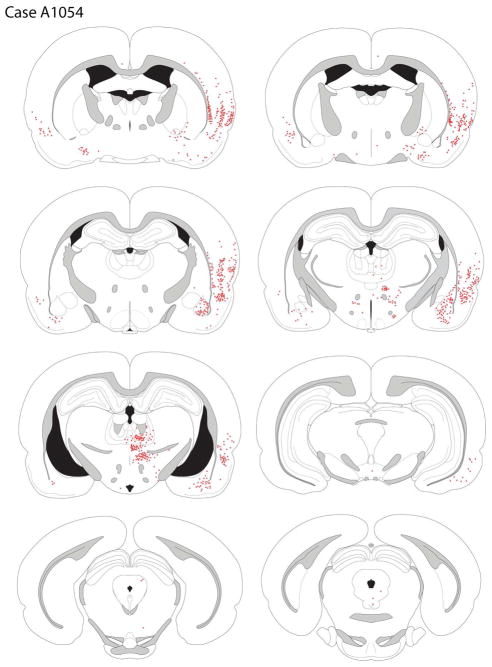
Figure 8.
The distribution of retrogradely-labeled cells in case A1054, with the tracer deposit centered in AId1.
Cortical Afferents
Moderate labeling of the pyriform cortex was observed. More back-filled cells were seen in the posterior pyriform cortex rather than the anterior pyriform area. In the ipsilateral frontal lobe, a narrow band of retrogradely-labeled FG cells was seen in the prelimbic cortex, but only rarely did these cells extend ventrally into the infralimbic cortex; the exception to this rule was that there was appreciable labeling in the caudal infralimbic region. A moderate number of labeled cells was present in both the superficial and deep layers of the medial precentral and anterior cingulate cortices. Labeled somatosensory cells extended dorsally from the FG deposit. The density of labeled cells was greater in the more anterior frontal regions, and showed a marked decrease caudally. Rare labeling was present in the anterior (pregenual) pyriform cortex, particularly ipsilateral to the tracer deposit.
Labeling in the contralateral frontal areas mirrored that seen ipsilaterally, but was less dense. In the contralateral homotypic areas, the density of FG-labeled cells was appreciably greater in the dysgranular than granular cortices, and a moderate density of cells also present in AId1.
Posterior to the genu, moderate labeling was seen in the ipsilateral insular cortices and in the pyriform cortex. Although the claustrum was nearly devoid of labeling except in its most dorsal aspect, the endopyriform cortex was densely filled with retrogradely-labeled cells.
Amygdala and Hippocampus
The basolateral amygdala contained a moderate number of retrogradely-labeled cells. Most of these neurons were located in the BLA, with less seen in the lateral nucleus; fewer labeled neurons were seen in the basomedial nucleus. There was no significant labeling of cells in the hippocampal formation, with the exception of a low-to-moderate density of filled cells in the lateral entorhinal cortex.
Diencephalon
In the mediodorsal thalamus a small number of FG-positive cells was seen in the ventral parts of the central and medial MD. Very few filled cells were seen in the thalamic paraventricular nucleus; cells in the rhomboid and reuniuens nuclei were also observed. The nucleus submedius was not labeled. Finally, a moderate density of back-filled cells was present in the ventral posterior medial (VPM) and particularly ventromedial (VM) thalamic nuclei.
A moderate number of retrogradely-labeled cells were seen in the CM-PF complex. In the central medial nucleus back-filled neurons were more frequently encountered than in the paracentral and central lateral nuclei. There was a moderately high density of FG-positive cells in the parafascicular nucleus.
Rare retrogradely-labeled cells were seen in the perifornical area and the lateral hypothalamus. A somewhat greater number of back-filled cells were seen in the posterior lateral hypothalamus.
Mesencephalon
A moderately-dense cluster of FG-positive cells was present in the supramammillary nucleus. Occasionally, back-filled cells were seen in the VTA, where they were almost exclusively located in the parabrachial nucleus. A few labeled cells were seen in the anterior pole of the dorsal raphe. Of the retrogradely-labeled neurons in the ventral midbrain, 17.5% were dopaminergic, as defined by expression of TH-ir.
Other areas
Very rare FG-positive cells were seen in the olfactory tubercle. There was a moderate density of retrogradely-labeled neurons in the ventral pallidum, clustering at the border of the ventral pallidum and dorsal (globus) pallidus at rostral GP levels, but with labeled cells seen extending into the GP proper for 500–1000 μm.
A small cluster of FG-positive cells was observed in the preoptic area, just dorsolateral to the optic tract.
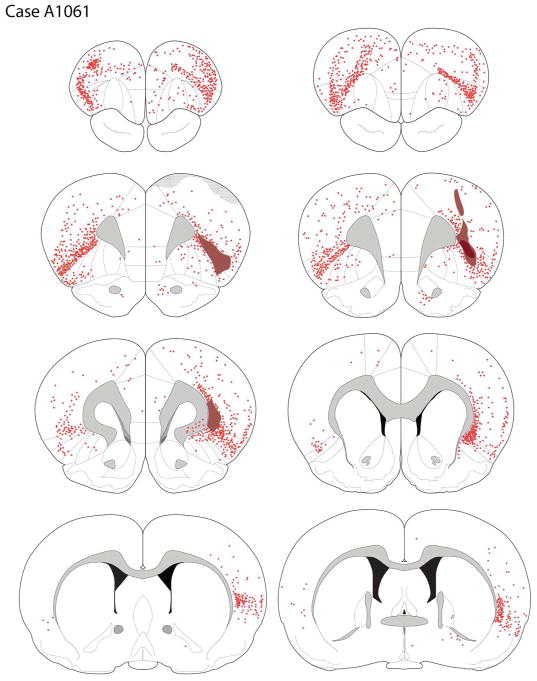
Case A1061
The core of the tracer deposit was centered in the dysgranular and granular insular cortices (DI and GI), mainly involving the deep layers but with some L2/3 involvement rostrally. The deposit extended dorsally into the deep layers of the somatosensory cortex.
Cortical Afferents
Retrogradely labeled cells were widely distributed across much of the ipsilateral and contralateral frontal cortices (see Figures 3C, 9). Moderately dense labeling was seen in the ipsilateral rostral somatomotor region, decreasing medially, with few retrogradely-labeled cells seen in the shoulder cortex, pregenual cingulate, prelimbic, and infralimbic cortices on the site of the tracer deposit.
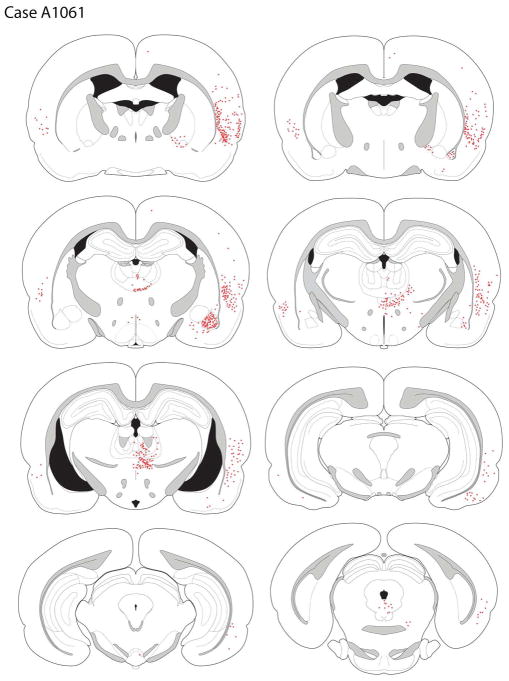
Figure 9.
Retrogradely-labeled cells after a Fluoro-Gold deposit into DI and GI (case A1061).
Retrograde labeling was more dense in the contralateral frontal area, particularly the rostral aspects of the somatomotor and M2 motor regions. Scattered back-filled cells were present in the contralateral mPFC, including the prelimbic and infralimbic cortices. The contralateral GI and particularly DI were densely labeled; less densely labeled were DLO1, AId1/2, and LO, bilaterally.
Posterior to the genu, ipsilateral cortical labeling was largely restricted to the cortices dorsal to the rhinal sulcus, where labeling was seen in the perirhinal cortex as well as gustatory and visceral fields, particularly in the deep layers.
Contralaterally, there were considerably fewer retrogradely-labeled cells. The claustrum harbored a very low density of retrogradely-labeled neurons, but moderate numbers of deep layer cells dorsal to claustrum were seen. In contrast to other cases discussed, only rarely were retrogradely-labeled cells seen in the pyriform cortex.
More caudally, fewer filled cells were present in the insular and gustatory cortices; labeled cells extended dorsally from the GI into the ventral (secondary) somatosensory cortex. Retrogradely-labeled neurons were not present in the posterior cingulate and retrosplenial cortices; a small number of filled neurons were seen in the lateral entorhinal cortex.
Amygdala and Hippocampus
Labeling of the amygdala differed from cases involving LO deposits in that there was a moderate density of filled cells in the BLA but significantly fewer in the lateral nucleus. Moreover, labeling in the BLA was strongly biased to the anterior parts of the basolateral complex, with very few back-filled cells seen in the more posterior BLA. There was light labeling in the basomedial nucleus.
Retrogradely-labeled cells were not seen in the hippocampus or subiculum.
Diencephalon
Labeling in the thalamus was more prominent along the midline than laterally, with very few retrogradely-labeled cells seen in the MD. A moderate number of back-filled neurons were present in the intermediodorsal nucleus and in the paraventricular thalamic nucleus, particularly its posterior (bilateral) aspects. A few scattered cells were present in the more ventral midline nuclei, including the rhomboid and reuniens.
Retrograde labeling was present in the CM-PF complex. Most of the labeling was seen in the central medial nucleus, particularly in the midline where the nucleus has a modest dorsal extension; fewer filled cells were seen in the paracentral and especially central lateral parts of the CM complex. Retrogradely-labeled PF neurons were also present in moderate density; they were more frequently encountered in the ventral PF.
The nucleus submedius was not labeled, and only rare retrogradely-labeled neurons were present in the hypothalamus.
Mesencephalon
Almost no retrogradely-labeled cells were seen in the VTA. There was a modest number of labeled cells in the lateral supramammillary nucleus. More posteriorly, in the A10dc region, no back-filled cells were seen in the caudal linear nucleus, but were present in the posterior periaqueductal gray and the dorsal raphe. Of the retrogradely-labeled neurons in the A10 cell group (almost entirely limited to those neurons located in the A10dc and A10vr regions), none expressed TH-ir, i.e., none were dopaminergic.
Other Areas
A few retrogradely-labeled cells were seen in the substantia innominata and ventral pallidum; these cells appeared to be continuous with labeled cells extending dorsally into the GP. Overall, there were fewer cells in this group of substantia innominata-pallidal neurons than seen in case A1054.
Other Cases
The various cytoarchitectonic areas that comprise the OFC are relatively small and tightly clustered, and thus tracer deposits targeting these areas often invade adjacent areas. It is therefore quite useful to compare the data from the cases not discussed above to arrive at general statements concerning the organization of afferents to the OFC.
The core of the tracer deposits in a large number of cases extended not only across different cytoarchitectonic regions in the OFC, but beyond the OFC. In a number of cases there appeared to be incidental involvement of the anterior pyriform cortex, although on occasion it was difficult to differentiate the retrograde labeling of the pyriform (primary olfactory) cortex resulting from tracer deposits into the OFC (secondary olfactory area) from direct tracer spread into the pyriform cortex. In case A1051 the Fluoro-Gold deposit was restricted to the pyriform cortex beneath the rhinal sulcus (see Fig. 2). Compared to cases involving tracer deposits into the OFC, retrograde labeling across the brain was quite limited. A moderate density of labeled cells was seen in the ventrolateral orbital area, extending slightly into the lateral and ventral orbital cortices, particularly ipsilateral to the FG deposit. Dense labeling throughout the anteroposterior extent of the pyriform cortex was seen. In addition, a moderate density of FG-positive cells was seen in the olfactory tubercle; a few cells were present in the horizontal limb of the diagonal band complex. Moderate retrograde labeling of the subiculum and CA1 of the hippocampus was present bilaterally. However, in contrast to cases involving OFC deposits, there was no labeling of the basolateral amygdala, mediodorsal thalamus, or the midbrain.
The impressions gleaned from the cases that we have not discussed in detail confirm in large part our observations in the cases we discussed earlier. However, comparing the additional cases allowed us to detect evidence of topographic relationships between the OFC and afferents from the MD and BLA, both within part of the OFC (such as the medial OFC, including the VLO and LO) and across the entire OFC.
The ventrolateral orbital cortex (VLO) is the medial-most region of the OFC that we will discuss. Some investigators include the medial orbital cortex (MO) as part of the OFC. However, the MO is directly ventral to mPFC regions (the prelimbic or infralimbic cortices, depending upon the anteroposterior level of the frontal lobe). Moreover, Hoover and Vertes (2011), in their study of MO efferents, argued that the pattern of MO projections resembles that of the mPFC and is distinct from that of the OFC.
In case A1062 the core of the tracer deposit was mainly in the posterior VLO. The density of retrogradely-labeled neurons in the medial mPFC (prelimbic and infralimbic cortices) was substantially less than seen after FG deposits into the LO in case A1065. Moreover, the density of FG-positive cells in the basolateral amygdala was greater after tracer injections of the (more lateral) LO than VLO. Interestingly, in both these and other VLO and LO cases, there appeared to be a greater labeling in the lateral nucleus than the basolateral nucleus. In contrast, tracer deposits into lateral OFC (from AId1 to GI) resulted in roughly comparable labeling in the lateral and basolateral nuclei.
Moving laterally, we compared the pattern of retrograde labeling after tracer deposits centered in the LO (case A1064) and the insular AId2 regions (case A1014). In the former case MD labeling was mainly seen in the central MD but with some medial MD labeling. In contrast, the AId2 deposit yielded more medial MD labeling. Another difference in the afferents to the LO and the more lateral AId2 was the greater labeling of neurons in temporal cortical areas dorsal to the rhinal fissure (including the GI, DI, and somatosensory cortices and, posteriorly, the auditory cortex) after tracer deposit into insular cortices. There was little difference in the overall density of labeling of the basolateral complex, but the lateral nucleus exhibited more filled cells than did the basolateral nucleus in case A1064.
Case A1014 was a relatively large injection in which most of the core of the tracer deposit was in AId2. The FG deposit in case A1054 was more laterally placed, centered in AId1 and DI. Labeling of the medial frontal areas, including the prelimbic area, was substantially greater after deposits into AId2. Importantly, MD labeling was much more sparse in case A1054 (AId1 and DI) than A1014. In turn, we compared the same AId1-DI case (A1054) with an animal (A1061) in which FG was deposited more laterally, into the DI and GI. The DI-GI tracer deposit resulted in a greater degree of BLA labeling, but a marked decrease in the density of MD labeling; a similar tracer deposit in case (A1060) yielded similar results.
While labeling of the basolateral complex increased as tracer deposits were placed into progressively more lateral areas of the OFC, labeling of the basomedial amygdala was greater after FG deposits of the agranular insular areas (cases A1014 and A1016) that seen with injection of the far lateral cases (A1060 and A1061).
Although there appeared to be a mediolateral topographic organization of thalamic and amygdaloid projections to the OFC, we were not able to discern any such relationship of midbrain afferents to the OFC. The two largest groups of cells in the midbrain that project to the OFC were in the supramammillary nucleus and a caudal area extending from the caudal linear nucleus to the central gray to the anterior dorsal raphe, with few cells in the VTA proper, as defined by Phillipson (1979).
Similarly, other areas that were unexpectedly labeled, such as the globus pallidus (GP), also did not vary as a function of mediolateral position of the tracer deposit into the OFC. Globus pallidus labeling was prominent after tracer deposits into the AId1, AId2, and DI (A1016, A1014, and A1060, respectively) compared to other cases. However, these cases involve OFC deposits into the central and lateral OFC, but not in the far lateral OFC, and thus GP labeling does not appear to follow a medio-lateral topography.
In contrast to the data supporting a general mediolateral topographic organization of thalamic and amygdaloid afferents to the OFC, it is more difficult to discern a consistent difference in the distribution of these projections to the rostral versus caudal OFC. Case A1016 involved a tracer deposit centered in AId2 and AId1. In another case (A1013) in which the tracer was centered in DLO1 and DLO2 (see Fig. 3A), rostral to case A1016, there was considerably less labeling in than seen after the caudal tracer deposit, although pregenual cingulate labeling was roughly comparable across the two hemispheres. However, we lacked sufficient number of far rostral tracer deposits to be able to confidently describe a rostrocaudal topography.
Dopaminergic innervation of the OFC
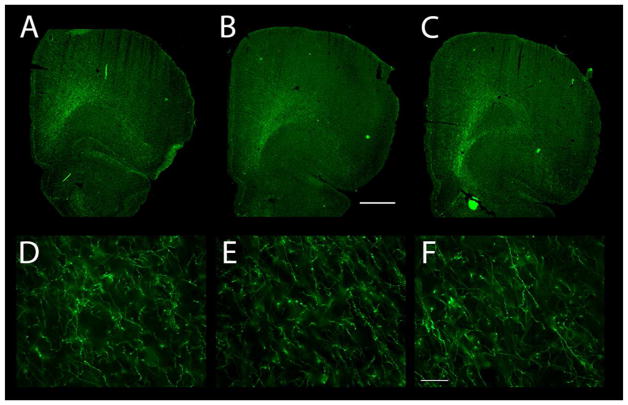
We used tyrosine hydroxlase (TH) as a marker of the dopaminergic axons in the frontal lobe (see Noack and Lewis, 1989 and Venator et al., 1999). Tyrosine hydroxylase-ir axons at the medial border of the accumbens rostral pole entered the white matter of the forceps minor (see Fig. 10). A stream of TH-ir axons bifurcated to course along the dorsal and ventral aspects of the forceps to exit at the ventrolateral border of the white matter.
Figure 10.
Dopaminergic innervation of the OFC as revealed by TH immunoreactivity. (A–C) The distribution of TH-ir axons is shown at three different levels, from rostral (A) to caudal (C). Note the sweeping band of TH-ir axons in the ventrolateral frontal cortex, running diagonally from the white matter to the pial surface. The dopamine innervation completely fills AId2 and extends somewhat medially (into LO) and laterally (into AId1). (D–F) TH-ir axons in Layer 6 (panel D), Layer 5 (E), and Layer 3 (F). Scale bars: A–C, 1000μm and D–F, 50μm.
Dopamine axons in the OFC were distributed throughout AId2, fanning out from a relatively compact cluster where they entered layer 6 (L6) as a bundle ~350 μm in width to distribute TH-ir axons throughout AId2 (Fig. 10). These TH-ir axons then spread to innervate AId2 and invade but not fill the LO medially and AId1 laterally. The dopaminergic innervation of these two areas that flank the AId2 was broader in the more caudal OFC, and narrowed rostrally.
The morphology of OFC dopamine axons resembled those of mPFC dopamine axons. Relatively smooth, thick TH-ir axons exited the white matter to enter L6 (Fig. 10D) and continued into deep L5. In superficial L5 the dopamine axons ramified and thin axons with small varicosities and large intervaricose segments were present (Fig. 10E). In L2/3 both smooth and highly varicose TH-ir axons were present (Fig. 10F).
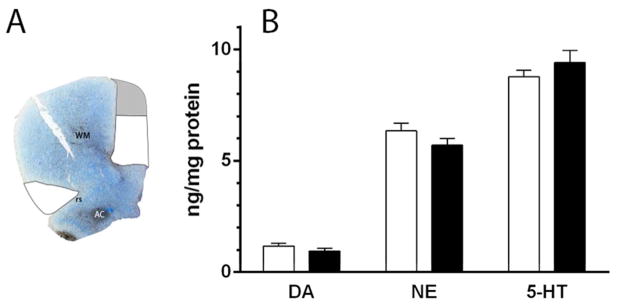
The dopamine innervation of the OFC subjectively appeared to be substantially less dense than that of the mPFC. We therefore measured the concentrations of dopamine, norepinephrine, and serotonin in the whole OFC and the mPFC. The concentration of dopamine in the OFC was 0.96 ± 0.12 ng/mg protein and did not differ from the dopamine concentration in the mPFC (1.18 ± 0.13 ng/mg protein; Fig. 11). Acidic metabolites of dopamine were also detected in the OFC and did not differ across the mPFC and OFC: the DOPAC concentration was 0.33 ± 0.10 ng/mg protein (vs 0.35 + 0.09 ng/mg in the mPFC) and the HVA concentration was 0.57 ± 0.10 ng/mg in the OFC vs 0.60 ± 0.11 ng/mg in the mPFC).
Figure 11.
(A) A toluidine blue-stained section illustrates dissected regions of the frontal cortices taken for analyses of monoamine concentrations. The dissected areas of the mPFC and OFC are depicted in white; the gray area in the medial precentral cortex of the mPFC was discarded. (B) Monoamine concentrations in the mPFC (white bars) and OFC (black bars). The concentrations of dopamine, norepinephrine, and serotonin in the mPFC and OFC did not differ significantly.
The NE concentration of the OFC was about five times greater than that of dopamine, while OFC serotonin concentrations were also much greater than that of dopamine (Fig. 11).
Collateralization of thalamic, amygdaloid, or ventral mesencephalic neurons innervating the OFC
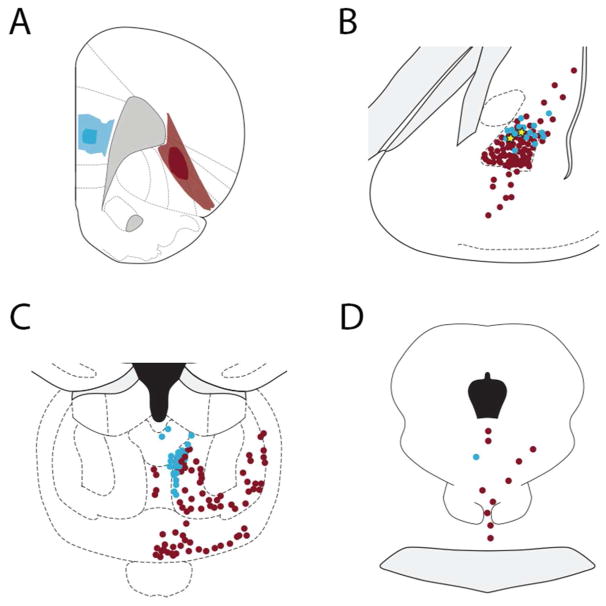
We determined if individual neurons in any of the three major subcortical nuclei that innervate the OFC collateralize to innervate both the OFC and mPFC (Fig. 12). We analyzed five cases involving dual (FG-CTB) tracer deposits into the mPFC and OFC (see Fig. 3F). In none of these cases did we observe MD or midline thalamic nuclei that branched to innervate both the OFC and mPFC. In the midbrain, including the posterior extension of the VTA into the central gray matter and dorsal raphe, we observed two neurons that accumulated both retrograde tracers and thus branched to innervate both the mPFC and OFC. In the basolateral complex, we found four neurons across the five cases analyzed that were double-labeled (Fig. 12B).
Figure 12.
Localization of retrogradely-labeled cells in the (B) mediodorsal thalamus, (C) basolateral amygdala, and (D) midbrain (including rostral dorsal raphe) after (A) depositing Fluoro-Gold into the mPFC (blue) and cholera toxin B into the OFC (red). The filled blue circles indicate neurons retrogradely-labeled from the mPFC and red filled circles indicate cells retrogradely-labeled from the OFC; yellow stars depict double-labeled cells. A single midbrain cell and two amygdala cells (yellow stars) were double labeled.
Convergence of thalamic, amygdaloid, and ventral mesencephalic afferents to the OFC
The possible convergence of subcortical afferents to the OFC was assessed by examining animals in which BDA conjugated to different fluorophores was deposited into the basolateral amygdala and mediodorsal thalamus, and immunohistochemical detection of TH-ir axons was used to mark dopaminergic afferents from the midbrain. An example is shown for case A1115, in which BDA conjugated to fluorescein was iontophoresed into the amygdala, with the deposit primarily involving the ventrolateral BLA. In the case of thalamic tracing, BDA conjugated to tetramethylrhodamine was deposited in the mid-posterior MD, involving the lateral segment and extending into the ventral aspect of the central MD.
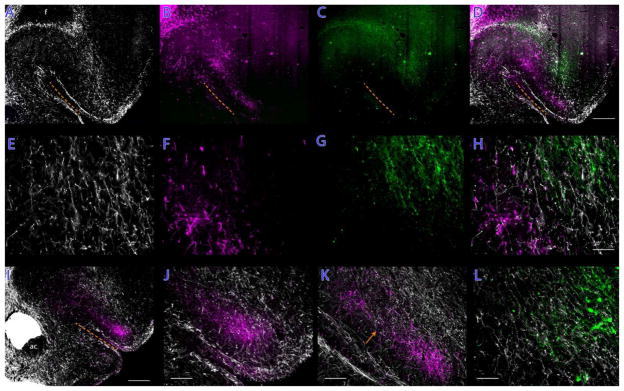
The MD projection to the OFC covered an obliquely-positioned swath of the OFC, running from the VLO to the AId2 (Fig. 13B). This band of labeled axons ran parallel to the rhinal sulcus and about 300 μm dorsal to the sulcus. Interestingly, there was an inhomogeneity in the mediolaterally oriented band of labeled axons, with a clear separation into two areas of axons separated by an area in which anterogradely-labeled thalamic axons were very sparse (see Fig. 13B, K). The MD projection to the OFC decreased in density at more rostral levels.
Figure 13.
The distributions of OFC axons anterogradely-labeled from the mediodorsal nucleus (B,F; magenta) and basolateral amygdala (C,G; green), with TH-ir (dopaminergic) axons shows in white (A,E). The three inputs to the OFC are largely segregated, with the dopaminergic innervation of AId2 and surrounding areas being flanked medially by the thalamic input and laterally by the amygdaloid projection. While the three innervations are, in large part, to spatially distinct areas of the OFC, there is some overlap of axons that can be appreciated in the higherpower photomicrographs in panels E, F, G, and (H) the merge image. Panels I, J, and K depict another case (A1112) with axons originating in the mediodorsal thalamus (magenta) being ventrally positioned relative to the TH-ir (dopaminergic) axons. The arrow in panel K points to a discontinuity in the thalamic innervation, which was characteristic of inputs from the mediodorsal nucleus, which is invested with a small cluster of dopaminergic axons. Panel (L) indicates a zone of overlap in the lateral OFC of midbrain dopaminergic axons (white) and basolateral amygdala (green) fibers in case A1129. Scale bars: A–D and I, 500 μm; E–H and L, 100 μm; J and K, 200 μm.
Axons of basolateral amygdala neurons were mainly distributed to the deep layers of AId2 and across the dysgranular and granular insular cortices. There was a second minor investment of BLA-derived axons in L2/3 of the AId2 (Fig. 13C).
Consistent with our examination of the distribution of dopaminergic axons in the OFC (see above), dopamine axons in the OFC largely filled AId2 with some extension medially to partially invest the LO and laterally into the caudal AId1; a smaller contingent of dopaminergic axons extended rostrally to invade parts of DLO1 and DLO2 (Fig. 13A).
Overall, convergence of thalamic, amygdaloid, and ventral mesencephalic axons in the OFC was quite restricted (see Fig. 13D, H). The BLA inputs to the AId2 were segregated from the MD innervation. A narrow band of dopaminergic axons in AId2 was positioned between the more ventral MD-derived axons and the dorsolaterally-situated BLA axons. It is, however, important to note that these different clusters of axons largely distributed to different lamina of AId2 and thus there was little convergence sensu stricto.
In a number of cases either the thalamic or amygdaloid tracer deposit failed or was misplaced. However, in all of these cases the other BDA injection (into either the BLA or MD) was successful and we therefore compared the distributions of the midbrain dopamine input and the thalamic or amygdaloid input. These cases also indicated that the three major subcortical inputs to the OFC largely targeted different areas within the ventrolateral frontal areas.
For example, case A1109 involved a BDA deposit into the mid-caudal MD, primarily in the lateral segment but also impinging on the central MD and the central lateral nucleus of the CM-PF complex. In this case, MD-derived axons at caudal levels were primarily seen in the medial aspects of the OFC (AIv), about 300 μm dorsal to the rhinal sulcus, and flanked ventrally and dorsally by zones of low density dopamine axons. More rostrally, the MD-derived inputs separated into two discontinuous areas, with the more lateral cluster of fibers largely separated from the dopamine axons in the AId2 or (at rostral levels) DLO2. In the rostral OFC, axons originating in the MD were largely absent.
In case A1112, in which the thalamic deposit primarily involved medial MD and slightly impinged on the central MD, anterogradely-labeled axons also displayed a discontinuous OFC innervation, with the more lateral of the two clusters of MD axons fibers extending to the LO, adjacent to the dopamine-innervated areas of AId2 and, more rostrally, DLO2 (Fig. 13I–K).
Neurons on the basolateral amygdala were largely segregated from the dopamine innervation of the OFC. For example, in case A1129, which involved a BDA deposit restricted to the BLA with no appreciable involvement of the lateral nucleus, axons from the BLA were found dorsal and lateral to the dopaminergic innervation of the AId1 and, at rostral levels, in the far lateral OFC in DLO1 and the granular cortex dorsal to DLO1 (Fig. 13L). Thus, the amygdala projection to the OFC was mainly distributed to the area dorsal and lateral to the dopamine innervation, whereas the thalamic innervation as mainly confined to territories medial to the dopamine axons.
Discussion
Technical considerations
We used retrograde tracing to determine the inputs to the orbitofrontal cortex. In most cases, we iontophoresed Fluoro-Gold, using a moderate current intensity to deliver the tracer. While this approach minimizes tracer uptake by axons-of-passage, we cannot exclude in any given case tracer accumulation by axons. Our limited anterograde data, which was primarily generated in order to examine overlap of axons in the OFC from thalamic, amygdaloid, and midbrain neurons, in some cases provided a means of confirming the retrograde tract tracing data.
We have assumed that transport occurs from the dense core of the deposit and not the penumbra, as suggested by Brog et al. (1993). Nonetheless, in most cases the core of the tracer deposit extended beyond the small dimensions of the cytoarchitectonically-defined areas that comprise the OFC. The issue of spread of the tracer is of particular concern in the deep layers of most OFC areas. For example, the dopamine innervation of the agranular insular cortices enters the OFC as a tight bundle of axons of ~350 μm width before spreading out to invest the more superficial layers, thus requiring deep layer tracer deposits of <350 μm in size to restrict labeling to inputs of one cytoarchitectonic area. However, the analysis of cases involving overlapping tracer deposits across successive areas of the OFC provided a means of assessing afferents to a particular area.
Afferents to the OFC
Afferents to the OFC arise from a large number of cortical and subcortical sites. Among the OFC afferents are those originating in the MD, BLA, and midbrain. Our data are largely consistent with and extend earlier reports on afferents from the MD and BLA complex to the rostral agranular insular cortex and surrounding regions (Alcaraz et al., 2016; Gerfen and Clavier, 1979; Krettek and Price, 1977a,b; Leonard, 2016; Mátyás et al., 2014; Reep and Winans, 1982; Reep et al., 1996).
Our data largely agree with previous studies of the thalamo-frontal projections, which have indicated that the MD projection to the OFC primarily originates in the central MD (Groenewegen, 1988; Kuramoto et al, 2016). However, as noted by Kuramoto and colleagues (2016) in their elegant single-cell reconstructions of thalamocortical projections, neurons in the medial or lateral MD also contribute to the OFC innervation. For example, in case A1014 our tracer deposit was centered in AId2 but extended somewhat into the LO medially, resulting in retrograde labeling in the medial and lateral as well as the central sectors of the MD.
Our data also offer new insights into the nature of the amygdala projection to the OFC. Previous studies have emphasized that the basolateral complex, including both the basolateral nucleus and the lateral nucleus, projects to the frontal cortices. We observed differences in the contribution of these two nuclei, mirroring functional differences in the lateral and basolateral nuclei (Pape et al., 1998; Yang and Wang, 2017). Tracer deposits of the AId2 labeled substantially more basolateral than lateral nucleus neurons, while injections involving the LO labeled more lateral than basolateral cells. A deposit in the VLOp failed to label significant numbers of cells in either basolateral or lateral nuclei, consistent with our anterograde observations. However, Reep et al. (1996) observed retrograde labeling in the BLA after rostral VLO tracer injections.
Just as the MD is not the sole source of thalamic projections to the prefrontal cortices, there are amygdaloid nuclei in addition to the basolateral complex that innervate the OFC. The basomedial nucleus (BMA), which has been previously noted to provide an input to the ventral mPFC (Petrovich et al., 1996) was labeled, particularly after tracer deposits into the central OFC, including the agranular insular regions AId2 and AId1. The OFC input from the basomedial complex is consistent with the anterograde data of Petrovich et al. (1996), who reported that the BMA projection to the OFC was substantially less dense than that targeting the mPFC. Our observation that retrograde labeling of the BMA is more prominent after tracer deposits of the central (AId2) OFC contrasts with the BLA efferents, which primarily target lateral OFC areas, including the dysgranular and granular insular cortices caudally and the DLO1 rostrally.
We observed retrogradely-labeled midbrain neurons in a broad swath extending from the supramammillary nucleus to the dorsal raphe (DR), including the VTA. In general, the rostral and caudal poles of this territory housed the greatest density of labeled cells (although in absolute terms this was a small number of neurons). Cells in the VTA were few in number and most often seen in the nucleus parabrachialis and the caudal linear nucleus (CL). The labeled cells in the CL were continuous with cells in the periaqueductal gray and anterior DR.
The overall density of retrograde labeling within the VTA did not vary markedly across different OFC tracer deposits, although there was a trend toward AId2 tracer deposits yielding more labeled midbrain cells than did injections of sites lateral or medial to the AId2. This is consistent with the dopamine innervation of the OFC being most dense in AId2. Moreover, tracer injections of AId2 resulted in greater retrograde labeling in the caudal linear nucleus (CL) than did deposits into other OFC areas. The anterior DR was retrogradely labeled after tracer deposits into all parts of the OFC, presumably reflecting filling of serotonergic and other neurons.
The projections from the midbrain to the OFC included dopaminergic and non-dopaminergic inputs. Previous studies had determined that the dopamine inputs to the frontal cortices arise exclusive from midbrain neurons and not diencephalic or other neurons. In an animal with tracer deposited into AId2 (case A1014), 22% of the retrogradely-labeled cells in the midbrain were dopaminergic. Similarly, a deposit into the LO region that extended slightly into AId2 (case A1065) retrogradely-labeled both dopaminergic neurons (29.5% of the total number of filled cells) and non-dopaminergic midbrain neurons. In both cases, most of these dopaminergic cells were in the caudal and dorsal extension of the A10 cell group (A10dc) in the CL and DR. This observation is similar to the pattern seen after mPFC tracer injections, in that Swanson (1982) determined that the percentage of midbrain dopamine neurons retrogradely-labeled after mPFC tracer deposits was markedly higher in the caudal linear than more rostral VTA areas. Yoshida et al. (1989) also concluded that dopamine neurons in the dorsal raphe were a major source of the PFC dopamine innervation.
Our studies revealed substantial differences in afferents to the OFC, including those originating in various cortices. For example, there were major differences in the degree of retrograde labeling of the mPFC after tracer deposits into various OFC sites. Labeling of neurons in the caudal (but not rostral) prelimbic and infralimbic cortices was much greater after tracer deposits into the AId2 than into other OFC areas. This observation agrees with general descriptions of mPFC projections to the OFC region in the hamster (Reep and Winans, 1982), rabbit (Buchanan et al., 1994), and rat (Sesack et al., 1989).
Retrograde labeling of the auditory cortex was almost exclusively seen after various OFC tracer deposits. This labeling was confined to the rostral auditory cortex, and has not been previously reported in the rat. In contrast to our observations, Reep et al. (1996) commented that they were unable to detect consistent reciprocal labeling of auditory areas following OFC tracer deposits. However, our finding of a relatively sparse input from the auditory cortex suggests a feedback loop involving the OFC and A1 region, consistent with a recent evidence for a direct OFC-A1 projection that is involved in determining the receptive fields of auditory cortex neurons (Winkowski et al., 2017). It is interesting to note that the presence of an auditory cortex projection to the OFC in primates is uncertain (Price, 2006).
A subcortical area that provides an OFC input is the hypothalamus. Projections from the lateral hypothalamus, including the perifornical area, to the mPFC have been previously reported (Fadel et al., 2002; Hoover and Vertes, 2007). Comparable data on the OFC are lacking, although Allen et al. (1991) reported a moderately dense projection to the posterior agranular insular cortex. We found that retrogradely-labeled cells were present in the lateral hypothalamus (LH), including the perifornical area (PFA), after tracer deposits of the OFC. Fluoro-Gold deposits into medial orbitofrontal areas, including the VLO and LO, only rarely retrogradely labeled LH neurons. Similarly, filled cells were rarely seen after FG deposits of the lateral OFC (AId1 and DI/GI). However, with tracer deposits into AId2 we observed a small number of LH cells that were back filled. Most of these neurons were in the lateral aspects of the LH. In some cases, a cluster of retrogradely-labeled cells were seen in the PFA.
The paucity of labeling in the PFA was unexpected in light of the presence of orexin (hypocretin) neurons in the dorsal perifornical and adjacent regions, which provide projections to all neocortical regions, including the OFC (Peyron et al., 1998). Thus, we would have expected orexin cells in the PFA to broadly innervate the OFC. One possible explanation is that there is a small number of orexin cells (Allard et al., 2004), and among this total population are discrete sub-populations that project to different areas of brain (Fadel et al., 2002).
We observed retrogradely-labeled neurons in the globus pallidus after OFC tracer deposits. Previous studies have noted projections from the basal forebrain to the mPFC and OFC, with neurons seen in the midposterior ventral pallidum and substantia innominata and nucleus basalis (Chandler et al., 2013; Grove, 1988; Hoover and Vertes, 2007; Reep et al., 1996). However, in contrast to our material, earlier studies did not report that the cluster of basal forebrain cells extends dorsally into the GP, on occasion for more than a millimeter. We were unable to discern a topographic organization of the GP projection to the OFC, although it appeared that the density of the pallidal labeling was greatest after tracer deposits into the AId2.
The dopaminergic innervation of OFC
We used tyrosine hydroxylase as a marker for dopamine axons in the frontal cortices. Although TH is the rate-limiting step of catecholamine biosynthesis and would therefore be expected to label both dopaminergic and noradrenergic axons, multiple studies in both primate and rodent cortex have found that TH antibodies preferentially label dopaminergic but not noradrenergic fibers (Gaspar et al., 1989; Noack and Lewis, 1989; Venator et al., 1999). While the precise percentage of noradrenergic axons that are TH-positive depends on both the TH antibody used and the area of brain examined, in all cases studied the great majority of TH-ir axons are not labeled by a dopamine-beta-hydroxylase antibody (Noack and Lewis, 1989).
Tyrosine hydroxylase-ir axons were discretely distributed within the OFC, in contrast to the broad pattern of staining revealed by dopamine-β-hydroxylase or norepinephrine transporter antibodies (Bradshaw et al., 2016; Radley et al., 2008). The pattern of TH labeling agrees well with previous data using high affinity uptake of [3H]-dopamine uptake (Berger et al., 1976; Descarries et al., 1987; Lindvall et al., 1978), histofluorescent methods such as the Falk-Hillarp or glyoxylic acid techniques (Berger et al., 1976; Lindvall and Bjorklund, 1974), TH immunohistochemistry (Febvret et al., 1991; Hokfelt et al., 1977, 1984), and dopamine immunohistochemistry (Kalsbeek et al., 1988; van de Werd and Uylings, 2008; van Eden et al., 1987). Specifically, we observed a relatively dense band of TH-ir axons that covered AId2 and extended into the lateral LO and medial AId1, consistent with the dopamine immunohisto-chemistry studies of van de Werd and Uylings (2008).
The density of the dopaminergic innervation of the OFC appears to be substantially lower than that observed in the medial PFC. This subjective impression is consistent with the quantitative data of Descarries et al. (1987), who reported that the density of the innervation of the dopamine-enriched area of the OFC (primarily AId2) was less than one third that of the prelimbic cortex in the mPFC.
These apparent differences in the density of the dopamine innervation of the mPFC and OFC as suggested by anatomical methods contrast with our biochemical data, which found that dopamine and norepinephrine concentrations in the mPFC and OFC were not different. Similarly, Slopsema et al. (1982), using a punch microdissection, found that dopamine concentrations were similar across the OFC and the medial precentral cortex of the mPFC (which was not included in our samples of the mPFC). In contrast, Jones et al. (1986) found that dopamine concentrations were roughly twice as high in the mPFC than OFC. Presumably, the lack of consistent results across reports concerning dopamine concentrations in the OFC reflect differences in the dissection procedure. In addition, TH-ir axon density is not indicative of the amount of dopamine stored in axons. Phosphorylation of TH determines the activity of the enzyme, which in turn is related to the amount of dopamine synthesized. Future studies using antibodies that recognize TH phosphorylated at different serine residues (see Salvatore et al., 2000; Xu et al., 1997) may help resolve the difference between biochemical and anatomical data.
In contrast to the dense retrograde labeling of the MD and BLA after tracer deposits into the OFC, few midbrain neurons were labeled after OFC tracer deposits; of these a small percentage were dopaminergic. This suggests that dopamine neurons that innervate the OFC have extensive terminal arbors, similar to nigrostriatal dopamine neurons (Matsuda et al., 2009).
Several studies have mapped the distribution of dopamine receptors in the frontal cortex, including the OFC (Gaspar et al., 1995; Santana et al., 2009; Wei et al., 2017). D1 and D2 receptor mRNAs are expressed in OFC neurons, with very little colocalization; the areal and laminar expression of D1-positive cells is considerably greater than that of D2 neurons. There have been no systematic studies of D3, D4, or D5 receptor distributions in the OFC. It is interesting to note that the distributions of dopamine receptor transcripts may extend beyond the regions of dopamine innervation (Gaspar et al., 1995; Thompson et al., 2016; Wei et al., 2017); future studies will be required to determine the precise localization of dopamine receptors in the OFC.
OFC afferents do not collateralize to innervate both mPFC and OFC
We did not observe double-labeled cells in the MD or PVT of animals with dual retrograde tracer deposits into the medial and lateral frontal territories, and saw only four double-labeled BLA cells and two double-labeled VTA neurons. These data suggest that neurons of three major subcortical areas that innervate the OFC do not branch to also innervate the mPFC. While we have found only very rarely do these neurons collateralize to innervate the mPFC and OFC, Chandler et al. (2013) reported a somewhat larger percentage of double-labeled VTA cells after dual injections into the mPFC and OFC. However, their tracer deposits appeared to target OFC regions situated more rostral than the locations of most of our tracer injections.
Our findings are consistent with the early studies of Fallon and colleagues (Fallon, 1981; Loughlin and Fallon, 1984) and Swanson (1982), who noted that there is little collateralization of VTA neurons to innervate more than one forebrain target in the rodent. In studies specifically examining if midbrain neurons projected to both the mPFC and OFC, both Sarter and Markowitsch (1984) and Sobel and Corbett (1984) reported that there was a very small population of double-labeled neurons in the VTA of rats receiving tracer injections into the mPFC and OFC. While there is a consensus that very few midbrain dopamine neurons in the rat collateralize to provide multiple telencephalic inputs, in the primate it appears that collateralization of mesotelencephalic dopamine neurons is relatively common (Willliams and Goldman-Rakic, 1998).
Krettek and Price (1977b) reported that the MD projection to the OFC is not homogeneous, but targets different subregions; this finding was elegantly confirmed by Kuramoto et al. (2016), using Sindbis virus-transfected cells to reconstruct single MD neurons in different parts of the MD. Sarter and Markowitsch (1984) noted that MD neurons do not collateralize to innervate the mPFC and OFC, consistent with our observations. Moreover, we did not observe double-labeled cells in the thalamic paraventricular nucleus, although single PVT neurons collateralize extensively to innervate the mPFC and other forebrain targets (Bubser and Deutch, 1998).
We found an average of approximately one double-labeled cell per animal after tracer deposits into the medial and lateral frontal cortical fields. This stands in contrast to the observation of Sarter and Markowitsch (1984), who reported that a substantial population of anterior BLA cells is double-labeled after injections of Fast Blue and Nuclear Yellow into the mPFC and OFC. Although these older tracers are avidly accumulated by axons of passage, in contrast to contemporary tracers such as (iontophoretically deposited) FG, Sarter and Markowitsch did not observe double-labeled thalamic or midbrain neurons, suggesting that uptake of axons traversing the medial frontal cortex may not explain the differences in the two studies.
We assessed possible collateralization of three major afferents to the OFC and mPFC. We did not systematically explore other areas that may harbor single neurons that branch to innervate both frontal cortical targets, such as the hippocampus (see Verwer et al., 1997).
The lack of collateralization of dopamine neurons innervating the OFC or mPFC has functional implications. The fact that separate midbrain dopamine neurons innervate the mPFC and OFC may explain why of lesions of the OFC do not disrupt working memory in rodents or humans (Dalley et al., 2004; Divac et al., 1975; Mishkin, 1964; Zald and Rausch, 2006), yet mPFC lesions cause working memory deficits with perseverative errors. Moreover, because single dopamine cells do not branch to innervate the OFC and mPFC, the dopaminergic contribution to the frontal cortices cannot be coordinately regulated by tegmentocortical projections. Instead, functional dopaminergic actions in the OFC and mPFC may be coordinated through reciprocal connections of the mPFC and OFC (predominantly involving AId2), or via long-loop feedback projections to the VTA.
Convergence of thalamic, amygdaloid, and midbrain afferents of the OFC
Defining the PFC on the basis of MD afferents posed early problems to investigators interested in cortical function across species: MD projections label different frontal areas of different species (Divac et al., 1978b). Divac (1978a,b) argued that the PFC could be defined across all mammals (and perhaps even birds [Divac and Mogenson, 1985; Mogenson and Divac, 1982]) by the convergence of projections originating in the MD, BLA, and dopaminergic cells of the midbrain.
The idea of convergent inputs was predominantly based on labeling of two or more subcortical regions after single retrograde tracer deposits into a cortical field. However, anterograde transport studies suggest that the pattern of labeling in the OFC from the MD may be spatially distinct from that of axons labeled after transport from the amygdala (Groenewegen, 1988; Kita and Kitai, 1990; Krettek and Price, 1977a,b).
To examine potential convergence of the major subcortical inputs to the OFC, we anterogradely labeled projections of the MD and BLA, and examined in the same cases the distribution of TH-ir axons in the cortex. We used TH-ir axons as a marker of the VTA input based on the data of Divac et al. (1978b), who found that dopamine axons in the frontal lobe are restricted to those areas that were innervated by the MD. It is possible that different results may be obtained if a third anterograde tracer, such as PHA-L, was placed in the VTA. However, such an approach would fail to label most of the large area (which extends from the mesodiencephalic juncture to the dorsal raphe) from which frontal cortical dopamine projections originate.
We observed that MD, BLA, and TH-ir axons were all present in the ventrolateral frontal cortex, but largely in different parts of the OFC. For example, the MD projection was primarily distributed to the more medial aspects of the OFC, from VLO to AId2. Moreover, anterogradely-labeled MD axons were primarily present in the superficial layers, consistent with the data of Krettek and Price (1977b). In contrast, axons labeled anterogradely from the amygdala were present in the more lateral aspects of the OFC, extending from areas dorsal to the DI to AId2.
The distributions of axons in the OFC revealed TH-ir (dopamine) axons filled AId2, and were flanked medially by MD axons and laterally by BLA axons, particularly in L2/3. However, all three types of axons were present in L1. This renders discussion of the “convergence” of MD, BLA, and VTA axons a matter that requires ultrastructural data to clarify. In the PFC, Kuroda et al. (1996) examined the convergence of VTA and MD axons on L5 neurons of the mPFC, finding that VTA axons synapsed preferentially on proximal dendrites while MD axon synapsed onto more distal dendrites.
Similar ultrastructural and physiological studies of the OFC will be required to help unravel the organization of microcircuits in AId2 and other OFC regions. However, because our data suggest that there is a general lack of spatial overlap of thalamic, amygdaloid, and midbrain dopamine inputs to much of the OFC, only AId2 can be considered a “prefrontal” cortex as defined by Divac and colleagues (1978b).
Topography of afferents and parcellation of the OFC
The retrograde labeling of thalamic and amygdaloid projection neurons to the OFC suggested a crude topographic organization, with MD neurons investing the medial OFC and amygdaloid neurons the lateral OFC.
Most of our tracer injections were not confined to one of the 14 cytoarchitectonic areas that comprise the rat OFC (see van der Werd and Uylings, 2008). However, overlapping tracer deposits allowed us to detect a general pattern in the organization of OFC afferents, identifying three regions of the OFC: medial, central, and lateral. Thus, we found that MD neurons being most heavily labeled after medial sector tracer deposits (including the VLO and LO). Our anterograde cases similarly revealed that the MD projection to the OFC was largely confined to the medial sector, with few axons reaching AId2. Early studies using relatively large tritiated amino acid deposits showed a more lateral innervation, and also showed a complete circling of the cortex at rostral OFC levels. In contrast, our anterograde data showed only rare MD-derived axons in the rostral OFC.
Our retrograde labeling revealed significant amygdala labeling after injections into the central (AId2) and lateral (AId1, DI, and GI) OFC; in the medial OFC (VLO and LO) labeling was less dense or absent. Consistent with these observations, our anterograde cases indicated projections to the same lateral OFC areas.
We could not detect a topographic organization of midbrain projections to the OFC because so few cells were labeled across a large spatial area. Tyrosine hydroxylase-immunoreactive axons were distributed to the central OFC, which is centered in AId2 and, as shown in our anterograde tracing studies, interposed between the thalamic and amygdaloid projections.
These observations suggest a general organization of the ventrolateral frontal cortex with three territories (medial, central, and lateral) comprising the OFC. This is a simplification, because most inputs to the OFC are not strictly confined to cytoarchitectonically-defined areas of the OFC. For example, the midbrain dopamine innervation fills all of AId2 but there is significant medial and lateral spread into contiguous regions (LO and AId2).
We have primarily based this cortical parcellation on OFC projections of the MD, BLA, and midbrain DA neurons. However, some other projections appear to conform to this organizational scheme. For example, the basomedial amygdala projection to the OFC is to the central (AId2) area, with more sparse retrograde labeling after medial and lateral FG deposits.
The organizational scheme outlined above holds for the posterior two thirds of the OFC. However, we lacked a sufficient number of anterior OFC cases to be able to state that the rostral OFC (at the level of the anterior olfactory nucleus) follows this organization. Our anterograde tracer cases, which were performed to determine if there is spatial overlap (convergence) of the thalamic, amygdaloid, and midbrain innervations of the OFC, suggest that the anterior OFC may differ from the posterior aspects. As noted above, the MD innervation of posterior OFC primarily involved VLO and LO, but was largely absent from the DI and GI in the lateral OFC. In contrast, we did not observe a significant MD-derived innervation of the rostral OFC, including the rostral extensions of the VO, VLO, and LO. These findings are consistent with a tripartite organization of most of the OFC, but not including the rostral OFC.
Functional implications
The functional organization of the frontal lobes has long been of interest, sparked in the late 19th century by the failure of cortical stimulation rostral to the motor cortex to elicit movement (Hitzig, 1903) as well as the case of Phineas Gage (see Taylor and Gross, 2003). The early 20th century brought concerted efforts to unravel the functions of the frontal cortex by luminaries such as Shepard Ivory Franz, Karl Lashley, and Carlyle Jacobsen. Although Franz and Lashley in particular argued strongly against a rigid localization of function, these investigators set the stage for approaches to defining function of brain regions. More recent lesion studies (Chudasama et al., 2003; Cobo et al., 1989; Corwin et al., 1994; de Bruin et al., 1983; Kolb et al., 1974a,b,c; Lacroix et al., 2000), have suggested that the OFC is involved in aggression, response inhibition, and social behavior. However, traditional lesion studies lack the spatial resolution to ablate selectively small areas such as AId2 or the LO, rendering interpretation of the results difficult. This unfortunate situation may have contributed to the tendency of many investigators to operationally define the OFC instead of defining this cortical area on the basis of clearly articulated criteria.
In recent years, the introduction of optogenetic methods has made it possible to investigate more precisely the functions of different areas within the OFC. A number of groups have implicated the OFC in the pathophysiology of obsessive compulsive disorder (OCD) (Baxter et al., 1987; Brambilla et al., 2002; Chamberlain et al., 2005). Ahmari et al. (2013) found that stimulating the OFC resulted in excessive self-grooming in mice, which was reversed by administration of fluoxetine, a treatment for OCD. Burguière et al. (2013) reported that optogenetic stimulation of the OFC reversed the excessive grooming of the Sapap3 mutant mouse. However, Ahmari et al. focused their attention on the rostral MO and VO areas, while in the study of Burguière et al. the optical fiber was placed in the LO and DLO. In light of the technical difficulties encountered in fMRI studies of the OFC in humans and animals (see Stenger, 2006), coupled with relatively poor spatial resolution, it will be important to define more carefully the area of stimulation. In turn, this will require that investigators define the precise area of the OFC: the term OFC has been ubiquitously used to describe a heterogeneous region that requires more precise definition (Murray et al., 2007). An excellent recent review by Izquierdo (2017), which synthesizes the behavioral data on the OFC in response to various manipulations, may provide a map for approaching a fine-grained understanding of the functional correlates of the OFC.
It is currently difficult to coherently link data on any of the multiple functional roles that have been proposed for the OFC. For example, the agranular insular cortex has been reported to sustain high rates of intracranial self-stimulation in the rat, apparently in a dopamine-dependent manner (Clavier and Gerfen, 1979). However, a subsequent study by the same investigators somewhat paradoxically reported that self-stimulation of the sulcal region did not depend on presynaptic release of dopamine (Gerfen and Clavier, 1981). Nonetheless, these reports anticipated a large number of investigations into the role of the OFC in drug abuse, ranging from studies of craving to perseverative behavior and response anticipation (see Goldstein et al., 2006; Schoenbaum et al., 2016).
In the mouse, Gremel et al. (2016) showed that the endocannabinoid mechanisms in the OFC are critical for goal-directed behavior. The OFC has also been implicated in drug-seeking behavior. Lasseter et al. (2014) found that infusions of the D1 antagonist SCH23390 into the PFC attenuated cocaine-seeking behaviors, and pointed to an OFC-BLA circuit as particularly important in this behavior. Arguello et al. (2017) showed that the projection from OFC to the BLA, but not the reciprocal BLA-OFC projection, is important for conditioned stimulus-induced reinstatement of cocaine-seeking.
It becomes difficult to place these studies into a consistent framework because different subregions within the OFC, including the rostral LO (Gremel et al., 2016), AIv and medial LO (Lasseter et al., 2014), LO and AId2 (Arguello et al., 2017), and AId2 (Lucantonio et al., 2014), have been manipulated or evaluated. These studies varied as well in the degree of extra-target involvement (such a spread of channelopsin transfection or drug). While it is possible that different behaviors related to drug abuse are expressed throughout the OFC, this would suggest that there are core circuits comprised of the afferents to and efferents from different OFC sectors that are common to all the behaviors.
Conclusions
The OFC is comprised of a number of anatomically distinct areas. The term OFC has been used in recent literature to refer to any combination of areas or single area within the ventral frontal cortex, and its definition varies between research groups. Our data indicate that there are distinct differences in the OFC regions that can be defined on the basis of afferents, and that the OFC is generally comprised of three segments: medial (including LO and VLO), central (largely comprised of AId2), and lateral (AId1, DI and GI).
Figure 14.
Schematic representation of proposed parcellation of the OFC based on organization of afferents. There are three major divisions of the OFC arranged medially to laterally. The most medial division, which encompasses the VLO and LO, received major inputs from the mediodorsal thalamus (red), primarily the central segment. The smallest of the divisions, which includes all of AId2, receives inputs from the dopamine neurons in the midbrain A10 cells (blue), particularly those in the posterior DA cell region (A10dc) of the caudal linear, periaqueductal gray, and dorsal raphe regions. The input from the basolateral amygdala primarily targets the lateral OFC (green), including AId1, DI, and GI. Thus, the central dopamine region is flanked by the thalamic and amygdaloid inputs. The assignments of afferents to specific cytoarchitectonic regions of the OFC are not strictly confined to cytoarchitectonic regions or the three OFC domains, but extend to invade adjacent territories to varying degrees. This can be seen most clearly in the case of the central OFC, in which the inputs to the AId2, the boundaries of which are depicted by dotted lines, extend into the medial OFC (LO) and the lateral OFC (AId1).
Acknowledgments
We are indebted to Hui-Dong Wang, Ph.D. for assistance with surgical procedures and histological preparation, and Allyson P. Mallya for helpful comments and suggestions. This work was supported in part by MH077298 (AYD) from the National Institute of Mental Health and the Neurochemistry Core of NICHD Grant P30HD15052 to the Vanderbilt Kennedy Center for Research on Human Development. The content is solely the responsibility of the authors and does not necessarily represent the official views of NIMH, NICHD, or the NIH.
Abbreviations
- A10dc
dorsocaudal extent of the A10 cell group
- A10vr
ventrorostral extent of the A10 cell group
- ac
anterior commissure
- AI
agranular insular cortex
- AId
dorsal agranular insular cortex
- AId1
dorsal agranular insular cortex, dorsal part
- AId2
dorsal agranular insular cortex, ventral part
- AIv
ventral agranular insular cortex
- alv
alveus of the hippocampus
- AST
amygdalostriatal transition zone
- BLA
basolateral amygdala
- BMA
basomedial amygdala
- CL
central lateral nucleus of the thalamus
- CM
central medial nucleus of the thalamus
- cp
caudatoputamen
- DBB
diagonal band of Broca
- DI
dysgranular insular cortex
- DLO
dorsolateral orbitofrontal cortex
- DLO1
dorsolateral orbitofrontal cortex, dorsal part
- DLO2
dorsolateral orbitofrontal cortex, ventral part
- ENT
Entorhinal cortex
- fr
fasciculus retroflexus
- GI
granular insular cortex
- GP
globus pallidus
- IAM
interanteromedial nucleus of the thalamus
- IL
infralimbic cortex
- IMD
intermediodorsal nucleus of the thalamus
- Lat
lateral nucleus of the amygdala
- LH
lateral hypothalamus
- LO
lateral orbitofrontal cortex
- MD
mediodorsal nucleus of the thalamus
- MO
medial orbitofrontal cortex
- mPFC
medial prefrontal cortex
- OFC
orbitofrontal cortex
- PC
paracentral nucleus of the thalamus
- PF
parafascicular nucleus of the thalamus
- PFC
prefrontal cortex
- PL
prelimbic cortex
- PVT
paraventricular nucleus of the thalamus
- rs
rhinal sulcus
- SI
substantia innominata
- Sub
subiculum
- VLO
ventrolateral orbitofrontal cortex
- VLOp
posterior ventrolateral orbitofrontal cortex
- VO
ventral orbitofrontal cortex
- VM
ventromedial nucleus of the thalamus
- VPM
ventral posteromedial nucleus of the thalamus
- VTA
ventral tegmental area
Footnotes
AUTHOR CONTRIBUTIONS
Both authors had full access to all the data in the study and take responsibility for the integrity and presentation of the data. Study concept and design: MJMM and AYD; acquisition of data: MJMM and AYD; analysis and interpretation of data: MJMM and AYD; writing of the manuscript: MJMM and AYD; conceptualization and critical revision of the manuscript for intellectual content: MJMM and AYD.
References
- Abi-Dargham A. Schizophrenia: overview and dopamine dysfunction. Journal of Clinical Psychiatry. 2014;75(11):e31. doi: 10.4088/JCP.13078tx2c. http://doi.org/10.4088/JCP.13078tx2c. [DOI] [PubMed] [Google Scholar]
- Ahmari SE, Spellman T, Douglass NL, Kheirbek MA, Simpson HB, Deisseroth K, et al. Repeated cortico-striatal stimulation generates persistent OCD-like behavior. Science. 2013;340(6137):1234–1239. doi: 10.1126/science.1234733. http://doi.org/10.1126/science.234733. [DOI] [PMC free article] [PubMed] [Google Scholar]
- Alcaraz F, Marchand AR, Courtand G, Coutureau E, Wolff M. Parallel inputs from the mediodorsal thalamus to the prefrontal cortex in the rat. European Journal of Neuroscience. 2016;44(3):1972–1986. doi: 10.1111/ejn.13316. http://doi:10.1111/ejn.13316. [DOI] [PubMed] [Google Scholar]
- Allard JS, Tizabi Y, Shaffery JP, Trouth CO, Manaye K. Stereological analysis of the hypothalamic hypocretin/orexin neurons in an animal model of depression. Neuropeptides. 2004;38(5):311–5. doi: 10.1016/j.npep.2004.06.004. [DOI] [PubMed] [Google Scholar]
- Allen GV, Saper CB, Hurley KM, Cechetto DF. Organization of visceral and limbic connections in the insular cortex of the rat. Journal of Comparative Neurology. 1991;311(1):1–16. doi: 10.1002/cne.903110102. [DOI] [PubMed] [Google Scholar]
- Arguello AA, Richardson BD, Hall JL, Wang R, Hodges MA, Mitchell MP, … Fuchs RA. Role of a lateral orbital frontal cortex-basolateral amygdala circuit in cue-induced cocaine-seeking behavior. Neuropsychopharmacology. 2017;42(3):727–735. doi: 10.1038/npp.2016.157. http://doi.org/10.1038/npp.2016.157. [DOI] [PMC free article] [PubMed] [Google Scholar]
- Baxter LR, Phelps ME, Mazziotta JC, Guze BH, Schwartz JM, Selin CE. Local cerebral glucose metabolic rates in obsessive-compulsive disorder. A comparison with rates in unipolar depression and in normal controls. Archives of General Psychiatry. 1987;44(3):211–218. doi: 10.1001/archpsyc.1987.01800150017003. [DOI] [PubMed] [Google Scholar]
- Beckstead RM. Convergent thalamic and mesencephalic projections to the anterior medial cortex in the rat. Journal of Comparative Neurology. 1976;166:403–416. doi: 10.1002/cne.901660403. [DOI] [PubMed] [Google Scholar]
- Berger B, Thierry AM, Tassin JP, Moyne MA. Dopaminergic innervation of the rat prefrontal cortex: a fluorescence histochemical study. Brain Research. 1976;106:133–145. doi: 10.1016/0006-8993(76)90078-0. [DOI] [PubMed] [Google Scholar]
- Bolkan SS, Poyraz FC, Kellendonk C. Using human brain imaging studies as a guide towards animal models of schizophrenia. Neuroscience. 2016;321:77–98. doi: 10.1016/j.neuroscience.2015.05.055. http://doi.org/10.1016/j.neuroscience.2015.05.055. [DOI] [PMC free article] [PubMed] [Google Scholar]
- Bradshaw SE, Agster KL, Waterhouse BD, McGaughy JA. Age-related changes in prefrontal norepinephrine transporter density: The basis for improved cognitive. Brain Research. 2016;1641(Part B):245–257. doi: 10.1016/j.brainres.2016.01.001. http://doi.org/10.1016/j.brainres.2016.01.001. [DOI] [PMC free article] [PubMed] [Google Scholar]
- Brambilla P, Barale F, Caverzasi E, Soares JC. Anatomical MRI findings in mood and anxiety disorders. Epidemiologia e Psichiatria Sociale. 2002;11(2):88–99. doi: 10.1017/s1121189x00005558. [DOI] [PubMed] [Google Scholar]
- Brog JS, Salyapongse A, Deutch AY, Zahm DS. The patterns of afferent innervation of the core and shell in the “accumbens” part of the rat ventral striatum: immunohistochemical detection of retrogradely transported fluoro-gold. Journal of Comparative Neurology. 1993;338(2):255–278. doi: 10.1002/cne.903380209. [DOI] [PubMed] [Google Scholar]
- Bubser M, Deutch AY. Thalamic paraventricular nucleus neurons collateralize to innervate the prefrontal cortex and nucleus accumbens. Brain Research. 1998;787(2):304–310. doi: 10.1016/s0006-8993(97)01373-5. [DOI] [PubMed] [Google Scholar]
- Buchanan SL, Thompson RH, Maxwell BL, Powell DA. Efferent connections of the medial prefrontal cortex in the rabbit. Experimental Brain Research. 1994;100:469–483. doi: 10.1007/BF02738406. [DOI] [PubMed] [Google Scholar]
- Bunney BS, Aghajanian GK. Dopamine and norepinephrine innervated cells in the rat prefrontal cortex: pharmacological differentiation using microiontophoretic techniques. Life Sciences. 1976;19(11):1783–1789. doi: 10.1016/0024-3205(76)90087-4. [DOI] [PubMed] [Google Scholar]
- Burguière E, Monteiro P, Feng G, Graybiel AM. Optogenetic stimulation of lateral orbitofronto-striatal pathway suppresses compulsive behaviors. Science. 2013;340(6137):1243–1246. doi: 10.1126/science.1232380. http://doi.org/10.1126/science.1232380. [DOI] [PMC free article] [PubMed] [Google Scholar]
- Carlén M. What constitutes the prefrontal cortex? Science. 2017;358(6362):478–482. doi: 10.1126/science.aan8868. [DOI] [PubMed] [Google Scholar]
- Chamberlain SR, Blackwell AD, Fineberg NA, Robbins TW, Sahakian BJ. The neuropsychology of obsessive compulsive disorder: the importance of failures in cognitive and behavioural inhibition as candidate endophenotypic markers. Neuroscience and Biobehavioral Reviews. 2005;29(3):399–419. doi: 10.1016/j.neubiorev.2004.11.006. http://doi.org/10.1016/j.neubiorev.2004.11.006. [DOI] [PubMed] [Google Scholar]
- Chandler DJ, Lamperski CS, Waterhouse BD. Identification and distribution of projections from monoaminergic and cholinergic nuclei to functionally differentiated subregions of prefrontal cortex. Brain Research. 2013;1522:38–58. doi: 10.1016/j.brainres.2013.04.057. http://doi.org/10.1016/j.brainres.2013.04.057. [DOI] [PMC free article] [PubMed] [Google Scholar]
- Chudasama Y, Robbins TW. Dissociable contributions of the orbitofrontal and infralimbic cortex to pavlovian autoshaping and discrimination reversal learning: further evidence for the functional heterogeneity of the rodent frontal cortex. Journal of Neuroscience. 2003;23(25):8771–8780. doi: 10.1523/JNEUROSCI.23-25-08771.2003. [DOI] [PMC free article] [PubMed] [Google Scholar]
- Clavier RM, Gerfen CR. Self-stimulation of the sulcal prefrontal cortex in the rat: direct evidence for ascending dopaminergic mediation. Neuroscience Letters. 1979;12(2–3):83–87. doi: 10.1016/0304-3940(79)96059-2. [DOI] [PubMed] [Google Scholar]
- Cobo M, Ferrer JM, Mora F. The role of the lateral cortico-cortical prefrontal pathway in self-stimulation of the medial prefrontal cortex in the rat. Behavioural Brain Research. 1989;31(3):257–265. doi: 10.1016/0166-4328(89)90007-7. [DOI] [PubMed] [Google Scholar]
- Corwin JV, Fussinger M, Meyer RC, King VR, Reep RL. Bilateral destruction of the ventrolateral orbital cortex produces allocentric but not egocentric spatial deficits in rats. Behavioural Brain Research. 1994;61(1):79–86. doi: 10.1016/0166-4328(94)90010-8. [DOI] [PubMed] [Google Scholar]
- Dalley JW, Cardinal RN, Robbins TW. Prefrontal executive and cognitive functions in rodents: neural and neurochemical substrates. Neuroscience and Biobehavioral Reviews. 2004;28(7):771–784. doi: 10.1016/j.neubiorev.2004.09.006. http://doi.org/10.1016/j.neubiorev.2004.09.006. [DOI] [PubMed] [Google Scholar]
- Davis KL, Kahn RS, Ko G, Davidson M. Dopamine in schizophrenia: a review and reconceptualization. American Journal of Psychiatry. 1991;148(11):1474–1486. doi: 10.1176/ajp.148.11.1474. http://doi.org/10.1176/ajp.148.11.1474. [DOI] [PubMed] [Google Scholar]
- de Bruin JP, van Oyen HG, Van de Poll N. Behavioural changes following lesions of the orbital prefrontal cortex in male rats. Behavioural Brain Research. 1983;10(2–3):209–232. doi: 10.1016/0166-4328(83)90032-3. [DOI] [PubMed] [Google Scholar]
- Descarries L, Lemay B, Doucet G, Berger B. Regional and laminar density of the dopamine innervation in adult rat cerebral cortex. Neuroscience. 1987;21(3):807–824. doi: 10.1016/0306-4522(87)90038-8. [DOI] [PubMed] [Google Scholar]
- Deutch AY. The regulation of subcortical dopamine systems by the prefrontal cortex: interactions of central dopamine systems and the pathogenesis of schizophrenia. Journal of Neural Transmission Supplement. 1992;36:61–89. doi: 10.1007/978-3-7091-9211-5_5. [DOI] [PubMed] [Google Scholar]
- Deutch AY, Cameron DS. Pharmacological characterization of dopamine systems in the nucleus accumbens core and shell. Neuroscience. 1992;46(1):49–56. doi: 10.1016/0306-4522(92)90007-o. [DOI] [PubMed] [Google Scholar]
- Divac I, Kosmal A, Björklund A, Lindvall O. Subcortical projections to the prefrontal cortex in the rat as revealed by the horseradish peroxidase technique. Neuroscience. 1978a;3(9):785–796. doi: 10.1016/0306-4522(78)90031-3. [DOI] [PubMed] [Google Scholar]
- Divac I, Björklund A, Lindvall O, Passingham RE. Converging projections from the mediodorsal thalamic nucleus and mesencephalic dopaminergic neurons to the neocortex in three species. Journal of Comparative Neurology. 1978b;180(1):59–72. doi: 10.1002/cne.901800105. http://doi.org/10.1002/cne.901800105. [DOI] [PubMed] [Google Scholar]
- Divac I, Mogensen J. The prefrontal “cortex” in the pigeon catecholamine histofluorescence. Neuroscience. 1985;15(3):677–682. doi: 10.1016/0306-4522(85)90069-7. [DOI] [PubMed] [Google Scholar]
- Divac I, Wikmark R, Gade A. Spontaneous alternation in rats with lesions in the frontal lobes: an extension of the frontal lobe syndrome. Physiological Psychology. 1975;3(1):39–42. [Google Scholar]
- Domesick VB. Thalamic relationships of the medial cortex in the rat. Brain Behavior and Evolution. 1972;6:457–483. doi: 10.1159/000123727. [DOI] [PubMed] [Google Scholar]
- Fadel J, Bubser M, Deutch AY. Differential activation of orexin neurons by antipsychotic drugs associated with weight gain. Journal of Neuroscience. 2002;22(15):6742–6747. doi: 10.1523/JNEUROSCI.22-15-06742.2002. [DOI] [PMC free article] [PubMed] [Google Scholar]
- Fallon JH. Collateralization of monoamine neurons: mesotelencephalic dopamine projections to caudate, septum, and frontal cortex. Journal of Neuroscience. 1981;1(12):1361–1368. doi: 10.1523/JNEUROSCI.01-12-01361.1981. [DOI] [PMC free article] [PubMed] [Google Scholar]
- Febvret A, Berger B, Gaspar P, Verney C. Further indication that distinct dopaminergic subsets project to the rat cerebral cortex: lack of colocalization with neurotensin in the superficial dopaminergic fields of the anterior cingulate, motor, retrosplenial and visual cortices. Brain Research. 1991;547(1):37–52. doi: 10.1016/0006-8993(91)90572-d. [DOI] [PubMed] [Google Scholar]
- Fettes P, Schulze L, Downar J. Cortico-striatal-thalamic loop circuits of the orbitofrontal cortex: Promising therapeutic targets in psychiatric illness. Frontiers in Systems Neuroscience. 2017;11:25. doi: 10.3389/fnsys.2017.00025. [DOI] [PMC free article] [PubMed] [Google Scholar]
- Fuxe K, Hokfelt T, Johansson O, Jonsson G, Lidbrink P, Ljungdahl A. The origin of the dopamine nerve terminals in limbic and frontal cortex. Evidence for meso-cortico dopamine neurons. Brain Research. 1974;82(2):349–355. doi: 10.1016/0006-8993(74)90618-0. [DOI] [PubMed] [Google Scholar]
- Gaspar P, Berger B, Febvret A, Vigny A, Henry JP. Catecholamine innervation of the human cerebral cortex as revealed by comparative immunohistochemistry of tyrosine hydroxylase and dopamine-beta-hydroxylase. Journal of Comparative Neurology. 1989;279(2):249–271. doi: 10.1002/cne.902790208. http://doi.org/10.1002/cne.902790208. [DOI] [PubMed] [Google Scholar]
- Gaspar P, Bloch B, Le Moine C. D1 and D2 receptor gene expression in the rat frontal cortex: cellular localization in different classes of efferent neurons. European Journal of Neuroscience. 1995;7(5):1050–1063. doi: 10.1111/j.1460-9568.1995.tb01092.x. [DOI] [PubMed] [Google Scholar]
- Gerfen CR, Clavier RM. Neural inputs to the prefrontal agranular insular cortex in the rat: horseradish peroxidase study. Brain Research Bulletin. 1979;4(3):347–353. doi: 10.1016/s0361-9230(79)80012-x. [DOI] [PubMed] [Google Scholar]
- Gerfen CR, Clavier RM. Intracranial self-stimulation from the sulcal prefrontal cortex in the rat: the effect of 6-hydroxydopamine or kainic acid lesions at the site of stimulation. Brain Research. 1981;224(2):291–304. doi: 10.1016/0006-8993(81)90860-x. [DOI] [PubMed] [Google Scholar]
- Goldstein RZ, Alia-Klein N, Cottone LA, Volkow ND. The orbitofrontal cortex in drug addiction. In: Zald DH, Rauch SL, editors. The Orbitofrontal Cortex. Oxford, UK: Oxford University Press; 2006. pp. 481–522. [Google Scholar]
- Gremel CM, Chancey JH, Atwood BK, Luo G, Neve R, Ramakrishnan C, et al. Endocannabinoid modulation of orbitostriatal circuits gates habit formation. Neuron. 2016;90(6):1312–1324. doi: 10.1016/j.neuron.2016.04.043. http://doi.org/10.1016/j.neuron.2016.04.043. [DOI] [PMC free article] [PubMed] [Google Scholar]
- Groenewegen HJ. Organization of the afferent connections of the mediodorsal thalamic nucleus in the rat, related to the mediodorsal-prefrontal topography. Neuroscience. 1988;24(2):379–431. doi: 10.1016/0306-4522(88)90339-9. [DOI] [PubMed] [Google Scholar]
- Grove EA. Efferent connections of the substantia innominata in the rat. Journal of Comparative Neurology. 1988;277(3):347–364. doi: 10.1002/cne.902770303. [DOI] [PubMed] [Google Scholar]
- Hitzig E. Alte und neue untersuchungen uber as Gehirn. Archiv fur psychiatrie und nervenkrankheiten. 1903:37. [Google Scholar]
- Hökfelt T, Fuxe K, Johansson O, Ljungdahl A. Pharmaco-histochemical evidence of the existence of dopamine nerve terminals in the limbic cortex. European Journal of Pharmacology. 1974a;25:108–112. doi: 10.1016/0014-2999(74)90101-0. [DOI] [PubMed] [Google Scholar]
- Hökfelt T, Johansson O, Fuxe K, Goldstein M, Park D. Immunohistochemical studies on the localization and distribution of monoamine neuron systems in the rat brain II. Tyrosine hydroxylase in the telencephalon. Medical Biology. 1977;55(1):21–40. [PubMed] [Google Scholar]
- Hökfelt T, Martensson TR, Bjorklund A, Kleinau S, Goldstein M. Distributional maps of tyrosine-hydroxylase-immunoreactive neurons in the rat brain. In: Bjorklund A, Hokfelt T, editors. Handbook of Chemical Neuroanatomy. Amsterdam: Elsevier; 1984. pp. 277–379. Vol. 2: Classical Transmitters in the CNS, Part I. [Google Scholar]
- Hoover WB, Vertes RP. Anatomical analysis of afferent projections to the medial prefrontal cortex in the rat. Brain Structure and Function. 2007;212(2):149–179. doi: 10.1007/s00429-007-0150-4. http://doi.org/10.1007/978-3-642-70573-1. [DOI] [PubMed] [Google Scholar]
- Hoover WB, Vertes RP. Projections of the medial orbital and ventral orbital cortex in the rat. Journal of Comparative Neurology. 2011;519(18):3766–3801. doi: 10.1002/cne.22733. http://doi.org/10.1002/cne.903240109. [DOI] [PubMed] [Google Scholar]
- Izquierdo A. Functional heterogeneity within rat orbitofrontal cortex in reward learning and decision making. Journal of Neuroscience. 2017;37:10529–10540. doi: 10.1523/JNEUROSCI.1678-17.2017. [DOI] [PMC free article] [PubMed] [Google Scholar]
- Jones MW, Kilpatrick IC, Phillipson OT. The agranular insular cortex: a site of unusually high dopamine utilisation. Neuroscience Letters. 1986;72(3):330–334. doi: 10.1016/0304-3940(86)90536-7. [DOI] [PubMed] [Google Scholar]
- Kalsbeek A, Voorn P, Buijs RM, Pool CW, Uylings HB. Development of the dopaminergic innervation in the prefrontal cortex of the rat. Journal of Comparative Neurology. 1988;269(1):58–72. doi: 10.1002/cne.902690105. http://doi.org/10.1002/cne.902690105. [DOI] [PubMed] [Google Scholar]
- Kambeitz J, Abi-Dargham A, Kapur S, Howes OD. Alterations in cortical and extrastriatal subcortical dopamine function in schizophrenia: systematic review and meta-analysis of imaging studies. British Journal of Psychiatry. 2014;204(6):420–429. doi: 10.1192/bjp.bp.113.132308. http://doi.org/10.1192/bjp.bp.113.132308. [DOI] [PubMed] [Google Scholar]
- Kita H, Kitai ST. Amygdaloid projections to the frontal cortex and the striatum in the rat. Journal of Comparative Neurology. 1990;298(1):40–49. doi: 10.1002/cne.902980104. [DOI] [PubMed] [Google Scholar]
- Kolb B. Dissociation of the effects of lesions of the orbital or medial aspect of the prefrontal cortex of the rat with respect to activity. Behavioral Biology. 1974a;10(3):329–343. doi: 10.1016/s0091-6773(74)91924-5. [DOI] [PubMed] [Google Scholar]
- Kolb B. Prefrontal lesions alter eating and hoarding behavior in rats. Physiology & Behavior. 1974b;12(3):507–511. doi: 10.1016/0031-9384(74)90130-9. [DOI] [PubMed] [Google Scholar]
- Kolb B. Social behavior of rats with chronic prefrontal lesions. Journal of Comparative and Physiological Psychology. 1974c;87(3):466–474. doi: 10.1037/h0036969. [DOI] [PubMed] [Google Scholar]
- Krettek JE, Price JL. A direct input from the amygdala to the thalamus and the cerebral cortex. Brain Research. 1974;67:169–174. doi: 10.1016/0006-8993(74)90309-6. [DOI] [PubMed] [Google Scholar]
- Krettek JE, Price JL. Projections from the amygdaloid complex to the cerebral cortex and thalamus in the rat and cat. Journal of Comparative Neurology. 1977a;172(4):687–722. doi: 10.1002/cne.901720408. http://doi.org/10.1002/cne.901720408. [DOI] [PubMed] [Google Scholar]
- Krettek JE, Price JL. The cortical projections of the mediodorsal nucleus and adjacent thalamic nuclei in the rat. Journal of Comparative Neurology. 1977b;171(2):157–191. doi: 10.1002/cne.901710204. http://doi.org/10.1002/cne.901710204. [DOI] [PubMed] [Google Scholar]
- Kuroda M, Murakami K, Igarashi H, Okada A. The convergence of axon terminals from the mediodorsal thalamic nucleus and ventral tegmental area on pyramidal cells in layer V of the rat prelimbic cortex. European Journal of Neuroscience. 1996;8(7):1340–1349. doi: 10.1111/j.1460-9568.1996.tb01596.x. [DOI] [PubMed] [Google Scholar]
- Kuramoto E, Pan S, Furuta T, Tanaka YR, Iawi H, Yamanaka A, … Hioki H. Individual mediodorsal thalamic neurons project to multiple areas of the rat prefrontal cortex: a single neuron-tracing study using virus vectors. Journal of Comparative Neurology. 2016;525:166–185. doi: 10.1002/cne.24054. [DOI] [PubMed] [Google Scholar]
- Lacroix L, Spinelli S, White W, Feldon J. The effects of ibotenic acid lesions of the medial and lateral prefrontal cortex on latent inhibition, prepulse inhibition and amphetamine-induced hyperlocomotion. Neuroscience. 2000;97(3):459–468. doi: 10.1016/s0306-4522(00)00013-0. [DOI] [PubMed] [Google Scholar]
- Lasseter HC, Xie X, Arguello AA, Wells AM, Hodges MA, Fuchs RA. Contribution of a mesocorticolimbic subcircuit to drug context-induced reinstatement of cocaine-seeking behavior in rats. Neuropsychopharmacology. 2014;39(3):660–669. doi: 10.1038/npp.2013.249. http://doi.org/10.1038/npp.2013.249. [DOI] [PMC free article] [PubMed] [Google Scholar]
- Leonard CM. Finding the prefrontal cortex in the rat. Brain Research. 2016;1645:1–3. doi: 10.1016/j.brainres.2016.02.002. [DOI] [PubMed] [Google Scholar]
- Leonard CM. The prefrontal cortex of the rat. I. Cortical projection of the mediodorsal nucleus. II. Efferent connections. Brain Research. 1969;12(2):321–343. doi: 10.1016/0006-8993(69)90003-1. [DOI] [PubMed] [Google Scholar]
- Lindvall O, Björklund A. The organization of the ascending catecholamine neuron systems in the rat brain as revealed by the glyoxylic acid fluorescence method. Acta Physiologica Scandinavica Supplementum. 1974;412:1–48. [PubMed] [Google Scholar]
- Lindvall O, Björklund A, Divac I. Organization of catecholamine neurons projecting to the frontal cortex in the rat. Brain Research. 1978;142(1):1–24. doi: 10.1016/0006-8993(78)90173-7. [DOI] [PubMed] [Google Scholar]
- Loughlin SE, Fallon JH. Substantia nigra and ventral tegmental area projections to cortex: topography and collateralization. Neuroscience. 1984;11(2):425–435. doi: 10.1016/0306-4522(84)90034-4. [DOI] [PubMed] [Google Scholar]
- Lucantonio F, Takahashi YK, Hoffman AF, Chang CY, Bali-Chaudhary S, Shaham Y, … Schoenbaum G. Orbitofrontal activation restores insight lost after cocaine use. Nature Neuroscience. 2014;17(8):1092–1099. doi: 10.1038/nn.3763. http://doi.org/10.1038/nn.3763. [DOI] [PMC free article] [PubMed] [Google Scholar]
- Matsuda W, Furuta T, Nakamura KC, Hioki H, Fujiyama F, Arai R, Kaneko T. Single nigrostriatal dopaminergic neurons form widely spread and highly dense axonal arborizations in the neostriatum. Journal of Neuroscience. 2009;29(2):444–453. doi: 10.1523/JNEUROSCI.4029-08.2009. [DOI] [PMC free article] [PubMed] [Google Scholar]
- Mátyás F, Lee J, Shin HS, Acsády L. The fear circuit of the mouse forebrain: connections between the mediodorsal thalamus, frontal cortices and basolateral amygdala. European Journal of Neuroscience. 2014;39(11):1810–1823. doi: 10.1111/ejn.12610. http://doi.org/10.1016/j.brainres.2003.10.006. [DOI] [PubMed] [Google Scholar]
- Mishkin M. Preservation of central sets after frontal lesions in monkeys. In: Warren JM, Akert K, editors. The Frontal Granular Cortex and Behavior. New York: McGraw Hill; 1964. pp. 219–241. [Google Scholar]
- Mogensen J, Divac I. The prefrontal “cortex” in the pigeon. Brain, Behavior, and Evolution. 1982;21:60–66. doi: 10.1159/000121617. [DOI] [PubMed] [Google Scholar]
- Murray EA, O’Doherty JP, Schoenbaum G. What we know and do not know about the functions of the orbitofrontal cortex after 20 years of cross-species studies. Journal of Neuroscience. 2007;27(31):8166–8169. doi: 10.1523/JNEUROSCI.1556-07.2007. http://doi.org/10.1523/jneurosci.1556-07.2007. [DOI] [PMC free article] [PubMed] [Google Scholar]
- Noack HJ, Lewis DA. Antibodies directed against tyrosine hydroxylase differentially recognize noradrenergic axons in monkey neocortex. Brain Research. 1989;500:313–324. doi: 10.1016/0006-8993(89)90327-2. [DOI] [PubMed] [Google Scholar]
- Ongür D, Price JL. The organization of networks within the orbital and medial prefrontal cortex of rats, monkeys and humans. Cerebral Cortex. 2000;10(3):206–219. doi: 10.1093/cercor/10.3.206. [DOI] [PubMed] [Google Scholar]
- Padoa-Schioppa C, Conen KE. Orbitofrontal cortex: A neural circuit for economic decisions. Neuron. 2017;96:736–754. doi: 10.1016/j.neuron.2017.09.031. [DOI] [PMC free article] [PubMed] [Google Scholar]
- Pape HC, Paré D, Driesang RB. Two types of intrinsic oscillations in neurons of the lateral and basolateral nuclei of the amygdala. Journal of Neurophysiology. 1998;79:205–216. doi: 10.1152/jn.1998.79.1.205. [DOI] [PubMed] [Google Scholar]
- Paxinos G, Watson C. The Rat Brain in Stereotaxic Coordinates. 6. Elsevier; 2007. [DOI] [PubMed] [Google Scholar]
- Petrovich GD, Risold PY, Swanson LW. Organization of projections from the basomedial nucleus of the amygdala: a PHAL study in the rat. Journal of Comparative Neurology. 1996;374(3):387–420. doi: 10.1002/(SICI)1096-9861(19961021)374:3<387::AID-CNE6>3.0.CO;2-Y. [DOI] [PubMed] [Google Scholar]
- Peyron C, Tighe DK, van den Pol AN, de Lecea L, Heller HC, Sutcliffe JG, Kilduff TS. Neurons containing hypocretin (orexin) project to multiple euronal systems. Journal of Neuroscience. 1998;18(23):9996–10015. doi: 10.1523/JNEUROSCI.18-23-09996.1998. [DOI] [PMC free article] [PubMed] [Google Scholar]
- Phillipson OT. The cytoarchitecture of the interfascicular nucleus and ventral tegmental area of Tsai in the rat. Journal of Comparative Neurology. 1979;187(1):85–98. doi: 10.1002/cne.901870106. [DOI] [PubMed] [Google Scholar]
- Preuss T. Do rats have prefrontal cortex? The rose-woolsey-akert program reconsidered. Journal of Cognitive Neuroscience. 1995;7(1):1–24. doi: 10.1162/jocn.1995.7.1.1. [DOI] [PubMed] [Google Scholar]
- Price JL. Connections of the orbitofrontal cortex. In: Zald DH, Rauch SL, editors. The Orbitofrontal Cortex. Oxford, UK: Oxford University Press; 2006. pp. 39–55. [Google Scholar]
- Radley JJ, Williams B, Sawchenko PE. Noradrenergic innervation of the dorsal medial prefrontal cortex modulates hypothalamo-pituitary-adrenal responses to acute emotional stress. Journal of Neuroscience. 2008;28(22):5806–5816. doi: 10.1523/JNEUROSCI.0552-08.2008. http://doi.org/10.1523/jneurosci.0552-08.2008. [DOI] [PMC free article] [PubMed] [Google Scholar]
- Ray JP, Price JL. The organization of the thalamocortical connections of the mediodorsal thalamic nucleus in the rat, related to the ventral forebrain-prefrontal cortex topography. Journal of Comparative Neurology. 1992;323(2):167–197. doi: 10.1002/cne.903230204. http://doi.org/10.1002/cne.903230204. [DOI] [PubMed] [Google Scholar]
- Reep RL, Winans SS. Efferent connections of dorsal and ventral agranular insular cortex in the hamster, Mesocricetus auratus. Neuroscience. 1982;7(11):2609–35. doi: 10.1016/0306-4522(82)90087-2. [DOI] [PubMed] [Google Scholar]
- Reep RL, Corwin JV, King V. Neuronal connections of orbital cortex in rats: topography of cortical and thalamic afferents. Experimental Brain Research. 1996;111(2):215–232. doi: 10.1007/BF00227299. [DOI] [PubMed] [Google Scholar]
- Rich EL, Stoll FM, Rudebeck PH. Linking dynamic patterns of neural activity in orbitofrontal cortex with decision making. Current Opinion in Neurobiology. 2017;49:24–32. doi: 10.1016/j.conb.2017.11.002. [DOI] [PMC free article] [PubMed] [Google Scholar]
- Rose JE, Woolsey CN. Structure and relations of limbic cortex and anterior thalamic nuclei in rabbit and cat. Journal of Comparative Neurology. 1948a;89(3):279–347. doi: 10.1002/cne.900890307. [DOI] [PubMed] [Google Scholar]
- Rose JE, Woolsey CN. The orbitofrontal cortex and its connections with the mediodorsal nucleus in rabbit, sheep and cat. Research Publications - Association for Research in Nervous and Mental Disease. 1948b;27:210–232. [PubMed] [Google Scholar]
- Salvatore MF, Garcia-Espana A, Goldstein M, Deutch AY, Haycock JW. Stoichiometry of tyrosine hydroxylase phosphorylation in the nigrostriatal and mesolimbic systems in vivo: effects of acute haloperidol and related compounds. Journal of Neurochemistry. 2000;75(1):225–232. doi: 10.1046/j.1471-4159.2000.0750225.x. [DOI] [PubMed] [Google Scholar]
- Santana N, Mengod G, Artigas F. Quantitative analysis of the expression of dopamine D1 and D2 receptors in pyramidal and GABAergic neurons of the rat prefrontal cortex. Cerebral Cortex. 2009;19(4):849–860. doi: 10.1093/cercor/bhn134. http://doi.org/10.1093/cercor/bhn134. [DOI] [PubMed] [Google Scholar]
- Sarter M, Markowitsch HJ. Collateral innervation of the medial and lateral prefrontal cortex by amygdaloid, thalamic, and brain-stem neurons. Journal of Comparative Neurology. 1984;224:445–460. doi: 10.1002/cne.902240312. [DOI] [PubMed] [Google Scholar]
- Schoenbaum G, Chang CY, Lucantonio F, Takahashi YK. Thinking outside the box: orbitofrontal cortex, imagination, and how we can treat addiction. Neuropsychopharmacology. 2016;41(13):2966–2976. doi: 10.1038/npp.2016.147. http://doi.org/10.1038/npp.2016.147. [DOI] [PMC free article] [PubMed] [Google Scholar]
- Sesack SR, Deutch AY, Roth RH, Bunney BS. Topographical organization of the efferent projections of the medial prefrontal cortex in the rat: an anterogradetract-tracing study with Phaseolus vulgaris leucoagglutinin. Journal of Comparative Neurology. 1989;290(2):213–42. doi: 10.1002/cne.902900205. [DOI] [PubMed] [Google Scholar]
- Slopsema JS, van der Gugten J, de Bruin JP. Regional concentrations of noradrenaline and dopamine in the frontal cortex of the rat: dopaminergic innervation of the prefrontal subareas and lateralization of prefrontal dopamine. Brain Research. 1982;250(1):197–200. doi: 10.1016/0006-8993(82)90970-2. [DOI] [PubMed] [Google Scholar]
- Sobel E, Corbett D. Axonal branching of ventral tegmental and raphe projections to the frontal cortex in the rat. Neuroscience Letters. 1984;48(2):121–125. doi: 10.1016/0304-3940(84)90006-5. [DOI] [PubMed] [Google Scholar]
- Stenger VA. Technical considerations for BOLD fMRI of the orbitofrontal cortex. In: Zald DH, Rauch SL, editors. The Orbitofrontal Cortex. Oxford, UK: Oxford University Press; 2006. pp. 423–446. [Google Scholar]
- Swanson LW. The projections of the ventral tegmental area and adjacent regions: a combined fluorescent retrograde tracer and immunofluorescence study in the rat. Brain Research Bulletin. 1982;9(1–6):321–353. doi: 10.1016/0361-9230(82)90145-9. [DOI] [PubMed] [Google Scholar]
- Swanson LW, Sanchez-Watts G, Watts AG. Comparison of melanin-concentrating hormone and hypocretin/orexin mRNA expression patterns in a new parceling scheme of the lateral hypothalamic zone. Neuroscience Letters. 2005;387(2):80–84. doi: 10.1016/j.neulet.2005.06.066. http://doi.org/10.1016/j.neulet.2005.06.066. [DOI] [PubMed] [Google Scholar]
- Takagishi M, Chiba T. Efferent projections of the infralimbic (area 25) region of the medial prefrontal cortex in the rat: an anterograde tracer PHA-L study. Brain Research. 1991;66:26–39. doi: 10.1016/0006-8993(91)91677-s. [DOI] [PubMed] [Google Scholar]
- Taylor CS, Gross CG. Twitches versus movements: a story of motor cortex. The Neuroscientist. 2003;9(5):332–42. doi: 10.1177/1073858403257037. [DOI] [PubMed] [Google Scholar]
- Thierry AM, Blanc G, Sobel A, Stinus L, Glowinski J. Dopaminergic terminals in the rat cortex. Science. 1973;182(4111):499–501. doi: 10.1126/science.182.4111.499. [DOI] [PubMed] [Google Scholar]
- Thompson JL, Yang J, Lau B, Liu S, Baimel C, Kerr LE, … Borgland SL. Age-Dependent D1–D2 Receptor Coactivation in the Lateral Orbitofrontal Cortex Potentiates NMDA Receptors and Facilitates Cognitive Flexibility. Cerebral Cortex. 2016;26(12):4524–4539. doi: 10.1093/cercor/bhv222. [DOI] [PubMed] [Google Scholar]
- Thompson JL, Drysdale M, Baimel C, Kaur M, MacGowan T, Pitman KA, Borgland SL. Obesity-induced structural and neuronal plasticity in the lateral orbitofrontal cortex. Neuropsychopharmacology. 2017;42(7):1480–1490. doi: 10.1038/npp.2016.284. http://doi.org/10.1038/npp.2016.284. [DOI] [PMC free article] [PubMed] [Google Scholar]
- van de Werd HJJM, Uylings HBM. The rat orbital and agranular insular prefrontal cortical areas: a cytoarchitectonic and chemoarchitectonic study. Brain Structure and Function. 2008;212(5):387–401. doi: 10.1007/s00429-007-0164-y. http://doi.org/10.1016/B978-012547638-6/50025-0. [DOI] [PubMed] [Google Scholar]
- van de Werd HJJM, Rajkowska G, Evers P, Uylings HBM. Cytoarchitectonic and chemoarchitectonic characterization of the prefrontal cortical areas in the mouse. Brain Structure and Function. 2010;214(4):339–353. doi: 10.1007/s00429-010-0247-z. http://doi.org/10.1007/978-3-642-70573-1. [DOI] [PMC free article] [PubMed] [Google Scholar]
- van Eden CG, Hoorneman EM, Buijs RM, Matthijssen MA, Geffard M, Uylings HB. Immunocytochemical localization of dopamine in the prefrontal cortex of the rat at the light and electron microscopical level. Neuroscience. 1987;22(3):849–862. doi: 10.1016/0306-4522(87)92964-2. [DOI] [PubMed] [Google Scholar]
- Venator DK, Lewis DA, Finlay JM. Effects of partial dopamine loss in the medial prefrontal cortex on local baseline and stress-evoked extracellular dopamine concentrations. Neuroscience. 1999;93(2):497–505. doi: 10.1016/s0306-4522(99)00131-1. [DOI] [PubMed] [Google Scholar]
- Verwer RW, Meijer RJ, Van Uum HF, Witter MP. Collateral projections from the rat hippocampal formation to the lateral and medial prefrontal cortex. Hippocampus. 1997;7(4):397–402. doi: 10.1002/(SICI)1098-1063(1997)7:4<397::AID-HIPO5>3.0.CO;2-G. [DOI] [PubMed] [Google Scholar]
- Wei X, Ma T, Cheng Y, Huang CCY, Wang X, Lu J, Wang J. Dopamine D1 or D2 receptor-expressing neurons in the central nervous system. Addiction Biology. 2017;6:7062. doi: 10.1111/adb.12512. http://doi.org/10.1016/j.neuroscience.2015.06.033. [DOI] [PMC free article] [PubMed] [Google Scholar]
- Williams SM, Goldman-Rakic PS. Widespread origin of the primate mesofrontal dopamine system. Cerebral Cortex. 1998;8:321–45. doi: 10.1093/cercor/8.4.321. [DOI] [PubMed] [Google Scholar]
- Winkowski DE, Nagode DA, Donaldson KJ, Yin P, Shamma SA, Fritz JB, Kanold PO. Orbitofrontal cortex neurons respond to sound and activate primary auditory cortex neurons. Cerebral Cortex. 2018;28(3):868–879. doi: 10.1093/cercor/bhw409. [DOI] [PMC free article] [PubMed] [Google Scholar]
- Xu ZQ, Lew JY, Harada K, Åman K, Goldstein M, Deutch AY, et al. Immunohistochemical studies on phosphorylation of tyrosine hydroxylase in central catecholamine neurons using site- and phosphorylation state-specific antibodies. Neuroscience. 1997;82(3):727–738. doi: 10.1016/s0306-4522(97)00189-9. [DOI] [PubMed] [Google Scholar]
- Yang Y, Wang JZ. From structure to behavior in basolateral amygdala-hippocampus circuits. Frontiers in Neural Circuits. 2017;11:86. doi: 10.3389/fncir.2017.00086. eCollection 2017. [DOI] [PMC free article] [PubMed] [Google Scholar]
- Yoshida M, Shirouzu M, Tanaka M, Semba K, Fibiger HC. Dopaminergic neurons in the nucleus raphe dorsalis innervate the prefrontal cortex in the rat: a combined retrograde tracing and immunohistochemical study using anti-dopamine serum. Brain Research. 1989;496(1–2):373–376. doi: 10.1016/0006-8993(89)91091-3. [DOI] [PubMed] [Google Scholar]
- Zald DH, Rauch SL, editors. The Orbitofrontal Cortex. Oxford, UK: Oxford University Press; 2006. [Google Scholar]


