Abstract
Sedimentation velocity analytical ultracentrifugation (SV-AUC) coupled with direct computational fitting of the observed concentration profiles (sedimentating boundary) have been developed and widely used for the characterization of macromolecules and nanoparticles in solution. In particular, size distribution analysis by SV-AUC has become a reliable and essential approach for the characterization of biopharmaceuticals including therapeutic antibodies. In this review, we describe the importance and advantages of SV-AUC for studying biopharmaceuticals, with an emphasis on strategies for sample preparation, data acquisition, and data analysis. Recent discoveries enabled by AUC with a fluorescence detection system and potential future applications are also discussed.
Keywords: Analytical ultracentrifugation, Sedimentation velocity, Biopharmaceuticals, Protein, Aggregates, Immunogenicity
Introduction
A dramatic increase in the number of therapeutic antibodies approved for human use has been observed over the recent decade, which has been enabled by their high efficacy with generally low level of adverse effects. As a result, today, therapeutic antibodies represent the most common class of biopharmaceutical drug products. Despite apparent clinical benefits, antibody aggregates generated during production, purification, filling into vials or syringes and the shipping and storage of antibody solutions have become a major issue to be solved, because protein aggregates have been recently recognized as a significant risk to the patient, as they potentially can elicit immune responses in vivo. Rosenberg suggested that aggregates of recombinant therapeutic proteins may induce immunogenicity (Rosenberg 2006). Therefore, the presence of aggregated antibodies needs to be properly monitored and the amount should be minimized, which is now required from regulatory agencies and is recognized as an important subject in pharmaceutical companies (Ishii-Watabe et at. 2017). This is of particular importance when considering the formulation of highly concentrated antibody solutions (greater than 50 mg/mL) in a small volume (less than 1 mL), conditions which can further promote aggregation, but are relatively common for therapeutic proteins formulated in prefillable syringes, an increasingly popular format for delivering biopharmaceuticals (Krayukhina et al. 2015).
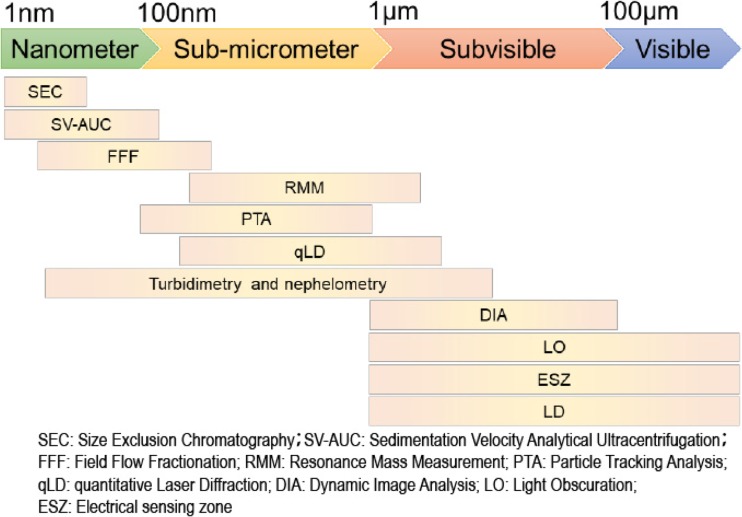
Antibody aggregates range from tens of nanometers to hundreds of micrometers and are classified into four categories based on their size (Narhi et al. 2012): nanoparticles, particles with diameters less than 100 nm; submicron particles, particles with diameters between 100 nm and 1 μm; subvisible particles, particles with diameters between 1 μm and 100 μm; and visible particles, particles with diameters larger than 100 μm. Unfortunately, no instrument can cover the whole size range. An additional challenge is posed by the fact that no protein aggregate standards of a known particle size and concentration are available, and therefore the evaluation of protein aggregates using orthogonal methods based on different detection principles, which provide distributions of aggregates in a specific size range with absolute concentrations, is highly recommended (den Engelsman et al. 2011). In the past decade, substantial progress has been made in the development of orthogonal methods suited to this task. Methods that are currently used for the characterization of protein aggregates in different size ranges are summarized in Fig. 1. From the early twenty-first century, sedimentation velocity analytical ultracentrifugation (SV-AUC) has begun to be well recognized and adopted by the pharmaceutical industry to quantitatively characterize antibody aggregates (Lebowitz et al. 2002; Berkowitz 2006; Liu et al. 2006; Arakawa et al. 2007; Gabrielson et al. 2007; Pekar and Sukumar 2007; Philo 2009; Gabrielson and Arthur 2011; Berkowitz and Philo 2015), in particular, soluble antibody aggregates with diameters less than 100 nm (now referred to as nanometer particles) (Narhi et al. 2012).
Fig. 1.
Current analytical methods used for the characterization of protein aggregates with different size ranges
Another critical aspect of antibody therapeutics is the relationship between the sizes of the antigen–antibody complex, or immune complex (IC), and its role in the immune system, such as inducing secretion of inflammatory cytokines from immune cells. It has been described that some diseases, such as serum sickness, were caused by the presence of ICs of certain sizes (Abbas et al. 2017). For the case where, due to oligomerization, an antigen has multiple antibody-binding sites, cross-linking of antibody molecules mediated by antigen–antibody interactions could occur, leading to the formation of large ICs. These ICs could induce a FcγR-mediated signaling pathway in immune cells, which may further activate the immune system. A number of commercially available therapeutic antibodies are directed against oligomer-forming antigens. Among them are adalimumab and infliximab, monoclonal antibodies to tumor necrosis factor (TNF), which is capable of forming trimer, and, therefore, as a prerequisite, the sizes of the respective ICs require proper evaluation. Even though IC size distribution may be solely determined by the dissociation constant existing between antigen and antibody, and also the valency of the epitope, for therapeutic antibodies, the size distributions of IC remain to be investigated. However, an important analytical milestone was the recent measurement of size distributions of ICs for the three TNF-antagonists at a clinically relevant concentration of a therapeutic antibody (i.e. close to that in blood serum), as revealed by AUC with a fluorescence detection system (AUC-FDS) (Krayukhina et al. 2017). The elucidated size distributions may help identify a role of ICs in immunogenicity of therapeutic antibody in patients.
Limitations of size exclusion chromatography (SEC)
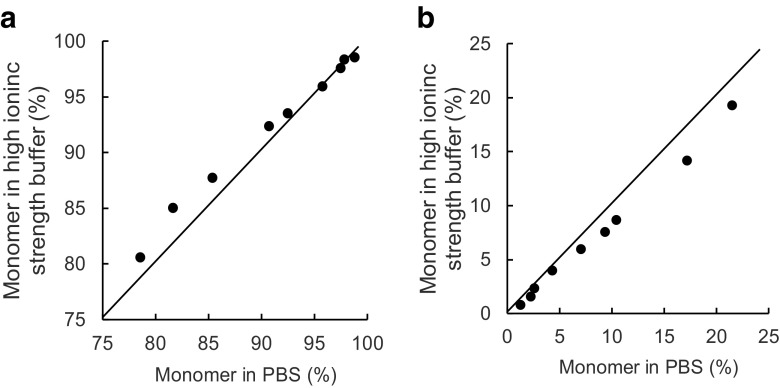
Assessment of aggregates in pharmaceutical formulation has been typically performed by size exclusion chromatography (SEC). However, it was demonstrated that even small soluble antibody aggregates cannot completely pass through the SEC column and thus remain uneluted, primarily due to protein–column matrix interactions, which leads to underestimation of the aggregate content in antibody solutions (Carpenter et al. 2010; Krayukhina et al. 2013). As shown in Fig. 2, this issue is often encountered not only for higher oligomers, such as hexamer and decamer, but also for small aggregates, such as dimer and trimer, when heat-, stir-, and/or agitation-stressed samples are analyzed, partly owing to the high adhesive property of the aggregates. In contrast to SEC, AUC is a column-free first-principle technique, in which aggregates separation is achieved through the equilibrium established between centrifugal, frictional, and buoyancy forces, and the measured size distributions of sedimentation coefficients most accurately reflect those in the original formulations. It is sometimes seen that estimates of aggregation content resulting from SEC are different from those obtained by SV-AUC (Fig. 2). Another concern related to the application of SEC for quantification of aggregates in pharmaceuticals samples is the discrepancy between the initial formulation and the composition of the mobile phase in SEC. By increasing concentration of salt in the eluent, improved resolution of peaks can be achieved, but it can also trigger aggregation or induce dissociation of reversible aggregates during SEC measurement (Philo 2006; Arakawa et al. 2010). Comparison between amounts of monomer and aggregates in intravenous immunoglobulin (IVIG) products detected by SV-AUC using two different buffers used in SEC analyses indicates a trend toward larger monomer content under high ionic strength SEC buffer conditions compared with lower ionic strength phosphate-buffered saline (PBS) (Fig. 3). Nevertheless, SEC can offer significant advantages in application to aggregate quantification, which include the speed, sensitivity (limit of quantification of 0.1% aggregates compared with 0.6–1.0% in the case of SV-AUC), and high reproducibility. These features make SEC a highly appealing approach for routine use and large-throughput applications. Thus, even though SEC remains a primary method for aggregate analysis, it is strongly recommended that AUC should be applied to verify SEC quantitative estimates (den Engelsman et al. 2011; Carpenter et al. 2016).
Fig. 2.
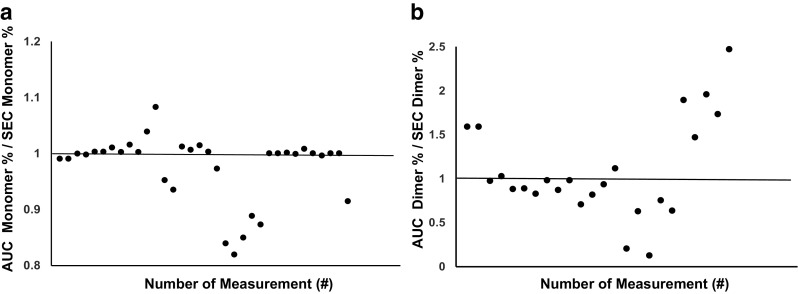
Comparison between SEC and SV-AUC quantitative estimates for monomer and dimer amounts. Dotted line indicates equivalent estimate of monomer (a) or dimer (b) percentages
Fig. 3.
Comparison between amounts of monomer and aggregates in intravenous immunoglobulin (IVIG) products detected by SV-AUC using two different buffers (high ionic strength buffer and physiological ionic strength buffer); monomer (a) and dimer (b)
Approaches for aggregate quantification by SV-AUC
Much progress has been made over the last decade in developing a method to characterize therapeutic antibody aggregates by SV-AUC. Several critical factors that influence quantitative results have been identified which can be classified into three major categories: sample, measurement, or data analysis-related. Some important aspects of assessment of aggregates in therapeutic antibodies in liquid formulation has been described previously (Cordes et al. 2016).
Potential compositional differences between the initial formulation, which can contain salt at a high concertation and/or excipients to achieve long-term stability and a solvent desirable for reliable quantification, can be attributed to the main sample-specific factor. Thus, in AUC experiments performed using reference solutions containing low salt concentration, such as 10 mM sodium chloride which is common for antibody drugs, non-ideal sedimentation behavior due to electrostatic repulsion between molecules can lead to inaccurate quantification. Sugars and polyols, frequently added to enhance conformational stability, co-sediment together with the antibody in the centrifugal field of about 130,000g (estimation for radial position of 6.5 cm at 42,000 rpm), forming time-dependent density and viscosity gradient.
Antibody molecules can exhibit inter-molecular interactions at concentrations higher than 1 mg/mL. Nevertheless, the c(s) analysis—the most commonly used approach for the SV-AUC data analysis—is based on the superposition of non-interacting Lamm equation solutions (Schuck 2000), and, to yield the most accurate results, factors that account for deviation from ideal conditions should be considered. For the above reasons, the initial assessment of aggregates using SV-AUC should be performed under ideal sedimentation conditions, which comprise 0.6–0.9 mg/mL antibody solutions with 50–150 mM of added NaCl and a pH buffered by a component identical to that used in the preparation of the solution for the measurement. The typical concentrations of therapeutic antibodies in liquid formulations are at least 5–10 mg/mL and in pre-filled syringes they exceed 50 mg/mL (Uchiyama 2014). At a concentration of 10 mg/mL, the average center-to-center intermolecular distance of antibody molecules is approximately 29 nm, which is equivalent to a 12-nm edge-to-edge distance assuming 17 nm for the antibody molecular size, whereas, at a concertation of 51 mg/mL antibody molecules come into close contact with a near-zero edge-to-edge distance (Fig. 4). These solutions therefore exhibit quite crowded conditions and require dilution prior to the SV-AUC measurement. However, in certain cases, direct measurements at a formulation concentration may be desirable for minimizing potential changes upon dilution. SV-AUC of the undiluted drug product can provide useful information for understanding the complex behavior of antibody molecules in high concentration solutions, but it creates substantial challenges in experimental design and data analysis, as discussed further below.
Fig. 4.
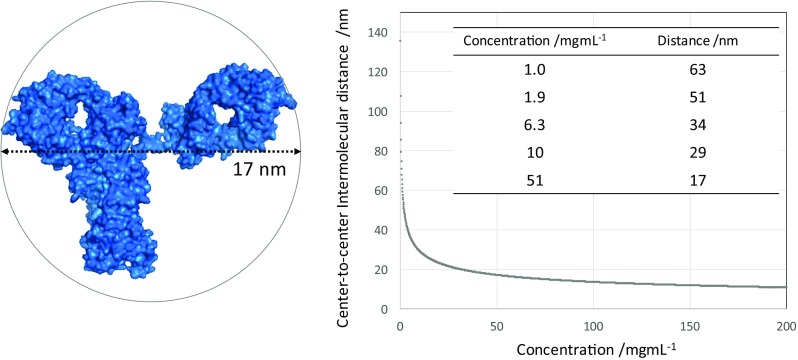
Molecular size and intermolecular distance for an antibody solution. Left van der Waals surface and molecular size of an antibody (PDB: 1HZH). Right The concentration dependence of the average intermolecular center-to-center distance between antibody molecules
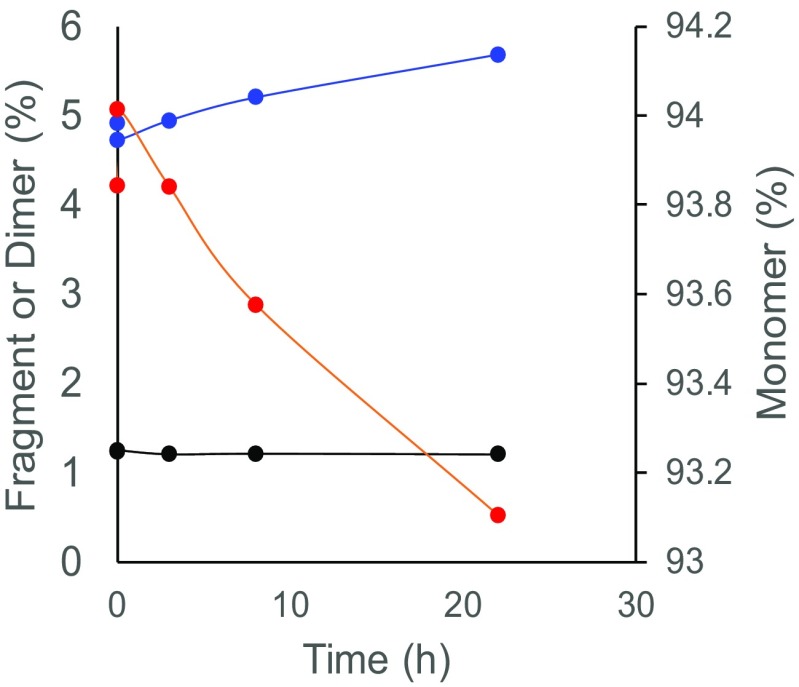
The ideal sedimentation conditions can be achieved through dilution using an appropriate solvent, which minimizes the effect of sugars on the sedimentation of the antibody while providing appropriate buffer and salt concentrations. It should be noted that dilution often promotes dissociation of aggregates into smaller species, depending on both the time and the dilution rate (Fig. 5). When SV-AUC is performed for the purpose of estimation of aggregates in the initial formulation, measurements should be initiated immediately after dilution (the so-called “dilute and shoot approach”), whereas incubation for prolonged periods of time might be required to estimate values at an equilibrium.
Fig. 5.
The dependence of dimer-monomer dissociation on equilibration time. The percentages of monomer (blue), dimer (red), and fragment (black) are shown
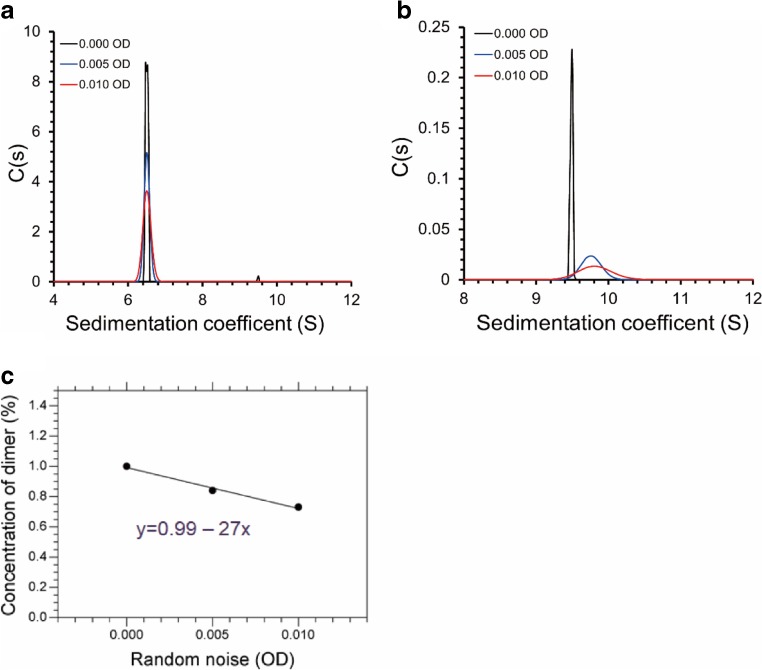
In this section, we will discuss measurement-related critical factors, which influence quantitative estimation of antibody properties. For the most accurate results, the performance of the AUC instruments, usually Optima XL-A or Optima XL-I (Beckman-Coulter), should be periodically checked to ensure highest possible noise-to-signal ratio. Thus, to accurately quantify trace amounts of aggregates using absorbance optics, root-mean-square deviation (rmsd) of the noise should be below 0.01 for a signal of 1.0 absorbance units, which is achieved by ensuring that the 230-nm peak in the emission spectrum of xenon flash lamp has high intensity (at least 10,000 counts) (Krayukhina and Uchiyama 2016). Moreover, as variations in noise level affect the accuracy of the measurement (Fig. 6; Table 1), the noise level should be minimized and the highest possible characteristic intensity of the lamp should be maintained throughout its operational life.
Fig. 6.
C(s) analysis results of the SV-AUC data simulated for a monomer–dimer system using different levels of added noise. Size distribution for the whole range of sedimentation coefficients (a) and the enlarged view of the dimer peak (b) are shown. c Estimated dimer concentration plotted as a function of random noise level
Table 1.
c(s) analysis result of simulated SV-AUC data containing 1% dimer with different noise levels
| Random noise, OD | Dimer concentration (%) | rmsd |
|---|---|---|
| 0.000 | 1.00 | 0.000066 |
| 0.005 | 0.84 | 0.004963 |
| 0.010 | 0.73 | 0.009914 |
AUC cell assembly components, including centerpiece, windows, and cell housing, also have an ability to influence SV-AUC quantitative results (Arthur et al. 2009; Gabrielson et al. 2010; Gabrielson and Arthur 2011). Scratches present on the window surfaces give rise to spikes in the SV data, which can be somewhat corrected for by enabling time-invariant noise decomposition during c(s) data analysis (Arthur et al. 2009). Nevertheless, for the most accurate quantification, careful handling to avoid scratches is recommended. Low quality of centerpieces, and scratches on the channel surfaces, can cause convection during the run. Similar to the effects of convection caused by inadequate temperature equilibration prior to the start of the experiment, analysis of such data can result in a higher rmsd value, and ultimately contribute to large variability of replicate measurements. Figire 7 demonstrates that estimates derived from experiments using low-quality centerpieces deviate from those obtained using high-quality centerpieces. Another factor influencing AUC measurements variability is an internal misalignment of centerpiece channels relative to the axis of rotation or overall misalignment of cell assemblies upon placement in the rotor (Arthur et al. 2009; Gabrielson et al. 2010). These issues have been addressed by implementing new manufacturing practices for higher-quality centerpieces (Gabrielson et al. 2010) and development of a mechanical alignment tool (Arthur et al. 2009), a commercially available analog of which is available from Spin Analytical and is now routinely employed for high-precision aggregates measurement. Recently, a new custom-made optical tool allowing additional improvement of cell alignment has been described (Doyle et al. 2017).
Fig. 7.
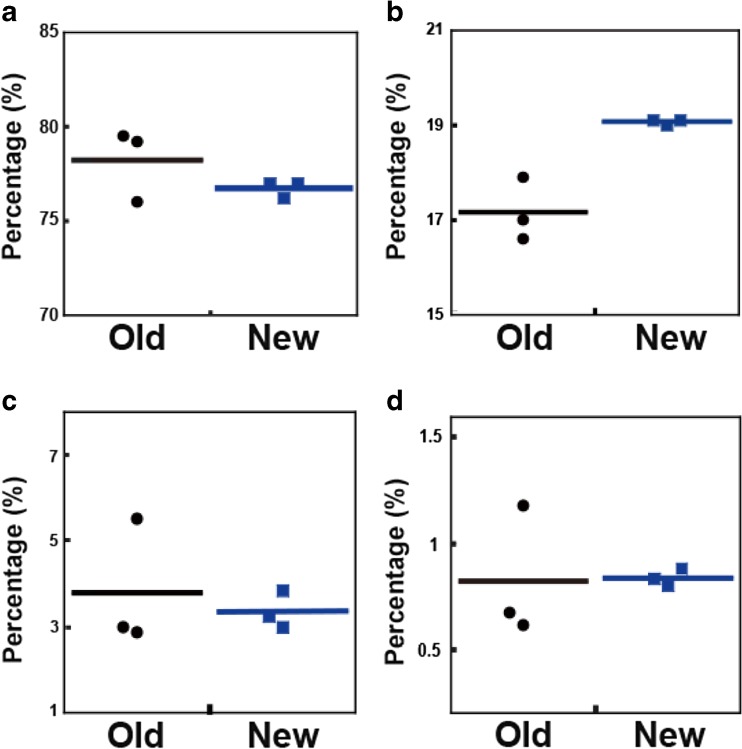
C(s) analysis results for the sample measured using higher- and lower-quality centerpieces. Percentages of monomer (a), dimer (b), trimer (c) and higher oligomers (d) are indicated
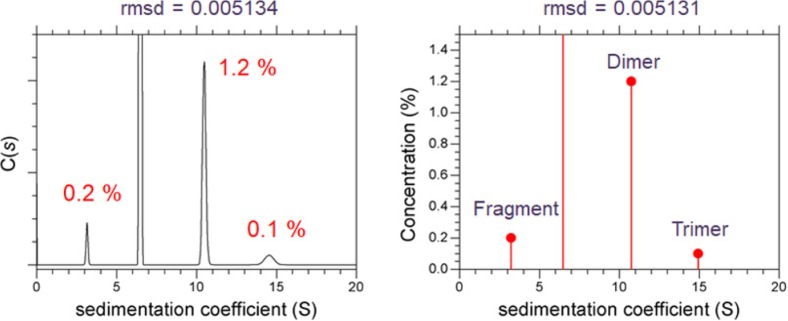
Generally, in relation to aggregates quantification, AUC data are analyzed using the sedimentation coefficient distribution c(s) model implemented in the SEDFIT program. Using simulation data, the limit of quantification (LOQ) for antibody dimer by SV-AUC was determined to be 0.6% (Gabrielson et al. 2007), whereas 3.7% aggregation was reported based on the approach described in ICH Q2 using c(s) distributions for three different proteins (Gabrielson and Arthur 2011). Overall, as the LOQ depends on the amount of data acquired and the desired degree of precision, it is suggested that, for SV-AUC, the LOQ should be considered as dynamic, rather than a static characteristic (Gabrielson and Arthur 2011). As a practical approach for c(s) distributions, which reveal the presence of up to four non-interacting discrete species, the significance of minor peaks can be evaluated using an F-statistics calculator, implemented in SEDFIT (Wafer et al. 2016). Figure 8 and Table 2 show the result of c(s) analysis of an IVIG solution. Among three minor peaks (fragment, dimer, and trimer), dimer was found to be statistically significant, whereas fragment and trimer were statistically insignificant.
Fig. 8.
The significance of minor peaks in the c(s) distribution as evaluated using F-statistics calculator of SEDFIT. Left resulting c(s) distribution; right same data analyzed using non-interacting discrete species model of SEDFIT
Table 2.
Evaluation of the significance of minor peaks in the c(s) distribution, which revealed the presence of fragment, monomer, dimer, and trimer. The critical rmsd value (0.005142) was estimated using F-statistics calculator of SEDFIT
| Components included | rmsd | Conclusion |
|---|---|---|
| Fragment, monomer, dimer | 0.005132 (< critical rmsd) | Trimer peak is statistically insignificant |
| Monomer, dimer | 0.005139 (< critical rmsd) | Fragment peak is statistically insignificant |
| Monomer | 0.005495 (> critical rmsd) | Dimer peak is statistically significant |
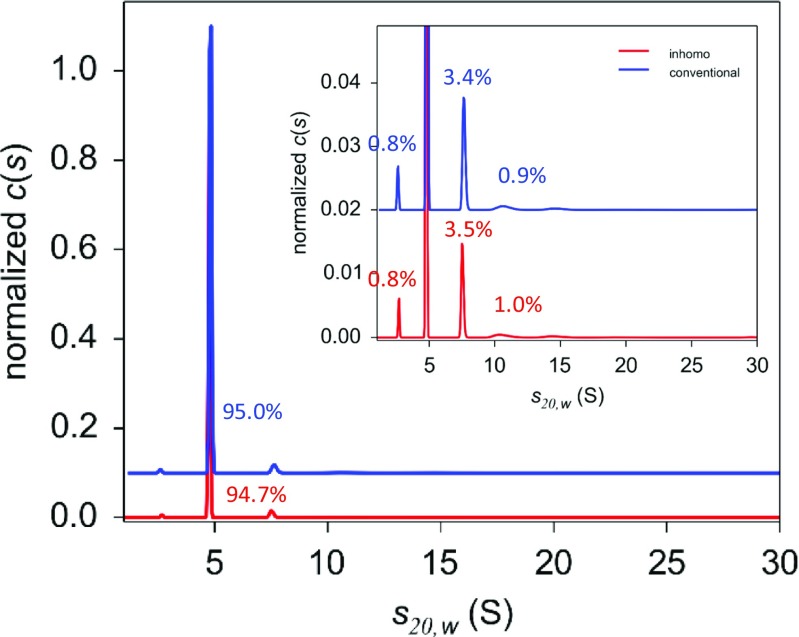
Numerous antibody drug solutions contain 5–10% of sugars and polyols, such as sucrose, mannitol, and sorbitol, in order to isotonically balance to physiological osmotic pressure and/or enhance the antibody conformational stability. In high centrifugal fields applied in the AUC experiment, these excipients co-sediment with protein molecules, generating inhomogeneities in terms of the density and viscosity of the supporting solvent environment. These inhomogeneities can affect sedimentation behavior and can lead to erroneous quantification of aggregates. When appropriately accounted for by employing c(s) analysis with the inhomogeneous solvent option selected, this effect can be mitigated and accurate estimations can be derived (Gabrielson et al. 2009). Figure 9 shows the results of conventional c(s) and c(s) with inhomogeneous option analyses for human serum albumin formulation containing 5% sorbitol. As can be seen, the amount of aggregation is underestimated in cases of conventional c(s).
Fig. 9.
Comparison of the results of conventional c(s) and c(s) with inhomogeneous option analyses applied for human serum albumin formulation containing 5% sorbitol. The result of conventional c(s) analysis (blue) and that for c(s) with inhomogeneous option analysis (red) are indicated
AUC-FDS
Implementation of the fluorescence detection system in AUC has significantly extended the dynamic range, enabling analysis of high-affinity protein–protein interactions with picomolar equilibrium dissociation constants (K D) values and highly concentrated solutions (MacGregor et al. 2004; Kingsbury and Laue 2011; Zhao et al. 2013b; Zhao et al. 2014b; Chaturvedi et al. 2017a). The applications of AUC-FDS are summarized in Table 3. In addition, AUC-FDS offers unique means for studying macromolecules in complex biological environments, such as blood serum (Demeule et al. 2009; Kingsbury et al. 2012; Hill and Laue 2015; Krayukhina et al. 2017) or cell lysates (Kroe and Laue 2009).
Table 3.
Applications of FDS-AUC
| Experiment type | Applicable tasks |
|---|---|
| Sedimentation velocity | • Determination of the protein oligomeric state, detection of aggregates at picomolar concentation and at millimolar protein concentrations by adding small amounts of fluorescently labeled protein to solution of non-labeled protein. • Characterization of high-affinity self- and hetero-associations: determination of sub-nanomolar equilibrium dissociation constants values • Characterization of multi-protein complexes formation using labeled subunits • Characterization of macromolecules in complex biological environments, such as blood serum and cell lysates |
A number of differences in the experimental setup and technical aspects exist between AUC-FDS and conventional detection using absorbance or interference detection. In AUC-FDS, a reference solution is not required, allowing for simultaneous measurement of up to 14 samples. Despite this advantage, additional sample processing is required. The component of interest needs to be labeled using an appropriate fluorescent probe. The most common AUC-FDS system utilizes excitation at 488 nm and emission at 505–565 nm, while a few alternative systems are capable of operating in the 375–980 nm range (Desai et al. 2016; Chaturvedi et al. 2017a). If AUC-FDS is used to study protein–protein or ligand–protein interactions, it has to be verified that attachment of the fluorescent dye does not affect the binding abilities. At low loading concentrations, to suppress non-specific adsorption to the centerpiece walls and window surfaces, carrier protein at lower concentrations should be added to sample solutions. The obtained data can exhibit FDS-specific features such as small temporal signal drift due to fluorescent dye photo-bleaching or time-dependent fluctuations in laser power (Zhao et al. 2013a).
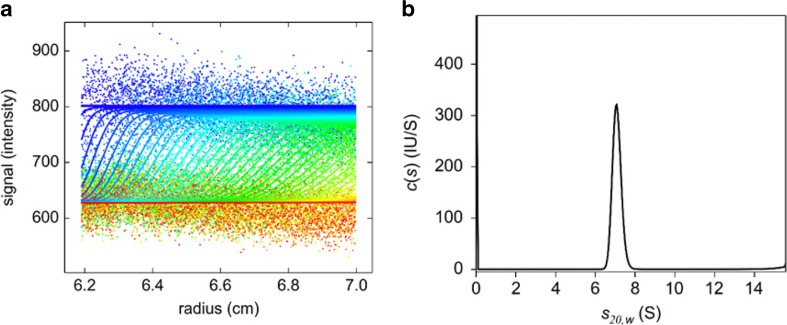
The above difficulties can be easily overcome by careful design and performance of the experiments and associated data analysis, leading to truly exceptional results (Zhao et al. 2014a; Chaturvedi et al. 2017a). It has been shown previously that, due to the large number of data points acquired during a typical SV experiment, meaningful results can be derived even when boundary amplitudes are comparable with the stochastic noise of the data acquisition (Zhao et al. 2012). Thus, the c(s) analysis of the data obtained for 500-pM Alexa-Fluor 488-labeled adalimumab, which do not show any discernible sedimentation boundaries and exhibit considerably low signal-to-noise ratio, leads to a well-defined sedimentation coefficient distribution with the major peak being consistent with a monomeric adalimumab form (Fig. 10), as has been demonstrated at nanomolar and micromolar concentrations (Krayukhina et al. 2017). The loading signal at 500-pM adalimumab is approximately 174.5 counts, whereas the rmsd are 31.1 counts.
Fig. 10.
AUC-FDS analysis with 500 pM Alexa-Fluor 488-labeled adalimumab. (a) Raw data and (b) respective c(s) distribution
The K D of binding between an enhanced green fluorescent protein and its monoclonal IgG antibody of 20 pM was determined using FDS (Zhao et al. 2014b), highlighting the potential application for protein–protein interactions at low concentrations in the pM–nM ranges. Moreover, high hydrodynamic resolution of AUC coupled with high-selectivity fluorescent detection can yield more reliable results compared with traditional methods for measuring high-affinity interactions, such as surface plasmon resonance and isothermal titration calorimetry (Chaturvedi et al. 2017a). A recently reported approach using photoswitchable fluorescent proteins demonstrated characterization of heterogeneous multi-protein complexes at previously unthinkably low concentration ranges (Zhao et al. 2016; Chaturvedi et al. 2017b). In addition, to address growing concerns from regulatory agencies regarding potential immunogenicity of therapeutic proteins, AUC-FDS can be conveniently employed to evaluate antibody–antigen interactions in close to in vivo conditions (Krayukhina et al. 2017).
Challenges of AUC application for characterization of highly concentrated solutions
Difficulties of both conducting measurements and data analysis arise when attempting to perform SV-AUC of high-concentration antibody solutions. During data acquisition of such solutions, large refractive index gradients generated at the sedimentating boundary result in the phenomenon called “Wiener skewing” (Gonzalez et al. 2003), where light entering a cell is refracted away from the path of entry, thereby producing a somewhat sharp peak at the concentration gradient. This peak cannot be completely removed from the data, and, therefore a reliable data analysis cannot be accomplished. Wiener skewing can be mitigated by employing a 3-mm centerpiece, with a path length equal to one-quarter of a standard 12-mm centerpiece, allowing for characterization of an antibody solution at concentrations as high as 24 mg/mL (Nishi et al. 2010). Nevertheless, even when SV-AUC data can be successfully acquired for a highly concentrated antibody solution, data analysis by applying the conventional Lamm equation usually provides poor fitting results with a high rmsd value due to large deviations from thermodynamic ideality. Considerable efforts have been made to account for the effects of non-ideality. Thus, in the program SEDANAL, hydrodynamic non-ideality coefficients have been incorporated to describe the concentration-dependence of apparent sedimentation and diffusion coefficients (Stafford 2016). By using SEDANAL, the hydrodynamic non-ideality coefficients were successfully determined for a 40-mg/mL solution of BSA and a 20-mg/mL solution of γ-globulin (Correia et al. 2016).
To study a weak self-association of antibodies in highly concentrated solutions, an alternative to SV mode of AUC analysis, sedimentation equilibrium AUC (SE-AUC), can be applied. Using SE-AUC, self-interactions of antibodies at a concentration of 100 mg/mL (Liu et al. 2005) and up to 125 mg/mL (Jimenez et al. 2007) have been described. In the latter study, the approximate models for fitting the measured equilibrium concentration gradient were employed, where nonspecific repulsive protein–protein interactions were approximated as a function of antibody concertation.
Composition gradient static light scattering (CG-SLS) is another approach to investigate self- and hetero-associations of proteins at high concentration (Attri and Minton 2005). By using CG-SLS, the second virial coefficient of the IgG–IgG interaction was determined over the range of concentrations up to >150 mg/mL (Kress et al. 2016), allowing assessment of the extent of intermolecular interactions and thus being a useful tool for the rational formulation development (Saito and Uchiyama 2016).
Conclusions
SV-AUC is an orthogonal to the SEC method for quantification of small protein aggregates. By employing a SV-AUC approach based on well-documented experimental operation and data analysis procedures, while taking into consideration the important aspects described here, we can estimate the amount of aggregated protein present in the formulation with high reliability and reproducibility. Although characterization of highly concentrated antibody solutions still poses major challenges, the behavior of a therapeutic protein at low concentrations in the picomolar to nanomolar range can be adequately assessed by employing AUC-FDS, which is also emerging as an unprecedented tool for protein–protein interaction studies in complex biological environments.
Acknowledgements
This work was partly supported by the MEXT/JSPS Grants in Aid for Scientific Research (15 K14457, 17H03975) and by grant-in-aid from the Research on Development of New Drugs of AMED.
Compliance with ethical standards
Conflict of interest
Susumu Uchiyama declares that he has no conflicts of interest. Masanori Noda declares that he has no conflicts of interest. Elena Krayukhina declares that she has no conflicts of interest.
Ethical approval
This article does not contain any studies with human participants or animals performed by any of the authors.
Footnotes
This article is part of a Special Issue on ‘Biomolecules to Bio-nanomachines - Fumio Arisaka 70th Birthday’ edited by Damien Hall, Junichi Takagi and Haruki Nakamura.
References
- Abbas A, Lichtman AH, Pillai S (2017) Hypersensitivity disorders. In: Cellular and molecular immunology, 9th edn. Elsevier, pp 417–437
- Arakawa T, Philo JS, Ejima D, Tsumoto K, Arisaka F. Aggregation analysis of therapeutic proteins, part 2. Analytical ultracentrifugation and dynamic light scattering. Bioproc Int. 2007;5:36–47. [Google Scholar]
- Arakawa T, Ejima D, Li T, Philo JS. The critical role of mobile phase composition in size exclusion chromatography of protein pharmaceuticals. J Pharm Sci. 2010;99:1674–1692. doi: 10.1002/jps.21974. [DOI] [PubMed] [Google Scholar]
- Arthur KK, Gabrielson JP, Kendrick BS, Stoner MR. Detection of protein aggregates by sedimentation velocity analytical ultracentrifugation (SV-AUC): sources of variability and their relative importance. J Pharm Sci. 2009;98:3522–3539. doi: 10.1002/jps.21654. [DOI] [PubMed] [Google Scholar]
- Attri AK, Minton AP. Composition gradient static light scattering: a new technique for rapid detection and quantitative characterization of reversible macromolecular hetero-associations in solution. Anal Biochem. 2005;346:132–138. doi: 10.1016/j.ab.2005.08.013. [DOI] [PubMed] [Google Scholar]
- Berkowitz SA. Role of analytical ultracentrifugation in assessing the aggregation of protein biopharmaceuticals. AAPS J. 2006;8:E590–E605. doi: 10.1208/aapsj080368. [DOI] [PMC free article] [PubMed] [Google Scholar]
- Berkowitz SA, Philo JS (2015) Characterizing biopharmaceuticals using analytical ultracentrifugation. In: Houde DJ, Berkowitz SA (eds). Biophysical characterization of proteins in developing biopharmaceuticals. Elsevier, Amsterdam, pp 211-260. doi:10.1016/b978-0-444-59573-7.00009-9
- Carpenter JF, Randolph TW, Jiskoot W, Crommelin DJ, Middaugh CR, Winter G. Potential inaccurate quantitation and sizing of protein aggregates by size exclusion chromatography: essential need to use orthogonal methods to assure the quality of therapeutic protein products. J Pharm Sci. 2010;99:2200–2208. doi: 10.1002/jps.21989. [DOI] [PubMed] [Google Scholar]
- Carpenter JF, Bain DL, Johnson GR. Use of analytical ultracentrifugation as an orthogonal method for size exclusion chromatography: assuring quality for therapeutic protein products and meeting regulatory expectations. In: Uchiyama S, Arisaka F, Stafford W, Laue T, editors. Analytical ultracentrifugation. Tokyo: Springer; 2016. pp. 389–395. [Google Scholar]
- Chaturvedi SK, Ma J, Zhao H, Schuck P. Use of fluorescence-detected sedimentation velocity to study high-affinity protein interactions. Nat Protoc. 2017;12:1777–1791. doi: 10.1038/nprot.2017.064. [DOI] [PMC free article] [PubMed] [Google Scholar]
- Chaturvedi SK, Zhao H, Schuck P. Sedimentation of reversibly interacting macromolecules with changes in fluorescence quantum yield. Biophys J. 2017;112:1374–1382. doi: 10.1016/j.bpj.2017.02.020. [DOI] [PMC free article] [PubMed] [Google Scholar]
- Cordes AA, Arthur KK, Gabrielson JP. Biopharmaceuticals: application of AUC-SV for quantitative analysis of protein size distributions. In: Uchiyama S, Arisaka F, Stafford W, Laue T, editors. Analytical ultracentrifugation. Tokyo: Springer; 2016. pp. 397–418. [Google Scholar]
- Correia JJ, Lyons DF, Sherwood P, Stafford W. Techniques for dissecting the Johnston-Ogston effect. In: Uchiyama S, Arisaka F, Stafford W, Laue T, editors. Analytical ultracentrifugation. Tokyo: Springer; 2016. pp. 483–498. [Google Scholar]
- Demeule B, Shire SJ, Liu J. A therapeutic antibody and its antigen form different complexes in serum than in phosphate-buffered saline: a study by analytical ultracentrifugation. Anal Biochem. 2009;388:279–287. doi: 10.1016/j.ab.2009.03.012. [DOI] [PubMed] [Google Scholar]
- den Engelsman J, Garidel P, Smulders R, Koll H, Smith B, Bassarab S, Seidl A, Hainzl O, Jiskoot W. Strategies for the assessment of protein aggregates in pharmaceutical biotech product development. Pharm Res. 2011;28:920–933. doi: 10.1007/s11095-010-0297-1. [DOI] [PMC free article] [PubMed] [Google Scholar]
- Desai A, Krynitsky J, Pohida TJ, Zhao H, Schuck P. 3D-printing for analytical ultracentrifugation. PLoS ONE. 2016;11:e0155201. doi: 10.1371/journal.pone.0155201. [DOI] [PMC free article] [PubMed] [Google Scholar]
- Doyle BL, Budyak IL, Rauk AP, Weiss WF. An optical alignment system improves precision of soluble aggregate quantitation by sedimentation velocity analytical ultracentrifugation. Anal Biochem. 2017;531:16–19. doi: 10.1016/j.ab.2017.05.018. [DOI] [PubMed] [Google Scholar]
- Gabrielson JP, Arthur KK. Measuring low levels of protein aggregation by sedimentation velocity. Methods. 2011;54:83–91. doi: 10.1016/j.ymeth.2010.12.030. [DOI] [PubMed] [Google Scholar]
- Gabrielson JP, Randolph TW, Kendrick BS, Stoner MR. Sedimentation velocity analytical ultracentrifugation and SEDFIT/c(s): limits of quantitation for a monoclonal antibody system. Anal Biochem. 2007;361:24–30. doi: 10.1016/j.ab.2006.11.012. [DOI] [PubMed] [Google Scholar]
- Gabrielson JP, Arthur KK, Kendrick BS, Randolph TW, Stoner MR. Common excipients impair detection of protein aggregates during sedimentation velocity analytical ultracentrifugation. J Pharm Sci. 2009;98:50–62. doi: 10.1002/jps.21403. [DOI] [PubMed] [Google Scholar]
- Gabrielson JP, Arthur KK, Stoner MR, Winn BC, Kendrick BS, Razinkov V, Svitel J, Jiang Y, Voelker PJ, Fernandes CA, Ridgeway R. Precision of protein aggregation measurements by sedimentation velocity analytical ultracentrifugation in biopharmaceutical applications. Anal Biochem. 2010;396:231–241. doi: 10.1016/j.ab.2009.09.036. [DOI] [PubMed] [Google Scholar]
- Gonzalez JM, Rivas G, Minton AP. Effect of large refractive index gradients on the performance of absorption optics in the Beckman XL-A/I analytical ultracentrifuge: an experimental study. Anal Biochem. 2003;313:133–136. doi: 10.1016/S0003-2697(02)00434-7. [DOI] [PubMed] [Google Scholar]
- Hill JJ, Laue TM. Protein assembly in serum and the differences from assembly in buffer. Methods Enzymol. 2015;562:501–527. doi: 10.1016/bs.mie.2015.06.012. [DOI] [PubMed] [Google Scholar]
- Ishii-Watabe A, Shibata H, Harazono A, Hyuga M, Kiyoshi , Saitoh S, Iwura T, Torisu T, Goda Y, Uchiyama S (2017) Recent topics of research in the characterization and quality control of biopharmaceuticals in Japan. J Pharmaceut Sci 106:3431–3437 [DOI] [PubMed]
- Jimenez M, Rivas G, Minton AP. Quantitative characterization of weak self-association in concentrated solutions of immunoglobulin G via the measurement of sedimentation equilibrium and osmotic pressure. Biochemistry. 2007;46:8373–8378. doi: 10.1021/bi7005515. [DOI] [PubMed] [Google Scholar]
- Kingsbury JS, Laue TM. Fluorescence-detected sedimentation in dilute and highly concentrated solutions. Methods Enzymol. 2011;492:283–304. doi: 10.1016/B978-0-12-381268-1.00021-5. [DOI] [PubMed] [Google Scholar]
- Kingsbury JS, Laue TM, Chase SF, Connors LH. Detection of high-molecular-weight amyloid serum protein complexes using biological on-line tracer sedimentation. Anal Biochem. 2012;425:151–156. doi: 10.1016/j.ab.2012.03.016. [DOI] [PMC free article] [PubMed] [Google Scholar]
- Krayukhina E, Uchiyama S. Analytical ultracentrifugation. In: Senda T, Maenaka K, editors. Advanced methods in structural biology. Tokyo: Springer; 2016. pp. 165–183. [Google Scholar]
- Krayukhina E, Uchiyama S, Nojima K, Okada Y, Hamaguchi I, Fukui K. Aggregation analysis of pharmaceutical human immunoglobulin preparations using size-exclusion chromatography and analytical ultracentrifugation sedimentation velocity. J Biosci Bioeng. 2013;115:104–110. doi: 10.1016/j.jbiosc.2012.07.021. [DOI] [PubMed] [Google Scholar]
- Krayukhina E, Tsumoto K, Uchiyama S, Fukui K. Effects of syringe material and silicone oil lubrication on the stability of pharmaceutical proteins. J Pharm Sci. 2015;104:527–535. doi: 10.1002/jps.24184. [DOI] [PMC free article] [PubMed] [Google Scholar]
- Krayukhina E, Noda M, Ishii K, Maruno T, Wakabayashi H, Tada M, Suzuki T, Ishii-Watabe A, Kato M, Uchiyama S. Analytical ultracentrifugation with fluorescence detection system reveals differences in complex formation between recombinant human TNF and different biological TNF antagonists in various environments. MAbs. 2017;9:664–679. doi: 10.1080/19420862.2017.1297909. [DOI] [PMC free article] [PubMed] [Google Scholar]
- Kress C, Sadowski G, Brandenbusch C. Novel displacement agents for aqueous 2-phase extraction can be estimated based on hybrid shortcut calculations. J Pharm Sci. 2016;105:3030–3038. doi: 10.1016/j.xphs.2016.06.006. [DOI] [PubMed] [Google Scholar]
- Kroe RR, Laue TM. NUTS and BOLTS: applications of fluorescence-detected sedimentation. Anal Biochem. 2009;390:1–13. doi: 10.1016/j.ab.2008.11.033. [DOI] [PMC free article] [PubMed] [Google Scholar]
- Lebowitz J, Lewis MS, Schuck P. Modern analytical ultracentrifugation in protein science: a tutorial review. Protein Sci. 2002;11:2067–2079. doi: 10.1110/ps.0207702. [DOI] [PMC free article] [PubMed] [Google Scholar]
- Liu J, Nguyen MD, Andya JD, Shire SJ. Reversible self-association increases the viscosity of a concentrated monoclonal antibody in aqueous solution. J Pharm Sci. 2005;94:1928–1940. doi: 10.1002/jps.20347. [DOI] [PubMed] [Google Scholar]
- Liu J, Andya JD, Shire SJ. A critical review of analytical ultracentrifugation and field flow fractionation methods for measuring protein aggregation. AAPS J. 2006;8:E580–E589. doi: 10.1208/aapsj080367. [DOI] [PMC free article] [PubMed] [Google Scholar]
- MacGregor IK, Anderson AL, Laue TM. Fluorescence detection for the XLI analytical ultracentrifuge. Biophys Chem. 2004;108:165–185. doi: 10.1016/j.bpc.2003.10.018. [DOI] [PubMed] [Google Scholar]
- Narhi LO, Schmit J, Bechtold-Peters K, Sharma D. Classification of protein aggregates. J Pharm Sci. 2012;101:493–498. doi: 10.1002/jps.22790. [DOI] [PubMed] [Google Scholar]
- Nishi H, Miyajima M, Nakagami H, Noda M, Uchiyama S, Fukui K. Phase separation of an IgG1 antibody solution under a low ionic strength condition. Pharm Res. 2010;27:1348–1360. doi: 10.1007/s11095-010-0125-7. [DOI] [PubMed] [Google Scholar]
- Pekar A, Sukumar M. Quantitation of aggregates in therapeutic proteins using sedimentation velocity analytical ultracentrifugation: practical considerations that affect precision and accuracy. Anal Biochem. 2007;367:225–237. doi: 10.1016/j.ab.2007.04.035. [DOI] [PubMed] [Google Scholar]
- Philo JS. Is any measurement method optimal for all aggregate sizes and types? AAPS J. 2006;8:E564–E571. doi: 10.1208/aapsj080365. [DOI] [PMC free article] [PubMed] [Google Scholar]
- Philo JS. A critical review of methods for size characterization of non-particulate protein aggregates. Curr Pharm Biotechnol. 2009;10:359–372. doi: 10.2174/138920109788488815. [DOI] [PubMed] [Google Scholar]
- Rosenberg AS. Effects of protein aggregates: an immunologic perspective. AAPS J. 2006;8:E501–E507. doi: 10.1208/aapsj080359. [DOI] [PMC free article] [PubMed] [Google Scholar]
- Saito S, Uchiyama S. Biopharmaceutical evaluation of intermolecular interactions by AUC-SE. In: Uchiyama S, Arisaka F, Stafford W, Laue T, editors. Analytical Ultracentrifugation. Tokyo: Springer; 2016. pp. 419–440. [Google Scholar]
- Schuck P. Size-distribution analysis of macromolecules by sedimentation velocity ultracentrifugation and Lamm equation modeling. Biophys J. 2000;78:1606–1619. doi: 10.1016/S0006-3495(00)76713-0. [DOI] [PMC free article] [PubMed] [Google Scholar]
- Stafford W. Analysis of nonideal, interacting, and noninteracting systems by sedimentation velocity analytical ultracentrifugation. In: Uchiyama S, Arisaka F, Stafford W, Laue T, editors. Analytical ultracentrifugation. Tokyo: Springer; 2016. pp. 463–482. [Google Scholar]
- Uchiyama S. Liquid formulation for antibody drugs. Biochim Biophys Acta. 2014;1844:2041–2052. doi: 10.1016/j.bbapap.2014.07.016. [DOI] [PubMed] [Google Scholar]
- Wafer L, Kloczewiak M, Luo Y. Quantifying trace amounts of aggregates in biopharmaceuticals using analytical ultracentrifugation sedimentation velocity: Bayesian analyses and F statistics. AAPS J. 2016;18:849–860. doi: 10.1208/s12248-016-9925-y. [DOI] [PubMed] [Google Scholar]
- Zhao H, Berger AJ, Brown PH, Kumar J, Balbo A, May CA, Casillas E, Jr, Laue TM, Patterson GH, Mayer ML, Schuck P. Analysis of high-affinity assembly for AMPA receptor amino-terminal domains. J Gen Physiol. 2012;139:371–388. doi: 10.1085/jgp.201210770. [DOI] [PMC free article] [PubMed] [Google Scholar]
- Zhao H, Casillas E, Jr, Shroff H, Patterson GH, Schuck P. Tools for the quantitative analysis of sedimentation boundaries detected by fluorescence optical analytical ultracentrifugation. PLoS ONE. 2013;8:e77245. doi: 10.1371/journal.pone.0077245. [DOI] [PMC free article] [PubMed] [Google Scholar]
- Zhao H, Lomash S, Glasser C, Mayer ML, Schuck P. Analysis of high affinity self-association by fluorescence optical sedimentation velocity analytical ultracentrifugation of labeled proteins: opportunities and limitations. PLoS ONE. 2013;8:e83439. doi: 10.1371/journal.pone.0083439. [DOI] [PMC free article] [PubMed] [Google Scholar]
- Zhao H, Ma J, Ingaramo M, Andrade E, MacDonald J, Ramsay G, Piszczek G, Patterson GH, Schuck P. Accounting for photophysical processes and specific signal intensity changes in fluorescence-detected sedimentation velocity. Anal Chem. 2014;86:9286–9292. doi: 10.1021/ac502478a. [DOI] [PMC free article] [PubMed] [Google Scholar]
- Zhao H, Mayer ML, Schuck P. Analysis of protein interactions with picomolar binding affinity by fluorescence-detected sedimentation velocity. Anal Chem. 2014;86:3181–3187. doi: 10.1021/ac500093m. [DOI] [PMC free article] [PubMed] [Google Scholar]
- Zhao H, Fu Y, Glasser C, Andrade Alba EJ, Mayer ML, Patterson G, Schuck P (2016) Monochromatic multicomponent fluorescence sedimentation velocity for the study of high-affinity protein interactions. Elife 5. doi:10.7554/eLife.17812 [DOI] [PMC free article] [PubMed]


