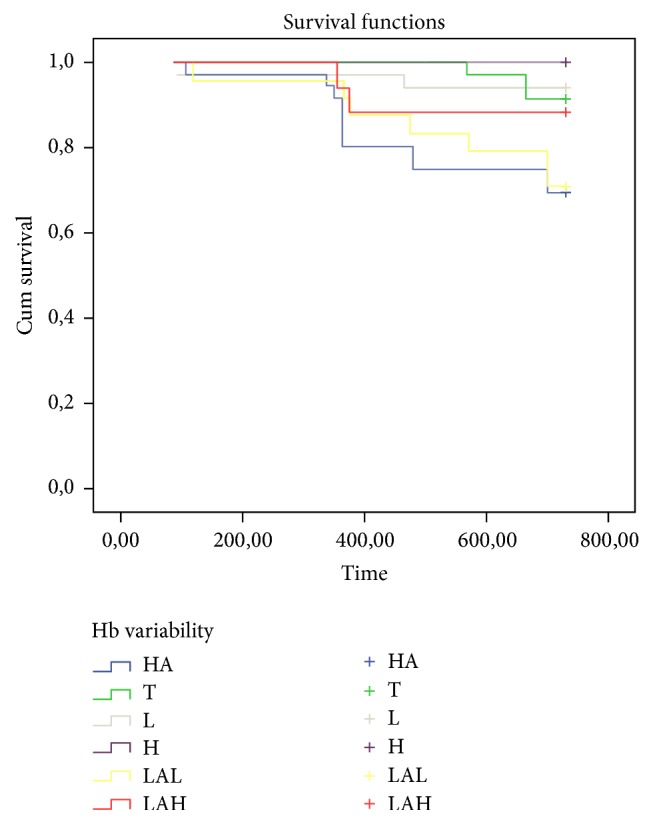
Figure 1.

Kaplan–Meier analysis showing significant difference associated with mortality in each of the hemoglobin variability groups. Consistently high (H), consistently low (L), consistently within the target range (T) groups showed survival advantage compared with low-amplitude fluctuation with high hemoglobin levels (LAH), low-amplitude fluctuation with low hemoglobin levels (LAL), and high-amplitude fluctuation (HA) groups (100%, 94.1%, 91.4%, 88%, 70.8%, and 69.4%, resp.; p < 0.009).
