

Abstract
Stereotaxy is based on the precise image-guided spatial localization of targets within the human brain. Even with the recent advances in MRI technology, histological examination renders different (and complementary) information of the nervous tissue. Although several maps have been selected as a basis for correlating imaging results with the anatomical locations of sub-cortical structures, technical limitations interfere in a point-to-point correlation between imaging and anatomy due to the lack of precise correction for post-mortem tissue deformations caused by tissue fixation and processing. We present an alternative method to parcellate human brain cytoarchitectural regions, minimizing deformations caused by post-mortem and tissue-processing artifacts and enhancing segmentation by means of modified high thickness histological techniques and registration with MRI of the same specimen and into MNI space (ICBM152). A three-dimensional (3D) histological atlas of the human thalamus, basal ganglia, and basal forebrain cholinergic system is displayed. Structure’s segmentations were performed in high-resolution dark-field and light-field microscopy. Bidimensional non-linear registration of the histological slices was followed by 3D registration with in situ MRI of the same subject. Manual and automated registration procedures were adopted and compared. To evaluate the quality of the registration procedures, Dice similarity coefficient and normalized weighted spectral distance were calculated and the results indicate good overlap between registered volumes and a small shape difference between them in both manual and automated registration methods. High thickness high-resolution histological slices in combination with registration to in situ MRI of the same subject provide an effective alternative method to study nuclear boundaries in the human brain, enhancing segmentation and demanding less resources and time for tissue processing than traditional methods.
Keywords: Cytoarchitecture, Thalamus, Sub-cortical atlas, Magnetic resonance imaging
Introduction
Stereotactic procedures rely on the precise spatial localization of targets within the human brain. At the dawn of stereotaxy, the use of ventriculography (Dandy 1918) was the gold standard method for brain localization, especially when combined with brain atlases. Spiegel and Wycis published the first atlas of the human brain (Spiegel et al. 1952), based on histological sections of post-mortem specimens. After their seminal publication, numerous human brain atlases were created (Talairach 1957; Schaltenbrand and Bailey 1959; Andrew and Watkins 1969; Van Buren and Borke 1972; Emmers and Tasker 1975; Schaltenbrand et al. 1977; Afshar et al. 1978; Yoshida 1987; Talairach and Tournoux 1988; Ono et al. 1990; Morel et al. 1997; Nowinski and Belov 2003; Nowinski et al. 2005; Chakravarty et al. 2006; Morel 2007; Yelnik et al. 2007; Mai et al. 2008; Zaborszky et al. 2008; Krauth et al. 2010; Amunts et al. 2013). Stereotaxy is also an important research tool, and several developments in brain mapping and structure targeting were achieved in animal models. Therefore, several histological brain atlases were generated from rodents (König and Klippel 1963; Paxinos and Watson 1986; Kroon and Riley 1986; Toga et al. 1989; Schwarz et al. 2006; Franklin and Paxinos 2008; Kumazawa-Manita et al. 2013) and non-human primates (Shanta et al. 1968; François et al. 1996; Martin and Bowden 1996; Ilinsky et al. 2002; Saleem and Logothetis 2012; Lanciego and Vázquez 2012). Atlases based on histological and immunohistochemical methods provide outstanding resolution; however, tissue shrinkage and mechanical deformation during cutting, staining, and cover-slipping inherently complicate a direct point-to-point correlation between imaging and anatomy.
Currently, magnetic resonance imaging (MRI) spatial resolution, detector sensitivity, and better image contrast led to the ability to study brain structures at histological and even cellular scale. Ultrahigh field MRI using 14 T is already possible, but these developments still do not apply to in vivo scanning, due to ideal conditions of NMR microscopy experiments (Duyn 2012). Typical in vivo spatial resolution up to 0.5 × 0.5 × 0.5 mm3 in 7 T machines can be achieved. However, even with the recent advances in MR technology, histological examination renders different (and complementary) information of the nervous tissue. As an example, the subthalamic area is depicted in T2-weighted MRI as a low signal region due to high iron concentration spread in this nuclei (Drayer et al. 1986), and does not necessarily match the cytoarchitectural boundaries of the subthalamic nucleus (STN) (Hallgren and Sourander 1958; Aoki et al. 1989; Reese et al. 2012).
Combining in situ brain imaging with high-resolution histology in 3D space is challenging. Digitalization of serial histological sections through the human brain is associated with tissue distortion and the generation of a huge amount of data, which requires big computational power to handle, possible in high-end neuroimaging centers.
In this paper, we present a 3D sub-cortical histological atlas, normalized to MNI standard space (ICBM152) using relatively thick histological sections combined with manual and automated histology-to-MRI registration procedures. This approach yields highly precise histological boundaries segmented from dark- and light-field microscopy to be transferred and compared to in vivo data sets, being useful both in research and clinical analyses. Cortical parcellations are to be included in a next paper, by applying an automated computational segmentation model currently in development in our group.
Materials and methods
Post-mortem MRI
Three post-mortem human brains were used in the present study: Case 1, a 56-year-old man, Case 2, a 66-year-old woman, and Case 3, a 56-year-old man. Case 3, due to its intrinsic outstanding contrast in dark-field illumination, was used to confirm cytoarchitectural and myeloarchitectural criteria adopted, and not for 3D reconstructions. Myeloarchitecture was obtained solely by analyzing dark-field illumination images and not by additional myelin stains. Details on the causes of death and post-mortem times are summarized in Table 1. The brains were scanned post-mortem in cranio at the Institute of Radiology and submitted to a conventional MR scan protocol, as described in Table 1.
Table 1.
Case history and MRI sequences
| Cases | Age (years) | Gender | Cause of death | Previous neurological diseases | 3.0 T MRI scan | PMIa | Fixation | Plane of section | No. of studied sections | Thickness of the sections (μm) |
|---|---|---|---|---|---|---|---|---|---|---|
| Case 1 | 56 | Man | Myocardial infarct | None | Yes, in cranio | 15h30′ | Formalin 20%, immersion, 4 months | Frontal | 101 | 400 |
| Case 2 | 66 | Woman | Blunt traumab | None | Yes, in cranio | 13h05′ | Formalin 20% immersion, 4 months | Axial | 279 | 430 |
| Case 3 | 56 | Man | Myocardial infarct | None | Yes, in cranio | 14h40′ | Formalin 20% immersion, 4 months | Frontal | 285 | 560 |
MRI sequences: T1: TR = 6.3 ms, TE = 2.9 ms, TI = 791 ms, 240 9 × 240, 1 9 × 1 9 × 1 mm voxels 3D; Axial FLAIR: TR = 8613 ms, TI = 2800 ms, TE = 130 ms, 0.65 mm 9 × 0.87 mm, 1 NEX 3 mm/0.3 mm, FOV 230 mm 9 × 183 mm, 2D, DTI: b = 3000, TE = 65 ms, TR 23.650 ms, FOV 256 mm 9 × 256 mm, resolution 2.0 mm 9 × 2.0 mm 9 × 2.0 mm, NEX 2, gradient 32 directions, SENSE = 2 (AP), Flip angle = 90
PMI post-mortem interval (time between death and autopsy)
Without brain injuries
Diffusion tensor imaging (DTI) was also included in MRI protocol, using the parameters, as shown in Table 1. While head motion, cardiac pulsation, and breathing artifacts are not a problem in post-mortem DTI, a short post-mortem interval (in our case approximately 14 h) is required for optimal imaging, as the natural autolytic phenomena occurring after death can possibly cause disturbance in the diffusivity of water after long post-mortem intervals (Haakma et al. 2016). DTI pre-processing, including eddy current distortion correction, EPI distortion corrections, and linear registration to anatomic sequences, were achieved in FSL (Jenkinson et al. 2012) and exported to Amira (v. 5.4.1, Visage Imaging GmbH, Germany) software for fiber tracking.
Histological processing
After formalin fixation (20%), the brains were dehydrated in graded series of ethanol. The rostral parts anterior to the anterior horn and dorsal parts of the frontal lobe of Case 1 were removed. Cases 2 and 3 were processed as full brains without removal of the arachnoidea. The brains were then soaked in an 8% solution of celloidin and subjected to celloidin-embedding by means of a vacuum-assisted procedure. The celloidin was hardened by chloroform vapors and finally by immersion in 70% alcohol. The celloidin blocks with the brains were serially cut on a sliding microtome (Polycut, Cambridge Instruments, UK) at a section thickness of 400, 430, and 560 lm, respectively, for Cases 1, 2, and 3. During the serial sectioning, every section was photographed with a digital single-lens reflex camera (blockface images). Details of the procedure and its scope are given elsewhere (Teipel et al. 2008, 2011; Grinberg et al. 2008, 2009; Ewers et al. 2011). The serial celloidin sections where stained using a modified gallocyanin (Nissl) technique (Heinsen and Heinsen 1991).
Registration procedures and image similarity metrics
To restore the spatial 2D arrangement of the gallocyanin-stained sections, registration procedures were applied for Cases 1 and 2. Case 1 was subject to manual 2D (histology to blockface) and 3D (histological block to T1 MRI) registration (Figs. 1, 2 and 3; Online Resource 1), while Case 2 was submitted to a computational registration pipeline developed in our group (Alegro et al. 2016), including blockface and histology background segmentation, followed by symmetrical 2D affine registration based on robust statistics (Reuter et al. 2010), and 2D non-linear ANTS SyN registration (Avants et al. 2008). Finally, 3D registration was performed using also SyN algorithm. The pipeline routines and evaluation metrics were implemented in Matlab (R2015a, Mathworks, USA) and 3D visualization in Amira. Normalization of Case 2 MRI into MNI space (ICBM152) (Fonov et al. 2011) was also achieved with ANTS. All transformations were stored and subsequently applied to masks segmented in the high-resolution histological slices.
Fig. 1.
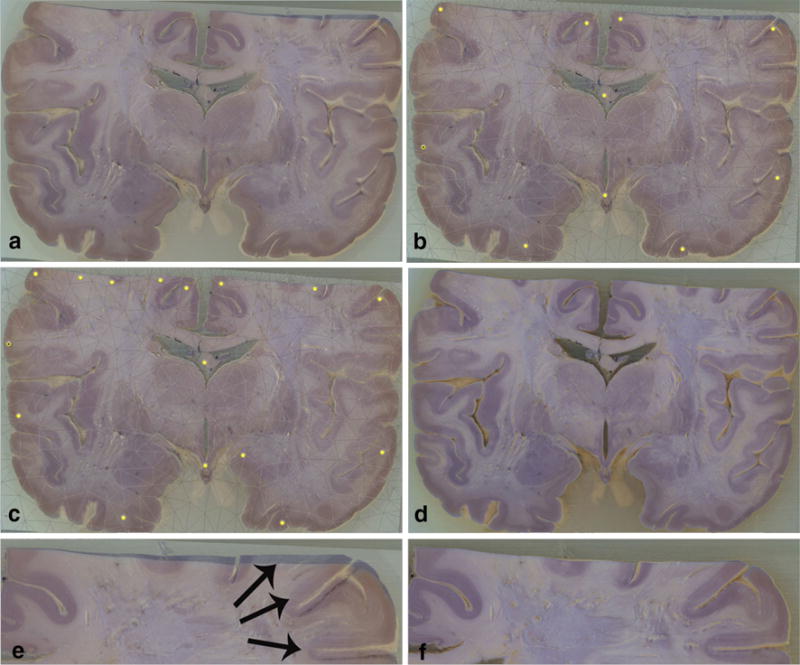
Manual histology-to-blockface 2D registration: a Gallocyanin-stained section roughly aligned to the unstained block; b Deformable mesh and anchor points projected onto the primary image surface; c Non-linear correction of the deformations; d Final alignment; e Detail of the misalignment of the stained slice due to tissue processing; f The same region seen in e after the non-linear correction
Fig. 2.
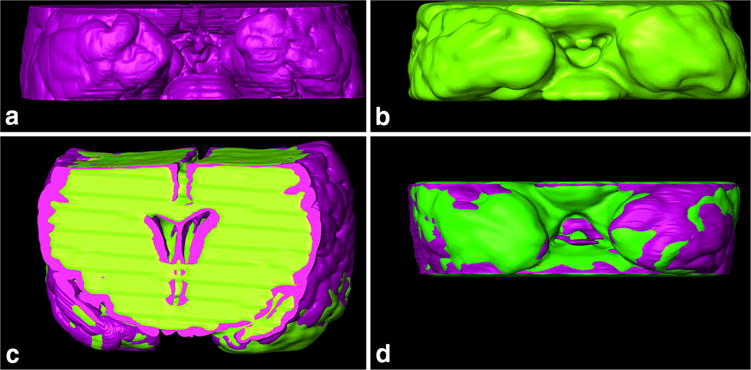
Histology-to-MRI manual 3D registration of Case 1. a Basal central block surface segmented from histological slices (purple); b basal central block surface segmented from T1 MRI images (green); c frontal view of 3D registered histology and MRI, and d basal view of 3D registered histology and MRI. These outlines were used to calculate DSC and nWSD 3D values
Fig. 3.
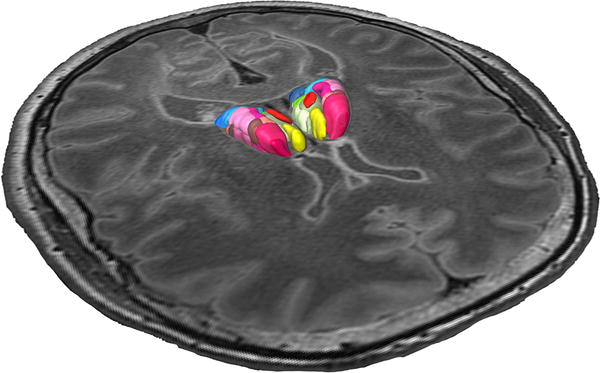
Registered thalamic nuclei segmented from the histological sections embedded in the 3.0 T MRI of the same brain
To evaluate the quality of the registration procedures, Dice similarity coefficient (DSC) (Dice 1945) and normalized weighted spectral distance (nWSD) (Konukoglu et al. 2012, 2013) were computed. DSC is a non-parametric statistical metric widely used in segmentation studies. Since it only measures overlap disregarding shape, we also applied the nWSD as complementary metric, since it accounts for shape similarity between two structures. DSC range is 0–1 when 0 means no overlap and 1 means maximum overlap. The nWSD also is in the 0–1 interval. Zero reflects no shape difference, and 1 reflects complete disagreement of shapes.
DSC and nWSD were computed for 2D segmented masks of the cerebral surface in blockface and gallocyanin-stained sections and for the 3D histological and MRI surfaces (Fig. 2). The evaluation of registration quality of the automated pipeline, including Case 2, was described in a previous work (Alegro et al. 2016).
Segmentation of nuclei and computer-assisted 3D reconstruction
The stained gallocyanin sections were analyzed using a stereo microscope, a conventional binocular microscope, and a digital camera. This optical instrumentation allowed low and high power optical magnification necessary for the delineation of the cytoarchitectural fields and sub-regions studied. Bright- and dark-field illumination pictures of the same slice were registered to enhance contrast and segmentation (Figs. 4, 7). In our case, the delineation was guided by Hassler’s parcellation (Hassler et al. 1982) for the thalamus, Mesulam’s nomenclature (Mesulam et al. 1983) for the basal forebrain cholinergic system (BFCS), and the Schaltenbrand atlas for the basal ganglia (Schaltenbrand et al. 1977). Color coding for the BFCS followed a previous paper from our group (Grinberg and Heinsen 2007). The nuclear outlines were traced in serial sections using a cursor and a graphic tablet and they were segmented by a neurosurgeon (first author) and carefully revised by an experienced neuroanatomist (last author) in Adobe Photoshop CS5 Extended, v12.0, Adobe, USA. In this environment, binary masks with nuclear contours were created. The transformation matrices generated by the computational pipeline were applied to the masks and imported to Amira, where three-dimensional reconstructions were performed and displayed (Figs. 5, 6, 8, 9; Online Resource 2). Tractography was also performed in Amira, using the streamline tracking and tensor deflection algorithms, with the following parameters: FA seed threshold 0.2; FA step threshold 0.17; step size 1.67; and length 152.941 mm.
Fig. 4.
Coronal Nissl-stained 560 lm section (Case 3) at the level of the thalamus and subthalamic nuclei (STN) a High power magnification view of the reticular nucleus and b lateral group. c 3.0 T MRI of the same specimen, d Dark-field illumination of the same slice, showing contrast enhancement and myeloarchitecture as criterium for segmentation
Fig. 7.
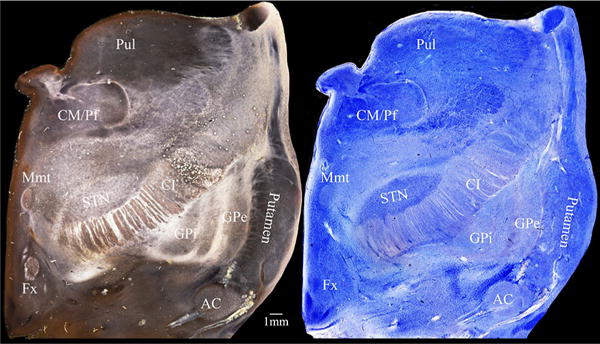
Dark-field microscopy (left) and light-field microscopy (right) of the same slice. Note that identical structures have distinct characteristics with different illumination. This feature helps delineating basal ganglia borders and nuclear groups. Pul thalamic pulvinar, CM/Pf centro median–parafascicular thalamic complex, Mmt mamilo-thalamic tract, Fx fornix, STN subthalamic nucleus, CI internal capsule, AC anterior commissure, GPi internal globus pallidus, GPe external globus pallidus
Fig. 5.
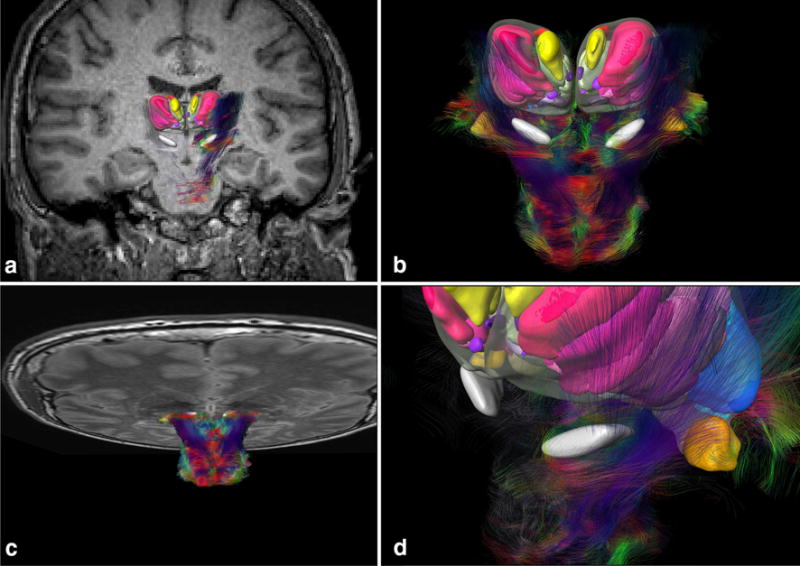
Registered MRI and DTI with cytoarchitectonic fields and subthalamic region. a Coronal MRI fused to histology. b Fiber tracking of brainstem fused to 3D histology of STN and thalamus. c Horizontal MRI fused to DTI and histology. d Detail of the subthalamic region and fibers surrounding the histology-defined STN
Fig. 6.
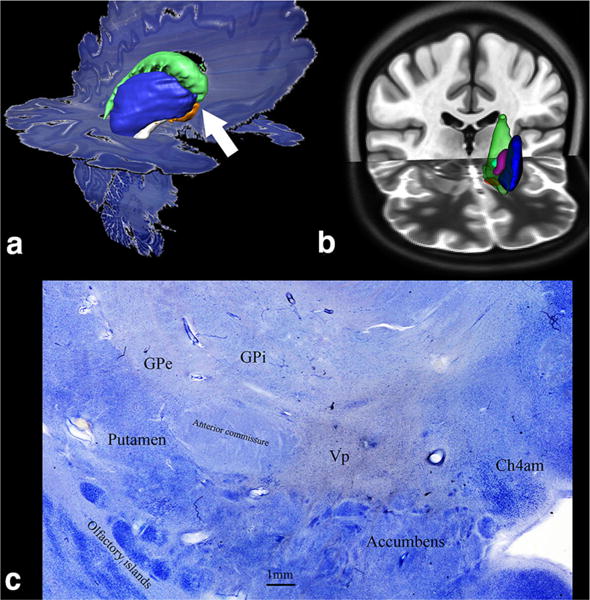
Basal ganglia 3D structures segmented from darkfield microscopy displayed in native 3D histological space (a) and in ICBM152 MNI standard space (b) in T1 (coronal) and T2 (axial) weighted images (c) microscopic view of basal ganglia structures at the level of the white arrow in a
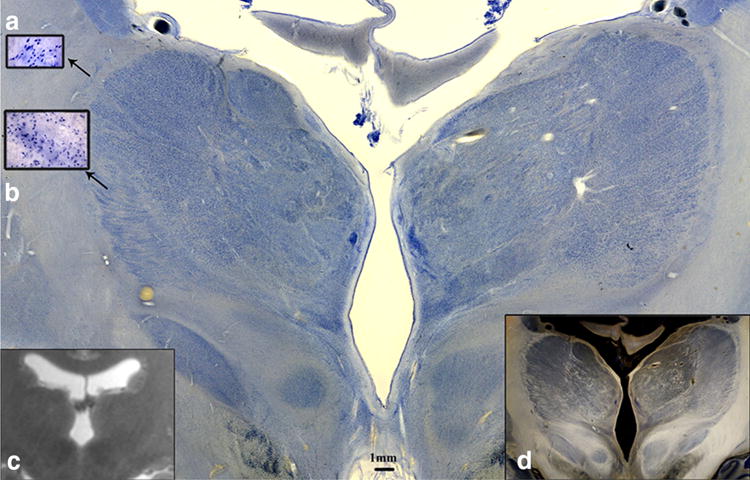
Fig. 8.
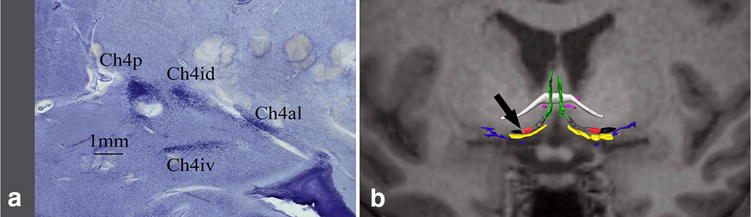
a Microscopic view of basal forebrain components in a coronal slice at the level of the black arrow in b; b basal forebrain cholinergic system (BFCS) histological map fused to T1 MRI of the same subject. White: anterior commissure; green: CH2; yellow: CH3; gray: CH4am; red: CH4i, black: CH4p; blue: Ayala’s nucleus; pink: nucleus juxta commissuralis. Color coding follows Grinberg and Heinsen (2007), Mesulam’s nomenclature is adapted from Mesulam et al. (1983)
Fig. 9.
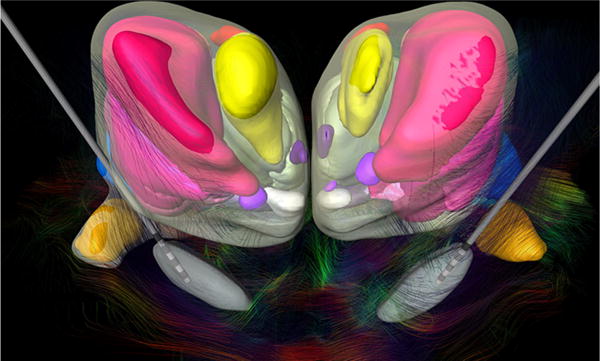
Frontal view of the thalamic and subthalamic nuclei fused to the DTI showing the fiber tracts of the subthalamic region. This cytoarchitectonic map was registered to pre-operative CT scan and MRI of a 41-year-old male patient with idiopathic generalized dystonia for trajectory planning and lead placement of a bilateral stimulation of STN after bilateral pallidotomy (Fonoff et al. 2012). Scaled models of the Medtronic DBS electrode 3387 were displayed
Results
Identification of nuclear boundaries
Based on the Nissl-stained sections, it was possible to recognize and delineate the major thalamic nuclei according to the terminology proposed by Hassler et al. (1982) (Figs. 3, 5, 9), the basal ganglia structures (Schaltenbrand et al. 1977) (Figs. 6, 7) and the BFCS following Mesulam’s nomenclature (Fig. 8) (Mesulam et al. 1983). The labeling was based on cytoarchitectural criteria. In addition, Case 3 labeling employed myeloarchitectural criteria (Fig. 4). The thalamic nuclei were categorized into trunco- and palliothalamic nuclei, and into the major groups of thalamic nuclei including the anterior nuclear group, medial nuclear region, central gray nuclei, envelope, lateral nuclear region, pulvinar, medial/lateral geniculate bodies, and reticular nucleus.
The borders of the sub-nuclei did not follow simple geometric lines, but proved to be highly complex. By viewing our relatively thick gallocyanin-stained sections with a stereomicroscope at low and medium power magnifications, we obtained an improved visual depiction and a better tridimensional visualization of nuclear contours and boundaries. Dark-field illumination on the same slice enhanced contrast and also facilitated segmentation (Fig. 7). Highly complex cloud-like neuronal aggregations could be seen in the medial thalamic nuclear region, whereas the ventrocaudalis parvocellullaris (V.c.pc.) sub-nuclei appeared as chromophilic (darkly gallocyanin-stained) satellites attached to the ventrocaudalis anterior (V.c.a.). Less complex neuronal aggregates could be observed in the lateral thalamic nucleus. These aggregates differed in shape and staining properties from each other, similar to those in the medial nuclear region. In contrast to the medial sub-nuclei, the neuronal aggregates in the lateral nuclear region were characterized by a striation reminiscent of cortical vertical radii. The caliber of these thalamic radii varied from fine, through intermediate, to coarse. In dark-field illumination (Fig. 4d), these radii were seen as myelinated fibers. This kind of striation offered an additional criterion for nuclear delineation. Fine caliber fibers penetrated the pulvinar, intermediate fibers Vi, and coarse fibers Vc.
Regarding to segmentation of the basal ganglia structures, the most challenging structures are the identification of GPi borders and the interdigitation of ventral pallidum and nucleus accumbens. Dark-field illumination was indispensible to clarify unequivocally nuclear borders between highly irregular profiles of different sub-cortical gray matter interdigitating in this brain region (Figs. 6, 7).
This approach rendered possible DTI and fiber-tracking visualization combined with the 3D cytoarchitecture (Fig. 9). This feature is important to help localization of structures in vivo in pre-operative planning and post-operative analysis (Alho et al. 2017).
Quantitative evaluation of registration
Concerning to DSC values, the means for manual 2D registration were slightly higher than automated registration (2D manual 0.9642 ± 0.0186 vs. 2D automated 0.9427 ± 0.0030). For 3D registration, the DSC value for the automated method was slightly higher (manual 0.9486 vs. automated 0.9675). These values show a very good registration localization for both sets, since values above 0.7 are considered to reflect good overlap between slices (Crum et al. 2006). Measurement of nWSD is a relatively new metric; however, the authors provide an extensive evaluation of the method (Konukoglu et al. 2012, 2013). An nWSD value above 0.01 reflects shape difference. The mean sWSD for 2D manual registration was 0.0066 ± 0.0005 vs. 0.0080 ± 0.00003 for automated procedure, while 3D manual warps had an sWSD of 0.0045 vs. 0.0054 for 3D-automated warps. All the mean values are below 0.01 for 2D and 3D registrations, inferring good shape match between the blocks in average. In addition, the smaller values of manual registrations reflect slightly less shape difference between masks. Table 2 and Fig. 10 summarize these results.
Table 2.
Results of measurements of dice similarity coefficient (DSC) and normalized weighted spectral distance (nWSD) for Case 1 (manual registration) and Case 2 (automated registration)
| N | Mean DSC ± CI 95% | SD | Min | Max | Mean nWSD ± CI 95% | SD | Min | Max | |
|---|---|---|---|---|---|---|---|---|---|
| Case 1 | |||||||||
| 2D warp | 103 | 0.9642 ± 0.0186 | 0.0955 | 0.0110 | 0.9878 | 0.0066 ± 0.0005 | 0.0024 | 0.001 | 0.01 |
| 3D warp | 1 | 0.9486 | – | – | – | 0.0045 | – | – | – |
| Case 2 | |||||||||
| 2D warp | 262 | 0.9427 ± 0.0030 | 0.0291 | 0.7881 | 0.9780 | 0.0080 ± 0.00003 | 0.0002 | 0.008 | 0.009 |
| 3D warp | 1 | 0.9675 | – | – | – | 0.0054 | – | – | – |
Mean values with 95% confidence intervals (CI 95%), standard deviations (SD), and minimal and maximal values are also listed. N is the number of pairs of slices (2D) or pairs of volumes (3D) evaluated. t test demonstrated p < 0.05 for comparison between DSC and nWSD values for 2D warps of Cases 1 and 2
Fig. 10.
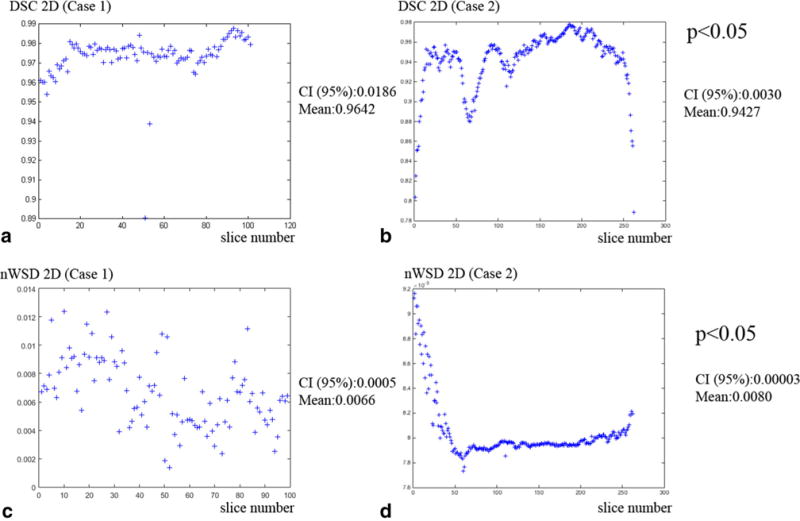
Results of DSC and nWSD for bidimensional warps for Cases 1 (manual registration) and 2 (automated registration). a DSC values for manual registration of histology and blockface images (2D); b DSC for 2D ANTS registration and; c nWSD values for 2D manual registration; and d nWSD for 2D ANTS registration. t test showed that the difference in average DSC and nWSD values for manual and automated registration are statistically significant (p < 0.05), with small confidence intervals (CI 95%)
In summary, both manual and automated registration procedures rendered good overlap between 2D slices and 3D volumes, and little shape difference after registration. Manual registration was slightly better for 2D slices, providing greater overlap and less shape difference after registration (p < 0.05).
Discussion
Using computational technology, several authors created 3D atlases based on the most widely consulted printed atlases (Yoshida 1987; Nowinski et al. 1997; St-Jean et al. 1998; Nowinski and Belov 2003; Ganser et al. 2004; Carballo-Barreda et al. 2007). However, some inaccuracies in the original atlases led to 3D inconsistencies (Niemann et al. 1994; Nowinski et al. 1997, 2006; Niemann and van Nieuwenhofen 1999).
These inaccuracies are due to strains occurred during the processing of the nervous tissue. First, 3D deformations befall at the moment of extraction from the skull, followed by volumetric distortions due to fixation procedure (Small and Peterson 1982; Kretschmann et al. 1982; Quester and Schröder 1997; Simmons and Swanson 2009; Schulz et al. 2011). Second, the serial sectioning, staining, and cover-slipping procedures inevitably confound the planar and spatial arrangements of individual sections (Bauchot 1967). Major sources of error considering histological processing include thickness (thinner slices tend to distort more than thicker slices), differential shrinkage between gray vs. white matter and mounting on slides (Simmons and Swanson 2009).
Histological digital data sets have been recently published by several authors (Chakravarty et al. 2006; Yelnik et al. 2007; Krauth et al. 2010; Amunts et al. 2013) and the solution for the problem of histological distortion is heavily based on image registration procedures and algorithms. Medical image registration tools are optimized for registering different imaging modalities of the same individual (for example, computed tomography to MRI) or to normalize different individual data of the same modality to a common standard stereotactic space. Inter-individual in vivo registration is already robust at macroscopic level; however, accurate registration of histology to MRI remains difficult, notwithstanding last decade’s development on the field (Alic and Haeck 2010). MRI-to-histology registration renders many challenges, including applying complex algorithms to data sets in the order of Terabytes, taking up to 1000 h of uninterrupted data acquisition (Amunts et al. 2013). Management of such amount of information requires special computational solutions, available in few high-end neuroimaging centers.
The aim of this study was to describe a new procedure to co-register high-resolution histological slices to high-resolution MRI data sets to construct a 3D coherent MRI–histological atlas of the human brain, normalized to MNI space. The main characteristics of our proposal are: (a) relatively high section thickness (400–560 lm) and a modified Nissl stain (Heinsen and Heinsen 1991; Heinsen et al. 2000) histological technique and (b) post-mortem in situ high-resolution 3 T MR images. The applications of the procedure described here are various, but the atlas can be efficiently applied to in vivo MRI data sets, either for post-operative analysis (Fonoff et al. 2012; Martinez et al. 2013) or to clinical voxel-based morphometry (VBM) studies (Kilimann et al. 2014; Teipel et al. 2014). Normalization of high-resolution histology-to-MNI space has clinical importance, since it is the standard stereotactic space in neuroimaging literature and has gained attention recently in the neurosurgical literature in the context of DBS (Horn and Kühn 2015; Ewert et al. 2017).
The gallocyanin staining of thick sections considerably facilitates the delineation of cortical areas and sub-cortical nuclei, as well as excluding neuropathological changes (Heckers et al. 1991; Heinsen et al. a, b, 1996; Casanova et al. 2008; Grinberg et al. 2009; Ewers et al. 2011). When compared to traditional 70 lm, or ultrahigh-resolution 20 lm histological slices, the 400–560 lm sections provide more cells per section, allowing a 3D impression of the arrangement of neurons within nuclear boundaries and, therefore, greatly facilitating segmentation of cortical and sub-cortical gray matter. Dark-field illumination supplied additional myeloarchitectural criteria (density and distribution of myelinated fibers) for tracing nuclear subdivisions, at the same slice (Figs. 4, 7).
Ultrahigh-resolution slices (20 lm) supply microscopic functional information at cellular resolution (Amunts et al. 2013). Although very thin slices provide high detailed knowledge about the neurons, there is some price to pay. First, it generates thousands of slices, and histological processing, analysis, and segmentation of all of them besides time consuming and expensive, requires also outstanding computing power. A possible solution for this issue is skipping slices, leading to interpolation of information. If blockface images and segmentation are performed at every 20th section in a 20 lm-thick stack, a final resolution of 400 lm is obtained. We consider that when the objective is to delineate nuclear boundaries, (instead of obtaining detailed cellular information) it is preferable to analyze 400 lm sections. This approach spares the need of interpolation, and loss of information. The micrometric focus can be used to understand the architecture and relationship between neurons. Second, very thin slices are more prone to suffer distortions and artifacts (Simmons and Swanson 2009).
The thalamic parcellation proposed by Hirai and Jones (1989) is widely used in research, and it is based on immunohistochemical staining. For this study‘, only the cytoarchitectural criteria were applied, and therefore, Hassler’s parcellation (Hassler et al. 1982) was more adequate to our purposes. Hassler’s terminology is also used by neurosurgeons, insofar as the Schaltenbrand and Wahren atlas (Schaltenbrand et al. 1977) use this terminology and it still is an important tool for stereotactic neurosurgeons. Mesulam’s nomenclature adopted for the BFCS is also widely used for humans (Zaborszky et al. 2008; Butler et al. 2014), although it was originally described in rats (Mesulam et al. 1983).
Our results showed very good overlap between histology and MRI slices and volumes, and very little shape difference after registration, using either manual or automated algorithms for warping the images. Manual registration of slices is time consuming and operator-dependent, but does not depend on automated pre-processing steps such as background segmentation, which can also be very challenging. This might be the reason why 2D DSC and nWSD values revealed slightly better results for manual procedures. The reduced number of slices due to high thickness rendered also possible to manually warp a whole brain. Good overlapping and little shape difference after registration can also be due to less distortion induced by the high thickness of the histological sections.
The MRI of the specimens was determinative for the atlas construction, since normalization of the histology into MNI space was facilitated (MRI to MRI fusion). The in situ acquisition of the images allowed the correction of distortions caused by formalin fixation, cutting, staining, and mounting of histological slices. Atlas fusion into pre-operative imaging (Fig. 9; Online Resource 3) is also facilitated, since non-linear algorithms for MRI to MRI registration are already robust and the alternative to warp traditional atlases into patients is based on affine transformations and control points.
The high thickness histological technique, due to the reduced number of slices per brain and consequently reduced costs and processing time, opens the possibility to study a high number of brains in the forseeable future. This is particularly important in the functional neurosurgery field, where multiple atlases derived from very different brains are desired, instead of a probabilistic average. With multiple atlases, it is possible to choose and register the most similar atlas to the patient, minimizing atlas-to-patient registration errors that commonly occur, while pre-operative planning is proceeded.
Conclusions
We described a 3D cytoarchitecture-based sub-cortical atlas normalized to MNI space using relatively thick histological techniques in combination with manual or automated multiple 2D and 3D MRI data registration. Quantitative assessment of registration procedures showed good 2D and 3D warping quality, for either manual or automated approaches. The high power magnifications of the 400–560 lm gallocyanin-stained sections together with dark-field microscopy facilitated the cytoarchitectural segmentation of the nuclear boundaries of the structures studied, generating manageable amount of data without the need of outstanding computer power. The cytoarchitectural maps generated in this work were applied to imaging studies (Alho et al. 2017) and clinical data (Fonoff et al. 2012; Martinez et al. 2013; Kilimann et al. 2014; Teipel et al. 2014), with important implications. We demonstrated in two cases that when the focus is to study nuclear boundaries instead of detailed cellular information, high thickness slices provide an effective alternative method to achieve those results.
Supplementary Material
Acknowledgments
The authors would like to thank the team participating on the São Paulo-Würzburg collaborative project. This includes all members of the Brain Bank of the Brazilian Aging Brain Research Group (BBBABSG) of the University of São Paulo Medical School, Mrs. E. Broschk and Mrs. A. Bahrke from the Morphological Brain Research Unit of the University of Würzburg, Germany.
Funding source
This study was supported by resources from the University of Sao Paulo School of Medicine, Brazil and University of Würzburg, Germany. The author Eduardo Joaquim Lopes Alho was supported by a scholarship from CAPES (Coordenação de Aperfeiçoamento de Pessoal de Nível Superior) agency, Brazil, for doctoral studies at the University of Würzburg, Germany. The authors do not have personal financial or institutional interest in any of the drugs, materials, or devices described in this article.
Footnotes
Compliance with ethical standards
Conflict of interest
The authors disclose any actual or potential conflict of interest including any financial, personal, or other relationships with other people or organizations within 3 years of beginning the submitted work that could inappropriately influence, or be perceived to influence, their work.
Ethical standards
The work described has been carried out in accordance with The Code of Ethics of the World Medical Association (Declaration of Helsinki).
References
- Afshar F, Watkins ES, Yap JC. Stereotaxic atlas of the human brainstem and cerebellar nuclei: a variability study. Raven Press; New York: 1978. [Google Scholar]
- Alegro M, Loring B, Alho E, et al. Multimodal whole brain registration: MRI and high resolution histology. 2016 http://www.cv-foundation.org/openaccess/content_cvpr_2016_workshops/w15/papers/Alegro_Multimodal_Whole_Brain_CVPR_2016_paper.pdf. Accessed 9 Sep 2016.
- Alho ATDL, Hamani C, Alho EJL, et al. Magnetic resonance diffusion tensor imaging for the pedunculopontine nucleus: proof of concept and histological correlation. Brain Struct Funct. 2017 doi: 10.1007/s00429-016-1356-0. https://doi.org/10.1007/s00429-016-1356-0. [DOI] [PMC free article] [PubMed]
- Alic L, Haeck JH. Multi-modal image registration: matching MRI with histology. SPIE Medical Imaging; San Diego: 2010. [Google Scholar]
- Amunts K, Lepage C, Borgeat L, et al. BigBrain: an ultrahigh-resolution 3D human brain model. Science. 2013;340:1472–1475. doi: 10.1126/science.1235381. https://doi.org/10.1126/science.1235381. [DOI] [PubMed] [Google Scholar]
- Andrew J, Watkins ES. A stereotaxic atlas of the human thalamus and adjacent structures: a variability study. Williams and Wilkins; Baltimore: 1969. [Google Scholar]
- Aoki S, Okada Y, Nishimura K, et al. Normal deposition of brain iron in childhood and adolescence: MR imaging at 1.5 T. Radiology. 1989;172:381–385. doi: 10.1148/radiology.172.2.2748819. https://doi.org/10.1148/radiology.172.2.2748819. [DOI] [PubMed] [Google Scholar]
- Avants BB, Epstein CL, Grossman M, Gee JC. Symmetric diffeomorphic image registration with cross-correlation: evaluating automated labeling of elderly and neurodegenerative brain. Med Image Anal. 2008;12:26–41. doi: 10.1016/j.media.2007.06.004. https://doi.org/10.1016/j.media.2007.06.004. [DOI] [PMC free article] [PubMed] [Google Scholar]
- Bauchot R. Modifications of brain weight in the course of fixation. J Für Hirnforsch. 1967;9:253–283. [PubMed] [Google Scholar]
- Butler T, Zaborszky L, Pirraglia E, et al. Comparison of human septal nuclei MRI measurements using automated segmentation and a new manual protocol based on histology. NeuroImage. 2014;97:245–251. doi: 10.1016/j.neuroimage.2014.04.026. https://doi.org/10.1016/j.neuroimage.2014.04.026. [DOI] [PMC free article] [PubMed] [Google Scholar]
- Carballo-Barreda M, RodríGuez-Rojas R, Torres-Montoya A, LóPez-Flores G. Computerized atlas for image-guided stereotactic functional neurosurgery. Neurocir Astur Spain. 2007;18:478–484. [PubMed] [Google Scholar]
- Casanova MF, Kreczmanski P, Trippe J, 2nd, et al. Neuronal distribution in the neocortex of schizophrenic patients. Psychiatry Res. 2008;158:267–277. doi: 10.1016/j.psychres.2006.12.009. https://doi.org/10.1016/j.psychres.2006.12.009. [DOI] [PubMed] [Google Scholar]
- Chakravarty MM, Bertrand G, Hodge CP, et al. The creation of a brain atlas for image guided neurosurgery using serial histological data. NeuroImage. 2006;30:359–376. doi: 10.1016/j.neuroimage.2005.09.041. https://doi.org/10.1016/j.neuroimage.2005.09.041. [DOI] [PubMed] [Google Scholar]
- Crum WR, Camara O, Hill DLG. Generalized overlap measures for evaluation and validation in medical image analysis. IEEE Trans Med Imaging. 2006;25:1451–1461. doi: 10.1109/TMI.2006.880587. https://doi.org/10.1109/TMI.2006.880587. [DOI] [PubMed] [Google Scholar]
- Dandy WE. Ventriculography following the injection of air into the cerebral ventricles. Ann Surg. 1918;68:5–11. doi: 10.1097/00000658-191807000-00002. [DOI] [PMC free article] [PubMed] [Google Scholar]
- Dice LR. Measures of the amount of ecologic association between species. Ecology. 1945;26:297–302. https://doi.org/10.2307/1932409. [Google Scholar]
- Drayer B, Burger P, Darwin R, et al. MRI of brain iron. AJR Am J Roentgenol. 1986;147:103–110. doi: 10.2214/ajr.147.1.103. https://doi.org/10.2214/ajr.147.1.103. [DOI] [PubMed] [Google Scholar]
- Duyn JH. The future of ultra-high field MRI and fMRI for study of the human brain. Neuroimage. 2012;62:1241–1248. doi: 10.1016/j.neuroimage.2011.10.065. https://doi.org/10.1016/j.neuroimage.2011.10.065. [DOI] [PMC free article] [PubMed] [Google Scholar]
- Emmers R, Tasker R. The human somesthetic thalamus: with maps for physiological target localization during stereotactic neurosurgery. Raven Press; New York: 1975. [Google Scholar]
- Ewers M, Frisoni GB, Teipel SJ, et al. Staging Alzheimer’s disease progression with multimodality neuroimaging. Prog Neurobiol. 2011;95:535–546. doi: 10.1016/j.pneurobio.2011.06.004. https://doi.org/10.1016/j.pneurobio.2011.06.004. [DOI] [PMC free article] [PubMed] [Google Scholar]
- Ewert S, Plettig P, Li N, et al. Toward defining deep brain stimulation targets in MNI space: a subcortical atlas based on multimodal MRI, histology and structural connectivity. NeuroImage. 2017 doi: 10.1016/j.neuroimage.2017.05.015. https://doi.org/10.1016/j.neuroimage.2017.05.015. [DOI] [PubMed]
- Fonoff ET, Campos WK, Mandel M, et al. Bilateral subthalamic nucleus stimulation for generalized dystonia after bilateral pallidotomy. Mov Disord Off J Mov Disord Soc. 2012;27:1559–1563. doi: 10.1002/mds.25127. https://doi.org/10.1002/mds.25127. [DOI] [PubMed] [Google Scholar]
- Fonov V, Evans AC, Botteron K, et al. Unbiased average age-appropriate atlases for pediatric studies. NeuroImage. 2011;54:313–327. doi: 10.1016/j.neuroimage.2010.07.033. https://doi.org/10.1016/j.neuroimage.2010.07.033. [DOI] [PMC free article] [PubMed] [Google Scholar]
- François C, Yelnik J, Percheron G. A stereotaxic atlas of the basal ganglia in macaques. Brain Res Bull. 1996;41:151–158. doi: 10.1016/0361-9230(96)00161-x. [DOI] [PubMed] [Google Scholar]
- Franklin K, Paxinos G. The mouse brain in stereotaxic coordinates. Academic Press; New York: 2008. [Google Scholar]
- Ganser KA, Dickhaus H, Metzner R, Wirtz CR. A deformable digital brain atlas system according to Talairach and Tournoux. Med Image Anal. 2004;8:3–22. doi: 10.1016/j.media.2003.06.001. [DOI] [PubMed] [Google Scholar]
- Grinberg L, Heinsen H. Computer-assisted 3D reconstruction of the human basal forebrain complex. Dement Neuropsychol. 2007;1:140–146. doi: 10.1590/s1980-57642008dn10200005. [DOI] [PMC free article] [PubMed] [Google Scholar]
- Grinberg LT, Amaro E, Jr, Teipel S, et al. Assessment of factors that confound MRI and neuropathological correlation of human postmortem brain tissue. Cell Tissue Bank. 2008;9:195–203. doi: 10.1007/s10561-008-9080-5. https://doi.org/10.1007/s10561-008-9080-5. [DOI] [PubMed] [Google Scholar]
- Grinberg LT, Amaro Junior E, da Silva AV, et al. Improved detection of incipient vascular changes by a biotechnological platform combining post mortem MRI in situ with neuropathology. J Neurol Sci. 2009;283:2–8. doi: 10.1016/j.jns.2009.02.327. https://doi.org/10.1016/j.jns.2009.02.327. [DOI] [PubMed] [Google Scholar]
- Haakma W, Pedersen M, Froeling M, et al. Diffusion tensor imaging of peripheral nerves in non-fixed post-mortem subjects. Forensic Sci Int. 2016;263:139–146. doi: 10.1016/j.forsciint.2016.04.001. https://doi.org/10.1016/j.forsciint.2016.04.001. [DOI] [PubMed] [Google Scholar]
- Hallgren B, Sourander P. The effect of age on the non-haemin iron in the human brain. J Neurochem. 1958;3:41–51. doi: 10.1111/j.1471-4159.1958.tb12607.x. [DOI] [PubMed] [Google Scholar]
- Hassler R, Schaltenbrand G, Walker E. Architectonic organization of the thalamic nuclei. In: Schaltenbrand G, Walker E, editors. Stereotaxy of the human brain: anatomical, physiological and clinical applications. 2nd. George Thieme Verlag; Stuttgart: 1982. [Google Scholar]
- Heckers S, Heinsen H, Heinsen Y, Beckmann H. Cortex, white matter, and basal ganglia in schizophrenia: a volumetric postmortem study. Biol Psychiatry. 1991;29:556–566. doi: 10.1016/0006-3223(91)90091-y. [DOI] [PubMed] [Google Scholar]
- Heinsen H, Heinsen YL. Serial thick, frozen, gallocyanin stained sections of human central nervous system. J Histotechnol. 1991;14:167–173. [Google Scholar]
- Heinsen H, Henn R, Eisenmenger W, et al. Quantitative investigations on the human entorhinal area: left–right asymmetry and age-related changes. Anat Embryol (Berl) 1994a;190:181–194. doi: 10.1007/BF00193414. [DOI] [PubMed] [Google Scholar]
- Heinsen H, Strik M, Bauer M, et al. Cortical and striatal neurone number in Huntington’s disease. Acta Neuropathol (Berl) 1994b;88:320–333. doi: 10.1007/BF00310376. [DOI] [PubMed] [Google Scholar]
- Heinsen H, Rüb U, Gangnus D, et al. Nerve cell loss in the thalamic centromedian–parafascicular complex in patients with Huntington’s disease. Acta Neuropathol (Berl) 1996;91:161–168. doi: 10.1007/s004010050408. [DOI] [PubMed] [Google Scholar]
- Heinsen H, Arzberger T, Schmitz C. Celloidin mounting (embedding without infiltration)—a new, simple and reliable method for producing serial sections of high thickness through complete human brains and its application to stereological and immunohistochemical investigations. J Chem Neuroanat. 2000;20:49–59. doi: 10.1016/s0891-0618(00)00067-3. [DOI] [PubMed] [Google Scholar]
- Hirai T, Jones EG. A new parcellation of the human thalamus on the basis of histochemical staining. Brain Res Brain Res Rev. 1989;14:1–34. doi: 10.1016/0165-0173(89)90007-6. [DOI] [PubMed] [Google Scholar]
- Horn A, Kühn AA. Lead-DBS: a toolbox for deep brain stimulation electrode localizations and visualizations. NeuroImage. 2015;107:127–135. doi: 10.1016/j.neuroimage.2014.12.002. https://doi.org/10.1016/j.neuroimage.2014.12.002. [DOI] [PubMed] [Google Scholar]
- Ilinsky IA, Kultas-Ilinsky K, Knosp B. Stereotactic atlas of the Macaca mulatta thalamus and adjacent basal ganglia nuclei. Springer; Boston: 2002. [Google Scholar]
- Jenkinson M, Beckmann CF, Behrens TEJ, et al. FSL. NeuroImage. 2012;62:782–790. doi: 10.1016/j.neuroimage.2011.09.015. https://doi.org/10.1016/j.neuroimage.2011.09.015. [DOI] [PubMed] [Google Scholar]
- Kilimann I, Grothe M, Heinsen H, et al. Subregional basal forebrain atrophy in Alzheimer’s disease: a multicenter study. J Alzheimers Dis JAD. 2014;40:687–700. doi: 10.3233/JAD-132345. https://doi.org/10.3233/JAD-132345. [DOI] [PMC free article] [PubMed] [Google Scholar]
- König JFR, Klippel RA. The rat brain: a stereotaxic atlas of the forebrain and lower parts of the brain stem. Williams and Wilkins; Baltimore: 1963. [Google Scholar]
- Konukoglu E, Glocker B, Ye DH, et al. Discriminative segmentation-based evaluation through shape dissimilarity. IEEE Trans Med Imaging. 2012;31:2278–2289. doi: 10.1109/TMI.2012.2216281. [DOI] [PMC free article] [PubMed] [Google Scholar]
- Konukoglu E, Glocker B, Criminisi A, Pohl KM. WESD—weighted spectral distance for measuring shape dissimilarity. IEEE Trans Pattern Anal Mach Intell. 2013;35:2284–2297. doi: 10.1109/TPAMI.2012.275. [DOI] [PMC free article] [PubMed] [Google Scholar]
- Krauth A, Blanc R, Poveda A, et al. A mean three-dimensional atlas of the human thalamus: generation from multiple histological data. NeuroImage. 2010;49:2053–2062. doi: 10.1016/j.neuroimage.2009.10.042. https://doi.org/10.1016/j.neuroimage.2009.10.042. [DOI] [PubMed] [Google Scholar]
- Kretschmann HJ, Tafesse U, Herrmann A. Different volume changes of cerebral cortex and white matter during histological preparation. Microsc Acta. 1982;86:13–24. [PubMed] [Google Scholar]
- Kroon JP, Riley AL. A microcomputer-based system for stereotaxic coordinates in the rat brain. Physiol Behav. 1986;38:593–596. doi: 10.1016/0031-9384(86)90430-0. [DOI] [PubMed] [Google Scholar]
- Kumazawa-Manita N, Katayama M, Hashikawa T, Iriki A. Three-dimensional reconstruction of brain structures of the rodent Octodon degus: a brain atlas constructed by combining histological and magnetic resonance images. Exp Brain Res. 2013;231:65–74. doi: 10.1007/s00221-013-3667-1. https://doi.org/10.1007/s00221-013-3667-1. [DOI] [PMC free article] [PubMed] [Google Scholar]
- Lanciego JL, Vázquez A. The basal ganglia and thalamus of the long-tailed macaque in stereotaxic coordinates. A template atlas based on coronal, sagittal and horizontal brain sections. Brain Struct Funct. 2012;217:613–666. doi: 10.1007/s00429-011-0370-5. https://doi.org/10.1007/s00429-011-0370-5. [DOI] [PMC free article] [PubMed] [Google Scholar]
- Mai JK, Paxinos G, Voss T. Atlas of the human brain. Academic Press; New York: 2008. [Google Scholar]
- Martin RF, Bowden DM. A stereotaxic template atlas of the macaque brain for digital imaging and quantitative neuroanatomy. NeuroImage. 1996;4:119–150. doi: 10.1006/nimg.1996.0036. https://doi.org/10.1006/nimg.1996.0036. [DOI] [PubMed] [Google Scholar]
- Martinez RCR, Hamani C, de Carvalho MC, et al. Intraoperative dopamine release during globus pallidus internus stimulation in Parkinson’s disease. Mov Disord Off J Mov Disord Soc. 2013 doi: 10.1002/mds.25691. https://doi.org/10.1002/mds.25691. [DOI] [PubMed]
- Mesulam MM, Mufson EJ, Wainer BH, Levey AI. Central cholinergic pathways in the rat: an overview based on an alternative nomenclature (Ch1–Ch6) Neuroscience. 1983;10:1185–1201. doi: 10.1016/0306-4522(83)90108-2. [DOI] [PubMed] [Google Scholar]
- Morel A. Stereotactic atlas of the human thalamus and basal ganglia. Informa Healthcare; New York: 2007. [Google Scholar]
- Morel A, Magnin M, Jeanmonod D. Multiarchitectonic and stereotactic atlas of the human thalamus. J Comp Neurol. 1997;387:588–630. doi: 10.1002/(sici)1096-9861(19971103)387:4<588::aid-cne8>3.0.co;2-z. [DOI] [PubMed] [Google Scholar]
- Niemann K, van Nieuwenhofen I. One Atlas–Three Anatomies: relationships of the Schaltenbrand and Wahren Microscopic Data. Acta Neurochir (Wien) 1999;141:1025–1038. doi: 10.1007/s007010050479. [DOI] [PubMed] [Google Scholar]
- Niemann K, Naujokat C, Pohl G, et al. Verification of the Schaltenbrand and Wahren stereotactic atlas. Acta Neurochir (Wien) 1994;129:72–81. doi: 10.1007/BF01400876. [DOI] [PubMed] [Google Scholar]
- Nowinski WL, Belov D. The Cerefy Neuroradiology Atlas: a Talairach–Tournoux atlas-based tool for analysis of neuroimages available over the internet. NeuroImage. 2003;20:50–57. doi: 10.1016/s1053-8119(03)00252-0. [DOI] [PubMed] [Google Scholar]
- Nowinski WL, Fang A, Nguyen BT, et al. Multiple brain atlas database and atlas-based neuroimaging system. Comput Aided Surg Off J Int Soc Comput Aided Surg. 1997;2:42–66. doi: 10.1002/(SICI)1097-0150(1997)2:1<42::AID-IGS7>3.0.CO;2-N. https://doi.org/10.1002/(SICI)1097-0150(1997)2:1<42:AID-IGS7>3.0.CO;2-N. [DOI] [PubMed] [Google Scholar]
- Nowinski WL, Belov D, Thirunavuukarasuu A, Benabid AL. A probabilistic functional atlas of the VIM nucleus constructed from pre-, intra- and postoperative electrophysiological and neuroimaging data acquired during the surgical treatment of Parkinson’s disease patients. Stereotact Funct Neurosurg. 2005;83:190–196. doi: 10.1159/000091082. https://doi.org/10.1159/000091082. [DOI] [PubMed] [Google Scholar]
- Nowinski WL, Liu J, Thirunavuukarasuu A. Quantification and visualization of the three-dimensional inconsistency of the subthalamic nucleus in the Schaltenbrand–Wahren brain atlas. Stereotact Funct Neurosurg. 2006;84:46–55. doi: 10.1159/000093722. https://doi.org/10.1159/000093722. [DOI] [PubMed] [Google Scholar]
- Ono M, Kubik S, Abernathey CD. Atlas of the cerebral sulci. G. Thieme Verlag/Thieme Medical Publishers; Stuttgart/New York: 1990. [Google Scholar]
- Paxinos G, Watson C. The rat brain in stereotaxic coordinates. Academic Press; New York: 1986. [DOI] [PubMed] [Google Scholar]
- Quester R, Schröder R. The shrinkage of the human brain stem during formalin fixation and embedding in paraffin. J Neurosci Methods. 1997;75:81–89. doi: 10.1016/s0165-0270(97)00050-2. [DOI] [PubMed] [Google Scholar]
- Reese R, Pinsker MO, Herzog J, et al. The atypical subthalamic nucleus—an anatomical variant relevant for stereotactic targeting. Mov Disord Off J Mov Disord Soc. 2012;27:544–548. doi: 10.1002/mds.24902. https://doi.org/10.1002/mds.24902. [DOI] [PubMed] [Google Scholar]
- Reuter M, Rosas HD, Fischl B. Highly accurate inverse consistent registration: a robust approach. NeuroImage. 2010;53:1181–1196. doi: 10.1016/j.neuroimage.2010.07.020. https://doi.org/10.1016/j.neuroimage.2010.07.020. [DOI] [PMC free article] [PubMed] [Google Scholar]
- Saleem KS, Logothetis NK. A combined MRI and histology atlas of the rhesus monkey brain in stereotaxic coordinates. Academic Press; New York: 2012. [Google Scholar]
- Schaltenbrand G, Bailey P. Introduction to stereotaxis with an atlas of the human brain, vol I: Text, vol II: Plate 1–57, vol III: Plate 58–76. Georg Thieme, Grune & Stratton; Stuttgart, New York: 1959. [Google Scholar]
- Schaltenbrand G, Hassler R, Wahren W. Atlas for stereotaxy of the human brain: with an accompanying guide. Thieme; Stuttgart: 1977. [Google Scholar]
- Schulz G, Crooijmans HJA, Germann M, et al. Three-dimensional strain fields in human brain resulting from formalin fixation. J Neurosci Methods. 2011;202:17–27. doi: 10.1016/j.jneumeth.2011.08.031. https://doi.org/10.1016/j.jneumeth.2011.08.031. [DOI] [PubMed] [Google Scholar]
- Schwarz AJ, Danckaert A, Reese T, et al. A stereotaxic MRI template set for the rat brain with tissue class distribution maps and co-registered anatomical atlas: application to pharmacological MRI. NeuroImage. 2006;32:538–550. doi: 10.1016/j.neuroimage.2006.04.214. https://doi.org/10.1016/j.neuroimage.2006.04.214. [DOI] [PubMed] [Google Scholar]
- Shanta TR, Manocha SL, Bourne GH. A stereotaxic atlas of the java monkey brain (Macaca irus) Basel: Karger; 1968. [DOI] [Google Scholar]
- Simmons DM, Swanson LW. Comparing histological data from different brains: sources of error and strategies for minimizing them. Brain Res Rev. 2009;60:349–367. doi: 10.1016/j.brainresrev.2009.02.002. [DOI] [PMC free article] [PubMed] [Google Scholar]
- Small CS, Peterson DI. The reliability of dimensions of formalin-fixed brains. Neurology. 1982;32:413–415. doi: 10.1212/wnl.32.4.413. [DOI] [PubMed] [Google Scholar]
- Spiegel EA, Wycis HT, Freed H. Stereoencephalotomy: thalamotomy and related procedures. J Am Med Assoc. 1952;148:446–451. doi: 10.1001/jama.1952.02930060028009. https://doi.org/10.1001/jama.1952.02930060028009. [DOI] [PubMed] [Google Scholar]
- St-Jean P, Sadikot AF, Collins L, et al. Automated atlas integration and interactive three-dimensional visualization tools for planning and guidance in functional neurosurgery. IEEE Trans Med Imaging. 1998;17:672–680. doi: 10.1109/42.736017. https://doi.org/10.1109/42.736017. [DOI] [PubMed] [Google Scholar]
- Talairach J. Atlas d’anatomie stéréotaxique; repérage radiologique indirect des noyaux gris centraux des régions mésencéphalo-sous-optique et hypothalamique de l’homme. Masson; Paris: 1957. [Google Scholar]
- Talairach J, Tournoux P. Co-planar stereotaxic atlas of the human brain: 3-dimensional proportional system: an approach to medical cerebral imaging. Thieme; Stuttgart: 1988. [Google Scholar]
- Teipel SJ, Meindl T, Grinberg L, et al. Novel MRI techniques in the assessment of dementia. Eur J Nucl Med Mol Imaging. 2008;35(Suppl 1):S58–S69. doi: 10.1007/s00259-007-0703-z. https://doi.org/10.1007/s00259-007-0703-z. [DOI] [PubMed] [Google Scholar]
- Teipel SJ, Meindl T, Grinberg L, et al. The cholinergic system in mild cognitive impairment and Alzheimer’s disease: an in vivo MRI and DTI study. Hum Brain Mapp. 2011;32:1349–1362. doi: 10.1002/hbm.21111. https://doi.org/10.1002/hbm.21111. [DOI] [PMC free article] [PubMed] [Google Scholar]
- Teipel SJ, Flatz W, Ackl N, et al. Brain atrophy in primary progressive aphasia involves the cholinergic basal forebrain and Ayala’s nucleus. Psychiatry Res. 2014;221:187–194. doi: 10.1016/j.pscychresns.2013.10.003. https://doi.org/10.1016/j.pscychresns.2013.10.003. [DOI] [PMC free article] [PubMed] [Google Scholar]
- Toga AW, Samaie M, Payne BA. Digital rat brain: a computerized atlas. Brain Res Bull. 1989;22:323–333. doi: 10.1016/0361-9230(89)90060-9. [DOI] [PubMed] [Google Scholar]
- Van Buren JM, Borke RC. Variations and connections of the human thalamus. Springer; Berlin: 1972. [Google Scholar]
- Yelnik J, Bardinet E, Dormont D, et al. A three-dimensional, histological and deformable atlas of the human basal ganglia. I. Atlas construction based on immunohistochemical and MRI data. NeuroImage. 2007;34:618–638. doi: 10.1016/j.neuroimage.2006.09.026. https://doi.org/10.1016/j.neuroimage.2006.09.026. [DOI] [PubMed] [Google Scholar]
- Yoshida M. Creation of a three-dimensional atlas by interpolation from Schaltenbrand–Bailey’s atlas. Appl Neurophysiol. 1987;50:45–48. doi: 10.1159/000100682. [DOI] [PubMed] [Google Scholar]
- Zaborszky L, Hoemke L, Mohlberg H, et al. Stereotaxic probabilistic maps of the magnocellular cell groups in human basal forebrain. NeuroImage. 2008;42:1127–1141. doi: 10.1016/j.neuroimage.2008.05.055. https://doi.org/10.1016/j.neuroimage.2008.05.055. [DOI] [PMC free article] [PubMed] [Google Scholar]
Associated Data
This section collects any data citations, data availability statements, or supplementary materials included in this article.