

Abstract
Objective
Posttraumatic Stress Disorder (PTSD) is prevalent among low-income minorities and is associated with poorer health. However, the association between PTSD and hemoglobin A1C (A1C) among patients with diabetes has not been fully described. The objective of this cross-sectional study was to evaluate associations between PTSD and A1C among low-income minorities with diabetes.
Method
Adults with diabetes were recruited from a network of primary care clinics. Data were obtained from surveys and electronic medical records. Lifetime PTSD symptoms were assessed using the Structured Clinical Interview—DSM-IV and depressive symptoms with the Patient Health Questionnaire-9. A1C was obtained from chart review.
Results
Of 103 adults analyzed, 12% had lifetime full PTSD and 12% had subthreshold PTSD. On backward stepwise logistic regression, patients with any PTSD symptoms were significantly more likely to have an A1C >7% compared to patients without symptoms (ORadj 2.98, 95% CI 1.04–8.52, P=.04). An A1C >7% also was associated with an interaction between PTSD symptoms and longer diabetes duration (P<.05).
Conclusion
In this cohort of low-income minorities with diabetes, lifetime PTSD symptoms were significantly associated with an A1C >7%.
Keywords: Posttraumatic stress disorder, Diabetes, Primary care, Minority
1. Introduction
More than 20 million adults in the US have diabetes, and minorities are disproportionately affected with higher prevalence, complications and mortality compared to Caucasians [1]. Studies assessing the role of mental health on these disparities have focused largely on major depression. However, there is growing evidence that posttraumatic stress disorder (PTSD) is also associated with chronic disease and with poorer health outcomes [2,3].
PTSD is an anxiety disorder characterized by persistent and intrusive re-experiencing of a traumatic event, avoidance of reminders of the trauma and highly elevated levels of anxiety, leading to significant functional impairment [4]. Compared to a national lifetime prevalence of 7.8% [5], PTSD occurs at rates of 10 to over 50% in urban primary care settings [2,6,7]. This observation is partly explained by the high prevalence of trauma in poor urban environments, which consistently ranges from 65% to over 80% in both community and primary care settings [2,3,6,8]. Minorities are more likely to be victims of direct assault (e.g., physical and sexual assault) [9,10] and to experience indirect violence (e.g., witnessing assault) compared to Caucasians [11]. Other factors including socioeconomic stress (e.g., poverty and neighborhood instability), lower education, lack of social support and perceived racism are also associated with elevated risk of developing PTSD [2,12–14].
PTSD has been associated with a higher prevalence of diabetes in the general population and with an increased risk of newly reported diabetes among veterans [15,16]. PTSD also predicts increased somatic complaints and doctor visits, poorer perception of health and higher mortality [2,17–19]. Comorbid PTSD and depression has been associated with diabetes-related factors such as higher levels of low-density lipoprotein (LDL) and PTSD symptoms predict metabolic syndrome [20,21]. These associations may be due to indirect behavioral mechanisms (e.g., medication non-adherence or smoking) and/or direct physiological changes (i.e., alterations in the hypothalamic-pituitary-adrenal axis and immune response) associated with PTSD [22,23].
Considering the high prevalence of PTSD and diabetes among low-income minorities and the potential implications in comorbid disease, an assessment of PTSD and diabetes management is needed in this population. Therefore, in this cross-sectional study, we assessed the relationship between PTSD symptoms and glucose control, as reflected by hemoglobin A1C (A1C), in a sample of low-income minorities with diabetes. We hypothesized that patients with diabetes and PTSD symptoms would have poorer glucose control (i.e., higher A1C) compared to those without symptoms.
2. Methods
2.1. Subjects and study design
A convenience sample of men and women was recruited from four community-based primary care clinics within the Renaissance Health Care Network in Harlem New York between April and September 2008. Eligible patients were ≥18 years of age and English speaking, with a diagnosis of Type 1 or Type 2 diabetes in their chart. Exclusion criteria were inability to consent or lack of a primary care physician within the network.
Diabetes patients with a medical visit were identified using an electronic appointment record. When possible, patients were contacted in advance and introduced to the study by telephone. Those who agreed were met by study personnel on the day of their appointment, received additional information and, if willing, were enrolled. Patients also were directed to study personnel by physicians and nursing staff within the medical centers at the time of intake. The survey was completed in a private room with a single researcher conducting all interviews. All questionnaires were read to patients and completed by study personnel to minimize missing data.
Out of 261 patients approached, 218 were eligible, and 110 enrolled. Only one patient with Type 1 diabetes was enrolled; therefore, we excluded this patient from analysis. We also excluded six patients who refused to complete the trauma and/or PTSD questionnaires, yielding 103 patients with Type 2 diabetes analyzed.
The Internal Review Board of Lincoln Medical and Mental Health Center and the New York City Health and Hospitals Corporation Office of Clinical and Health Services Research approved this study. All participants completed a written informed consent and HIPAA form. Participants were not reimbursed for their participation.
2.2. Measures
Information was elicited on demographic characteristics (i.e., age, sex, race/ethnicity, marital status, income, education), illicit drug use and smoking. A Charlson Comorbidity Index Score was calculated through medical chart review as an estimate of the degree of comorbid illness. The score is calculated based on the number and severity of specified conditions including vascular, liver and renal disease, diabetes, cancer and HIV. A higher score corresponds to poorer health and increased mortality risk [24].
2.2.1. PTSD
Lifetime PTSD was assessed using the Structured Clinical Interview–DSM-IV (SCID). The SCID is a semi-structured interview, which includes a single-item trauma screen followed by standardized questions corresponding with the diagnostic categories for PTSD. It is commonly used in clinical research and has been shown to be a reliable and valid measure [25]. Patients were classified as having full PTSD, subthreshold PTSD, minimal symptoms, or none. Full PTSD featured at least one symptom of reexperiencing the event, three symptoms of avoidance and two symptoms of hyperarousal, lasting for at least 1 month and causing clinically significant distress or functional impairment. Consistent with prior studies, subthreshold PTSD was defined as having fewer than the required number of symptoms for full PTSD within each subcategory, but with clinically significant distress or functional impairment [26]. Patients who reported symptoms but did not meet criteria for full or subthreshold PTSD were classified as “Minimal Symptoms.”
2.2.2. Depression
The Patient Health Questionnaire-9 (PHQ-9) was used to screen for depressive symptoms over the past two weeks. Scores were measured continuously and grouped according to standard guidelines with a score of 1–9 corresponding to minimal/mild symptoms and 10 or more, moderate–severe and severe symptoms. A score >10 on the PHQ-9 has a sensitivity of 88% and specificity of 89% for major depression [27].
2.2.3. A1C
As the primary outcome measure, the most recent A1C within 30 days after the interview was collected through chart review. A cutoff of 7% is accepted as a reliable measure of good versus poor glucose control in a wide range of patient populations [28]. A time limit of 30 days from the day of the interview was applied to avoid potentially capturing behavioral changes precipitated by study participation.
2.3. Statistical analysis
All statistical analyses were conducted using STATA/SE 10.0. A P value of <.05 was considered statistically significant. Demographic and clinical characteristics were described by PTSD symptom status and A1C using chi-square and t tests for categorical and continuous variables respectively. Unadjusted odds ratios and P values were calculated for each pair. The final multivariate model was developed using covariates significantly associated with A1C and covariates considered clinically significant to A1C. We also tested for collinearity. This resulted in a model with PTSD as the main covariate of interest as well as depressive symptoms, age, sex, education, income, smoking history, body mass index, medical comorbidity, diabetes duration, insulin and psychiatric medication use. We used backward stepwise regression that initially included all covariates, and set a cutoff of P<.2 to remain in the model. We also tested interactions between PTSD and depressive symptoms, diabetes duration and insulin. We used logistic and linear regression to calculate adjusted odds ratios and P values for A1C as a dichotomous and as a continuous measure, respectively.
Analyses were performed for each level of PTSD symptom severity (i.e., full PTSD, subthreshold PTSD, minimal PTSD symptoms and trauma absent PTSD symptoms); however, this decreased statistical power due to small sample sizes. Therefore, for the purposes of analysis, the PTSD symptom groups were collapsed into two groups, Any PTSD Symptoms (i.e., full PTSD, subthreshold PTSD or minimal PTSD symptoms) versus No PTSD Symptoms (i.e., no trauma or presence of a qualifying trauma with no PTSD symptoms).
3. Results
Out of 261 individuals with diabetes approached, 218 (84%) were eligible and 110 (42%) enrolled. Eligible patients who refused to participate most often cited lack of time (54%). Other reasons were wishing to consult with their doctor or family first, and privacy concerns. They did not differ significantly by age or gender from those who enrolled. Six patients were excluded from analysis because they declined the trauma and/or PTSD screen and they were more likely to have used illicit substances compared to those who completed the entire survey (67% versus 27%, P=.04). Only one patient had Type 1 diabetes and was excluded from analysis, leaving 103 patients with Type 2 diabetes analyzed.
Demographic and clinical characteristics of the sample are shown in Table 1. The mean age was 60 ± 12 years. Most were female (70%), self-identified as Black Non-Hispanic (91%), did not have a high school diploma (56%) and earned ≤$20,000 per year (83%). The mean diabetes duration was 11 ± 9 years, and the median A1C was 7.0% (interquartile range 6.4–8.2) with 41% on insulin. Thirty four percent reported depressive symptoms over the past two weeks, and 18% were on a psychiatric medication. Nearly half reported a smoking history, and 27% had used illicit substances (i.e., marijuana, cocaine, or heroin).
Table 1.
Demographic and clinical characteristics of study participants with Type 2 diabetes by PTSD status
| Variable | Total Sample | No PTSD symptoms | PTSD symptoms | P |
|---|---|---|---|---|
| n (%) | 103 | 72 (70) | 31 (30) | |
| Age in years, mean (S.D.) | 60 (12) | 61 (12) | 58 (10) | .20 |
| Age in years | ||||
| ≤49 | 17 (17) | 13 (18) | 4 (13) | .02 |
| 50–64 | 48 (47) | 27 (38) | 21 (68) | |
| ≥65 | 38 (37) | 32 (44) | 6 (19) | |
| Female | 72 (70) | 50 (69) | 22 (71) | .88 |
| Black non-Hispanic | 94 (91) | 67 (93) | 27 (87) | .45 |
| Married/significant other | 27 (26) | 19 (26) | 8 (26) | .95 |
| Less than high school diploma | 58 (56) | 41 (57) | 17 (55) | .84 |
| Annual income* | ||||
| 0–$9,999 | 45 (44) | 32 (44) | 13 (42) | .10 |
| 10,000–20,000 | 40 (39) | 31 (43) | 9 (29) | |
| >$20,000 | 18 (17) | 9 (13) | 9 (29) | |
| A1C, median (IQR) | 7 (6.4-8.2) | 6.9 (6.3-8.1) | 7.3 (6.7-8.6) | .03 |
| A1C >7% | 51 (50) | 30 (42) | 21 (68) | .01 |
| Years with diabetes, mean (S.D.) | 11 (9) | 11 (9) | 13 (10) | .15 |
| Years with diabetes | ||||
| ≤4 | 23 (22) | 18 (25) | 5 (16) | .65 |
| 5–10 | 37 (36) | 25 (35) | 12 (39) | |
| >10 | 43 (42) | 29 (40) | 14 (45) | |
| Insulin use | 42 (41) | 26 (36) | 16 (52) | .14 |
| Body mass index, kg/m2, mean (S.D.) | 33.5 (8.2) | 32.9 (7.7) | 34.8 (9.4) | .30 |
| Body mass index, kg/m2 | ||||
| 18.5–24.9, normal weight | 6 (6) | 5 (7) | 1 (3) | .16 |
| 25–29.9, overweight | 32 (31) | 26 (36) | 6 (!9) | |
| 30–39.9, obese | 49 (48) | 29 (40) | 20 (65) | |
| ≥40, extreme obesity | 16 (16) | 12 (17) | 4 (13) | |
| Charlson Comorbidity Index score, mean (S.D.) | 2 (1) | 1.9 (1) | 2.4 (1.5) | .047 |
| Charlson Comorbidity Index score | ||||
| 1–1.9 | 39 (38) | 30 (42) | 9 (29) | .24 |
| 2–2.9 | 41 (40) | 29 (40) | 12 (39) | |
| ≥3 | 23 (22) | 13 (18) | 10 (32) | |
| Depressive symptoms | ||||
| None | 68 (66) | 54 (75) | 14 (45) | .01 |
| Minimal/mild | 23 (22) | 12 (17) | 11 (35) | |
| Moderate/severe | 12 (12) | 6 (8) | 6 (19) | |
| Psychiatric medication | 19 (18) | 9 (13) | 10 (32) | .02 |
| Lifetime smoking history | 50 (49) | 35 (49) | 15 (48) | .98 |
| Lifetime illicit substance use | 28 (27) | 20 (28) | 8 (26) | .84 |
| Any lifetime trauma | 81 (79) | 50 (69) | 31 (100) | .001 |
| Any PTSD symptoms | 31 (30) | — | — | |
| Minimal symptoms | 7 (7) | — | 7 (23) | |
| Subthreshold PTSD | 12 (12) | — | 12 (39) | |
| Full PTSD | 12 (12) | — | 12 (39) | |
Data are n (%) unless otherwise stated. Column percentages may not add up to 100 due to rounding IQR, interquartile range.
Three refusals, n=100.
3.1. PTSD Symptoms
Most patients reported at least one trauma (79%) with childhood physical abuse (22%) and death of a child (18%) most common (data not shown). Twenty four percent of patients had lifetime full or subthreshold PTSD. Table 1 also shows characteristics of the sample by PTSD status. PTSD symptoms were significantly associated with an A1C >7% (68% versus 42%, P=.01). The median A1C was significantly higher for patients with PTSD symptoms compared to none (7.3% versus 6.9%, P=.03). There was a similar pattern within each PTSD symptom category however these associations did not reach statistical significance (Fig. 1). Patients with PTSD symptoms also were more likely to have depressive symptoms (54% versus 25%, P=.01), to be on a psychiatric medication (32% versus 13%, P=.02) and to have a higher Charlson Comorbidity Index Score (2.4±1.5 versus 1.9±1, P=.047).
Fig. 1.
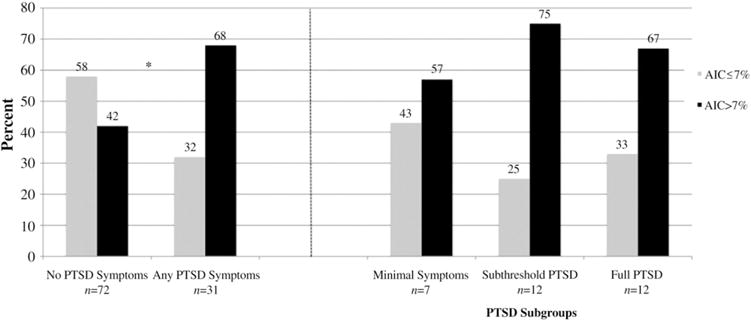
Proportion of patients with A1C ≤7% and >7% according to overall PTSD symptom status and PTSD subgroup. *Overall patients with any PTSD symptoms were significantly more likely to have an A1C >7% compared to those without symptoms, P=.014.
3.2. Factors associated with A1C level
In addition to the association with PTSD symptoms, patients with an A1C >7% had diabetes longer (15± 10 years versus 8±7 years, P=.0001), were more likely to be on insulin (65% versus 17%, P<.0001) and had a significantly higher Charlson Comorbidity Index Score (2.3±1.3 versus 1.8±1.0, P=.03) compared to patients with an A1C ≤7%. Unadjusted odds ratios for each covariate are shown in Table 2.
Table 2.
Unadjusted analysis of associations between sociodemographic and clinical factors and A1C >7% among study participants with Type 2 diabetes
| Variable | Unadjusted OR (95% CI) | P |
|---|---|---|
| Age in years | ||
| ≤49 | ref | |
| 50–64 | 2.57 (0.81–8.09) | .11 |
| ≥65 | 1.48 (0.45–4.84) | .51 |
| Female | 0.78 (0.33–1.81) | .56 |
| Black non-Hispanic | 0.77 (0.19–3.03) | .71 |
| Married/significant other | 0.76 (0.31–1.83) | .54 |
| Less than high school diploma | 0.76 (0.35–1.66) | .50 |
| Annual income | ||
| 0–$9,999 | ref | |
| 10,000–20,000 | 1.02 (0.43–2.41) | .96 |
| >$20,000 | 3.25 (0.99–10.65) | .05 |
| Years with diabetes | ||
| ≤4 | Ref | |
| 5–10 | 2.16 (0.69–6.72) | .18 |
| >10 | 5.87 (1.90–18.14) | .002 |
| Insulin use | 8.76 (3.49–21.97) | <.0001 |
| Body mass index, kg/m2 | ||
| 18.5–24.9, normal weight | ref | |
| 25–29.9, overweight | 5 (0.52–47.73) | .16 |
| 30–39.9, obese | 6.67 (0.72–61.40) | .09 |
| ≥40, extreme obesity | 3 (0.28–32.21) | .36 |
| Charlson Comorbidity Index score | ||
| 1–1.9 | ref | |
| 2–2.9 | 2.82 (1.14–7.02) | .03 |
| ≥ 3 | 3.11 (1.07–9.07) | .04 |
| Depressive symptoms | ||
| None | ref | |
| Minimal/mild | 2.38 (0.89–6.34) | .08 |
| Moderate/severe | 1.27 (0.37–4.33) | .71 |
| Psychiatric medication | 1.98 (0.71–5.52) | .19 |
| Lifetime smoking history | 1.21 (0.56–2.63) | .62 |
| Lifetime illicit substance use | 0.69 (0.29–1.66) | .41 |
| Any PTSD symptoms | 2.94 (1.21–7.14) | .02 |
Table 3 shows results of the backward stepwise logistic regression where the initial model included lifetime PTSD symptoms, depressive symptoms, age, sex, education, income, smoking, body mass index, medical comorbidity, diabetes duration, insulin and psychiatric medication, and the cutoff was P<.2 to remain in the model. In the main effects model, lifetime PTSD symptoms were significantly associated with an A1C >7% (ORadj 2.98, 95% CI 1.04–8.52, P=.04). Other factors independently associated with an A1C >7% were longer diabetes duration and insulin use.
Table 3.
Results of backward stepwise logistic regression evaluating factors associated with A1C >7% in study participants with type 2 diabetes
| Variable | Adjusted odds ratio | CI | P |
|---|---|---|---|
| PTSD Symptoms | 2.98 | 1.04–8.52 | .04 |
| Insulin | 7.91 | 2.82–22.13 | <.0001 |
| Diabetes 5–10 years | 2.96 | 0.71–12.25 | .13 |
| Diabetes >10 years | 4.64 | 1.15–18.67 | .03 |
| Charlson Comorbidity Score 2–2.9 | 2.60 | 0.94–7.18 | .06 |
Full model included PTSD symptoms, depressive symptoms, age, sex, education, income, duration of diabetes, insulin use, body mass index, Charlson Comorbidity Score, use of psychiatric medications and lifetime smoking. A cutoff of P<.2 was used to remain in the model.
Overall, there also was a significant interaction between PTSD symptoms and diabetes duration where the association between PTSD and A1C was greater for patients with diabetes longer (ORadj 1.39, 95% CI 1.02–1.90, P=.04). This relationship is illustrated in Fig. 2. There was not a significant interaction between PTSD symptoms and depressive symptoms (ORadj 0.94, 95% CI 0.75–1.17, P=.57) or insulin use (ORadj 1.52, 95% CI 0.12–19.20, P=.75). Patients within each PTSD symptom category (i.e., minimal, subthreshold and full PTSD) also were more likely to have an A1C >7% compared to patients without PTSD symptoms however these associations were not statistically significant. There also were no statistically significant associations for A1C as a continuous measure on multivariate analysis. A1C was not associated with depressive symptoms for depression as a categorical or continuous measure.
Fig. 2.
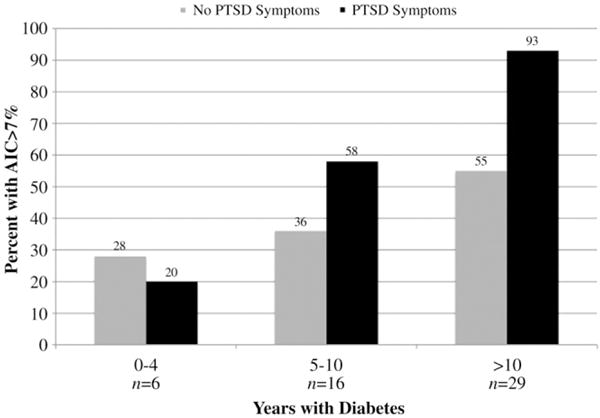
Interaction between PTSD symptoms and diabetes duration. Overall an A1C >7% was associated with an interaction between PTSD symptoms and longer diabetes duration, P<.05.
4. Discussion
In this cohort of low-income minorities with Type 2 diabetes, our results demonstrated that patients with lifetime PTSD symptoms were significantly more likely to have an A1C >7% compared to patients without symptoms, even after adjusting for clinical and demographic factors known to affect A1C. The median A1C also was significantly higher for patients with PTSD on unadjusted analysis. To our knowledge, associations between A1C and PTSD symptoms have not been explored previously in this population. Most studies have focused on military populations and we found only one that evaluated associations between PTSD and A1C. Trief et al. assessed glucose and cholesterol levels in male veterans with PTSD. PTSD did not independently predict A1C; however, veterans with comorbid PTSD and depression had higher cholesterol and LDL compared to patients with depression alone [20]. In a separate study of male and female veterans, increasing degree of PTSD symptoms predicted metabolic syndrome [21]. Although indirect, as metabolic syndrome is a risk factor for diabetes [29], these findings provide a foundation for further investigating the association between PTSD and diabetes.
We also found that like full PTSD, subthreshold PTSD was associated with an A1C >7%, though not statistically significant likely due to sample size. This finding is consistent with other studies demonstrating that morbidity associated with subthreshold PTSD matches full PTSD on measures such as obesity, substance use, negative health perceptions and suicidality [17,26,30]. It suggests that PTSD symptoms may be associated with poorer glucose control even if patients do not meet full diagnostic criteria. Surprisingly, although depressive symptoms were significantly associated with PTSD as expected [6,20], they were not associated with an A1C >7%. Although depression is often associated with poorer diabetes management [31–34], some studies have had contrary findings [35,36]. Diabetes-specific distress has been suggested as an alternative to depression as a risk factor for poor glucose control and this unmeasured factor may have affected our findings [37,38]. Our results also suggest that although depression and PTSD are often comorbid they should be considered separately. It should be noted, however, that we assessed active depressive symptoms (i.e., over the past 2 weeks) versus lifetime PTSD. Screening for lifetime major depressive disorder may have yielded different results.
Contrary to other studies, PTSD was not associated with smoking or illicit substance use [23]. A1C also was not associated with these behaviors, which we postulated as a mechanism for poor glucose control in patients with PTSD. Measuring degree of use and current use may have yielded different results. It is also possible that other unmeasured maladaptive behaviors associated with PTSD (e.g., alcohol misuse, medication non-adherence) contributed to the outcomes in this study [23]. Additionally, physiological changes associated with PTSD like alterations in the hypothalamic-pituitary-adrenal axis, increased sensitivity of glucocorticoid receptors and increased inflammation as indicated by elevations in markers like c-reactive protein also may have affected A1C [22,39].
There also was an interaction between PTSD symptoms and diabetes duration; the association between PTSD and A1C was greater for patients who had diabetes longer. One possible explanation is an increased vulnerability to behavioral or physiological changes described [22,39] as the duration of diabetes increases.
4.1. Limitations
Our study had several limitations. The sample was small and only one patient had Type 1 diabetes; therefore, we could not stratify by diabetes subtype. Although eligible enrolled and non-enrolled patients were similar in age and sex, we could not compare study participants to the larger clinic population. The sample also may have been biased towards a higher frequency of PTSD, as patients with psychiatric symptoms visit the doctor more often than the general population [17]. Additionally, Hispanic patients were underrepresented, likely because this sample was limited to English-speaking patients. Hispanics have been shown to have greater frequency and severity of PTSD compared to blacks and Caucasians [40]. Therefore, the percentage of patients with PTSD may have been under-estimated. We also did not separate groups by current or past PTSD, nor did we assess the timing of PTSD relative to diabetes onset. Thus, patients with active symptoms could have driven results and we could not establish causality. Finally, measured maladaptive behaviors were limited to lifetime smoking and substance use and did not include degree of activity or alcohol use.
4.2. Conclusion
This study demonstrated that lifetime PTSD symptoms were associated with an A1C >7% independent of sociodemographic and clinical factors known to affect glucose levels. Despite its high prevalence, PTSD is often unrecognized in primary care [2]. Our findings suggest that physicians might consider PTSD as a potential factor in poorer glucose control in low-income patients with diabetes. Future research should investigate the mechanisms underlying this association. Prospective studies also are needed to establish causality, and to determine if treating PTSD symptoms improves diabetes outcomes in this population.
Acknowledgments
This research was supported by grant 5 T32 HS000066 from the Agency for Healthcare Research and Quality, and by the CTSA Grant UL1 RR025750 from the National Center for Research Resources (NCRR), part of the National Institutes of Health (NIH), and NIH roadmap for Medical Research. Its contents are solely the responsibility of the authors and do not necessarily represent the official view of the NCRR or NIH. The authors wish to thank Dr. Martin Wells, Dr. Mimi Kim and Dr. Ellie Schoenbaum for their contributions to the statistical analysis. We also wish to thank the Work-in-Progress Group in the Division of General Internal Medicine at Montefiore Medical Center, and the Renaissance Health Care Network.
References
- 1.Centers for Disease Control and Prevention. National diabetes fact sheet: general information and national estimates on diabetes in the United States 2007. Atlanta, GA: U.S. Department of Health and Human Services, Centers for Disease Control and Prevention; 2008. [Google Scholar]
- 2.Liebschutz J, Saitz R, Brower V, et al. PTSD in urban primary care: high prevalence and low physician recognition. J Gen Intern Med. 2007;22:719–26. doi: 10.1007/s11606-007-0161-0. [DOI] [PMC free article] [PubMed] [Google Scholar]
- 3.Gill JM, Page GG, Sharps P, et al. Experiences of traumatic events and associations with PTSD and depression development in urban health care-seeking women. J Urban Health. 2008;85:693–706. doi: 10.1007/s11524-008-9290-y. [DOI] [PMC free article] [PubMed] [Google Scholar]
- 4.American Psychiatric Association. Diagnostic and Statistical Manual of Mental Disorders. 4. Washington (DC): American Psychiatric Association; 1994. [Google Scholar]
- 5.Kessler RC, Sonnega A, Bromet E, et al. Posttraumatic stress disorder in the National Comorbidity Survey. Arch Gen Psychiatry. 1995;52:1048–60. doi: 10.1001/archpsyc.1995.03950240066012. [DOI] [PubMed] [Google Scholar]
- 6.Alim TN, Graves E, Mellman TA, et al. Trauma exposure, posttraumatic stress disorder and depression in an African-American primary care population. J Natl Med Assoc. 2006;98:1630–6. [PMC free article] [PubMed] [Google Scholar]
- 7.Breslau N, Kessler RC, Chilcoat HD, et al. Trauma and posttraumatic stress disorder in the community: the 1996 Detroit Area Survey of Trauma. Arch Gen Psychiatry. 1998;55:626–32. doi: 10.1001/archpsyc.55.7.626. [DOI] [PubMed] [Google Scholar]
- 8.Gillespie CF, Bradley B, Mercer K, et al. Trauma exposure and stress-related disorders in inner city primary care patients. Gen Hosp Psychiatry. 2009;31:505–14. doi: 10.1016/j.genhosppsych.2009.05.003. [DOI] [PMC free article] [PubMed] [Google Scholar]
- 9.Fox JA, Zawitz MW. Homicide trends in the United States. 2007 Available at: http://bjs.ojp.usdoj.gov/index.cfm?ty=pbdetail&iid=966 Accessed April 19, 2010.
- 10.Norman SB, Means-Christensen AJ, Craske MG, et al. Associations between psychological trauma and physical illness in primary care. J Trauma Stress. 2006;19:461–70. doi: 10.1002/jts.20129. [DOI] [PubMed] [Google Scholar]
- 11.Alim TN, Charney DS, Mellman TA. An overview of posttraumatic stress disorder in African Americans. J Clin Psychol. 2006;62:801–13. doi: 10.1002/jclp.20280. [DOI] [PubMed] [Google Scholar]
- 12.DeJonghe ES, Bogat GA, Levendosky AA, et al. Women survivors of intimate partner violence and post-traumatic stress disorder: prediction and prevention. J Postgrad Med. 2008;54:294–300. doi: 10.4103/0022-3859.41435. [DOI] [PubMed] [Google Scholar]
- 13.Kuruvilla A, Jacob KS. Poverty, social stress & mental health. Indian J Med Res. 2007;126:273–8. [PubMed] [Google Scholar]
- 14.Breslau N. Epidemiologic studies of trauma, posttraumatic stress disorder, and other psychiatric disorders. Can J Psychiatry. 2002;47:923–9. doi: 10.1177/070674370204701003. [DOI] [PubMed] [Google Scholar]
- 15.Boyko EJ, Jacobson IG, Smith B, et al. Risk of diabetes in U.S. military service members in relation to combat deployment and mental health. Diabetes Care. 2010;33:1771–7. doi: 10.2337/dc10-0296. [DOI] [PMC free article] [PubMed] [Google Scholar]
- 16.Goodwin RD, Davidson JR. Self-reported diabetes and posttraumatic stress disorder among adults in the community. Prev Med. 2005;40:570–4. doi: 10.1016/j.ypmed.2004.07.013. [DOI] [PubMed] [Google Scholar]
- 17.Gillock KL, Zayfert C, Hegel MT, et al. Posttraumatic stress disorder in primary care: prevalence and relationships with physical symptoms and medical utilization. Gen Hosp Psychiatry. 2005;27:392–9. doi: 10.1016/j.genhosppsych.2005.06.004. [DOI] [PubMed] [Google Scholar]
- 18.Boscarino JA. Posttraumatic stress disorder and physical illness: results from clinical and epidemiologic studies. Ann N Y Acad Sci. 2004;1032:141–53. doi: 10.1196/annals.1314.011. [DOI] [PubMed] [Google Scholar]
- 19.Lauterbach D, Vora R, Rakow M. The relationship between posttraumatic stress disorder and self-reported health problems. Psychosom Med. 2005;67:939–47. doi: 10.1097/01.psy.0000188572.91553.a5. [DOI] [PubMed] [Google Scholar]
- 20.Trief PM, Ouimette P, Wade M, et al. Post-traumatic stress disorder and diabetes: co-morbidity and outcomes in a male veterans sample. J Behav Med. 2006;29:411–8. doi: 10.1007/s10865-006-9067-2. [DOI] [PubMed] [Google Scholar]
- 21.Heppner PS, Crawford EF, Haji UA, et al. The association of posttraumatic stress disorder and metabolic syndrome: a study of increased health risk in veterans. BMC Med. 2009;7:1. doi: 10.1186/1741-7015-7-1. [DOI] [PMC free article] [PubMed] [Google Scholar]
- 22.Yehuda R. Biology of posttraumatic stress disorder. J Clin Psychiatry. 2001;62(Suppl 17):41–6. [PubMed] [Google Scholar]
- 23.Breslau N, Davis GC, Schultz LR. Posttraumatic stress disorder and the incidence of nicotine, alcohol, and other drug disorders in persons who have experienced trauma. Arch Gen Psychiatry. 2003;60:289–94. doi: 10.1001/archpsyc.60.3.289. [DOI] [PubMed] [Google Scholar]
- 24.Charlson ME, Pompei P, Ales KL, et al. A new method of classifying prognostic comorbidity in longitudinal studies: development and validation. J Chronic Dis. 1987;40:373–83. doi: 10.1016/0021-9681(87)90171-8. [DOI] [PubMed] [Google Scholar]
- 25.Ventura J, Liberman RP, Green MF, et al. Training and quality assurance with the Structured Clinical Interview for DSM-IV (SCID-I/P) Psychiatry Res. 1998;79:163–73. doi: 10.1016/s0165-1781(98)00038-9. [DOI] [PubMed] [Google Scholar]
- 26.Zlotnick C, Franklin CL, Zimmerman M. Does “subthreshold” posttraumatic stress disorder have any clinical relevance? Compr Psychiatry. 2002;43:413–9. doi: 10.1053/comp.2002.35900. [DOI] [PubMed] [Google Scholar]
- 27.Kroenke K, Spitzer RL, Williams JB. The PHQ-9: validity of a brief depression severity measure. J Gen Intern Med. 2001;16:606–13. doi: 10.1046/j.1525-1497.2001.016009606.x. [DOI] [PMC free article] [PubMed] [Google Scholar]
- 28.Standards of medical care in diabetes-2008. Diabetes Care. 2008;31(Suppl 1):S12–54. doi: 10.2337/dc08-S012. [DOI] [PubMed] [Google Scholar]
- 29.Haffner SM, Valdez RA, Hazuda HP, et al. Prospective analysis of the insulin-resistance syndrome (syndrome X) Diabetes. 1992;41:715–22. doi: 10.2337/diab.41.6.715. [DOI] [PubMed] [Google Scholar]
- 30.Marshall RD, Olfson M, Hellman F, et al. Comorbidity, impairment, and suicidality in subthreshold PTSD. Am J Psychiatry. 2001;158:1467–73. doi: 10.1176/appi.ajp.158.9.1467. [DOI] [PubMed] [Google Scholar]
- 31.Gonzalez JS, Peyrot M, McCarl LA, et al. Depression and diabetes treatment nonadherence: a meta-analysis. Diabetes Care. 2008;31:2398–403. doi: 10.2337/dc08-1341. [DOI] [PMC free article] [PubMed] [Google Scholar]
- 32.Gary TL, Crum RM, Cooper-Patrick L, et al. Depressive symptoms and metabolic control in African-Americans with Type 2 diabetes. Diabetes Care. 2000;23:23–9. doi: 10.2337/diacare.23.1.23. [DOI] [PubMed] [Google Scholar]
- 33.Subramaniam M, Sum CF, Pek E, et al. Comorbid depression and increased health care utilisation in individuals with diabetes. Gen Hosp Psychiatry. 2009;31:220–4. doi: 10.1016/j.genhosppsych.2009.01.001. [DOI] [PubMed] [Google Scholar]
- 34.Egede LE, Ellis C, Grubaugh AL. The effect of depression on self-care behaviors and quality of care in a national sample of adults with diabetes. Gen Hosp Psychiatry. 2009;31:422–7. doi: 10.1016/j.genhosppsych.2009.06.007. [DOI] [PubMed] [Google Scholar]
- 35.Heckbert SR, Rutter CM, Oliver M, et al. Depression in relation to long-term control of glycemia, blood pressure, and lipids in patients with diabetes. J Gen Intern Med. 2010;25:524–9. doi: 10.1007/s11606-010-1272-6. [DOI] [PMC free article] [PubMed] [Google Scholar]
- 36.Georgiades A, Zucker N, Friedman KE, et al. Changes in depressive symptoms and glycemic control in diabetes mellitus. Psychosom Med. 2007;69:235–41. doi: 10.1097/PSY.0b013e318042588d. [DOI] [PubMed] [Google Scholar]
- 37.Fisher L, Glasgow RE, Strycker LA. The relationship between diabetes distress and clinical depression with glycemic control among patients with Type 2 diabetes. Diabetes Care. 2010;33:1034–6. doi: 10.2337/dc09-2175. [DOI] [PMC free article] [PubMed] [Google Scholar]
- 38.Fisher L, Mullan JT, Arean P, et al. Diabetes distress but not clinical depression or depressive symptoms is associated with glycemic control in both cross-sectional and longitudinal analyses. Diabetes Care. 2010;33:23–8. doi: 10.2337/dc09-1238. [DOI] [PMC free article] [PubMed] [Google Scholar]
- 39.Spitzer C, Barnow S, Volzke H, et al. Association of posttraumatic stress disorder with low-grade elevation of C-reactive protein: evidence from the general population. J Psychiatr Res. 2010;44:15–21. doi: 10.1016/j.jpsychires.2009.06.002. [DOI] [PubMed] [Google Scholar]
- 40.Pole N, Best SR, Metzler T, et al. Why are hispanics at greater risk for PTSD? Cultur Divers Ethnic Minor Psychol. 2005;11:144–61. doi: 10.1037/1099-9809.11.2.144. [DOI] [PubMed] [Google Scholar]