Abstract
Introduction
In small trials, randomization can fail, leading to differences in patient characteristics across treatment arms, a risk that can be reduced by stratifying using key confounders. In ALS trials, riluzole use (RU) and bulbar onset (BO) have been used for stratification. We hypothesized that randomization could be improved by using a multifactorial prognostic score of predicted survival as a single stratifier.
Methods
We defined a randomization failure as a significant difference between treatment arms on a characteristic. We compared randomization failure rates when stratifying for RU and BO (“traditional stratification”) to failure rates when stratifying for predicted survival using a predictive algorithm. We simulated virtual trials using the PRO‐ACT database without application of a treatment effect to assess balance between cohorts. We performed 100 randomizations using each stratification method – traditional and algorithmic. We applied these stratification schemes to a randomization simulation with a treatment effect using survival as the endpoint and evaluated sample size and power.
Results
Stratification by predicted survival met with fewer failures than traditional stratification. Stratifying predicted survival into tertiles performed best. Stratification by predicted survival was validated with an external dataset, the placebo arm from the BENEFIT‐ALS trial. Importantly, we demonstrated a substantial decrease in sample size required to reach statistical power.
Conclusions
Stratifying randomization based on predicted survival using a machine learning algorithm is more likely to maintain balance between trial arms than traditional stratification methods. The methodology described here can translate to smaller, more efficient clinical trials for numerous neurological diseases.
Keywords: clinical trial stratification, trial methodology predictive analytics
Introduction
Amyotrophic lateral sclerosis (ALS) is a neurodegenerative disease affecting primarily motor neurons, causing progressive weakness and ultimately death. Until recently, riluzole had been the only FDA‐approved medication for disease modification,1, 2, 3 and though many symptomatic therapies exist, there is an urgent need for disease‐modifying ALS therapeutic development. Given the relative rarity of ALS, the ALS clinical trial landscape is dominated by small Phase 2 trials. Large Phase 3 trials are less common, and even these are generally small (n = 500–1000) relative to trials in common medical diseases.
These relatively diminutive ALS trials pose numerous well‐trodden statistical challenges – one ubiquitous risk to the validity of trial results is the risk of confounding due to imbalances in baseline characteristics between treatment arms. Successful randomization – even distribution of baseline characteristics between study arms – reduces or eliminates the threat of confounding.4, 5, 6 Stratified randomization is designed to reduce the likelihood of imbalanced trial arms by evenly separating a trial sample between treatment arms based on prespecified prognostic variables. While stratified randomization is an effective means of reducing imbalances within the chosen variables, the methodology is not designed to reduce imbalance among other variables, prognostic or otherwise.4 In ALS, two commonly used baseline characteristics for stratification are riluzole use (RU) and bulbar onset (BO) (e.g., 7, 8, 9). While imbalances in other baseline characteristics could lead to confounding, stratification on numerous variables is cumbersome, at best, and can be counter‐productive.10
We hypothesized that stratified randomization in ALS trials could be improved by using predicted survival as a single stratifier. In theory, the algorithmic stratification method should help maintain balance among all prognostic variables used in the training of the predictive model. We further hypothesized that we could optimize stratification using predicted survival by comparing two or three balanced quantiles as strata. We aimed to compare randomization failure rates (defined as statistically significant differences between trial arms on baseline characteristics) stratified by RU and BO (“traditional stratification”) to randomization stratified by log‐likelihood predicted survival in simulated trials using the Pooled Resource Open‐Access ALS Clinical Trials Database (PRO‐ACT) database.11, 12, 13 Additionally, we hypothesized that predicted survival strata defined a priori using PRO‐ACT and applied to a virtual trial from an external dataset would result in a lower rate of randomization imbalance than traditional randomization. We used the placebo arm of the BENEFIT‐ALS trial of tirasemtiv (not included in PRO‐ACT, 14, ClinicalTrials.gov identifier NCT01709149, completed in March 2014) as the external validation dataset. Finally, we provide evidence that adequate statistical power for a clinical trial can be achieved with a smaller sample size by applying this stratified randomization scheme in a power simulation using survival as the simulated endpoint.
Materials and Methods
Training data
Data used in training the predictive model described in this report were obtained from the PRO‐ACT database in January 2016. At the time, PRO‐ACT contained greater than 10,700 fully de‐identified unique longitudinal clinical patient records from 23 late stage (Phase II and III) industry and academic ALS clinical trials.15 The database of over 10 million data points includes demographic, laboratory and medical data, survival and family histories.
Survival prediction model: gradient boosting machine model
All records (n = 4482, including 1450 deaths) that included a baseline forced vital capacity (FVC) and either the original ALSFRS scale16 or the revised ALSFRS (ALSFRS‐R, 17) were used for predicted survival model training and internal validation. A Cox proportional hazards model was used as the loss function to train a gradient boosting machine (GBM) learning model.18, 19 The prediction term (output of the algorithm) was a log‐likelihood coefficient. This coefficient, the log‐likelihood of survival, denotes predicted survival and was used to rank‐order patients for stratification. The tuning parameters for the GBM model were empirically derived via an internal cross‐validation strategy and include the following key parameters: Number of trees = 500, Interaction Depth = 6, and Shrinkage = 0.01. The predicted survival model included the following variables: baseline total ALSFRS‐R and calculated ALSFRS‐R slope (calculated by assuming the patient was symptom free the day prior to reported disease onset), ALSFRS‐R subscores, time since disease onset (defined by weakness), time since diagnosis, baseline FVC, baseline weight, age, bulbar/limb onset, study arm, gender, and riluzole use. To simulate screening for a clinical trial, the model was trained using data from the initial baseline visit only. Data cleaning procedures included examining all features for consistent standard units within the database and imputation of missing values using the sample mean value for continuous variables or the most frequent value for categorical variables. The 48‐point ALSFRS‐R and 40 point ALSFRS scales were harmonized to 48 points by tripling the single respiratory score of the ALSFRS scale. A relatively simple approach to data imputation was chosen to both simplify the procedure of data cleaning and to align with previous methods for generating actionable models.11
Model performance was assessed using receiver operating characteristic (ROC) curves to evaluate the true versus false positive rate of predicted versus observed survival at 12 months. The ROC‐based evaluation was repeated for the entire sample using a tenfold cross‐validation approach consisting of mutually exclusive independent samples to generate an average ROC curve with standard deviations. A representative population was selected and divided into three strata based on predicted survival tertiles. The Kaplan–Meier curves for each of these strata were plotted and the predicted survival curve for each group was overlaid to evaluate both the calibration and discrimination characteristics of the model.
Generation of pools from eligible records (Fig. 1)
Figure 1.
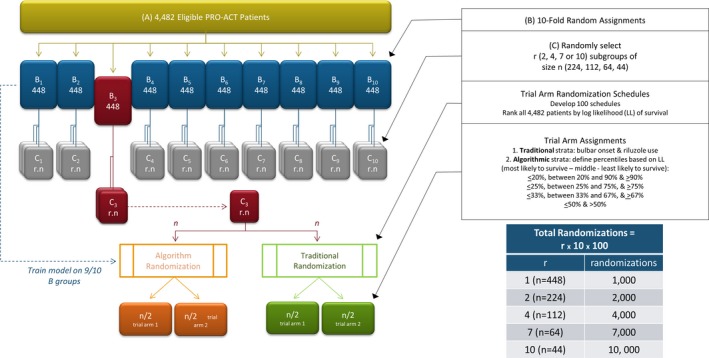
Experimental approach to testing trial randomization schemes.
The 4482 eligible records were first randomly assigned to one of ten nonoverlapping pools of approximately 448 records. For each pool, records from the nine other pools were used to train the survival prediction model. The model was then used to predict survival for every member of the pool. Once predictions for all eligible records from the ten pools were made, the 4482 records were rank‐ordered by predicted survival (expressed as log‐likelihood) and used to estimate the cutoffs for the quantiles to apply to subsequent stratifications.
Next, virtual trial populations of various sizes were derived from the ten n = 448 record pools. Each of the 448‐patient pools was randomly subdivided into 2, 4, 7, or 10 nonoverlapping trial populations per pool, each of which contained approximately 224, 112, 64, or 44 patient records, respectively. To simulate the probability of imbalance seen in small trial populations, we did not use bootstrapping or data resampling with replacement. Each trial population was subsequently subjected to numerous iterative in silico randomizations using the two stratification schemes.
Generation of randomization schedules
One hundred independent randomization schedules were developed and used to perform iterative randomizations on each virtual trial. With 100 randomizations per virtual trial, a total of one, two, four, seven, or ten thousand randomizations, were performed for trial sizes of 448, 224, 112, 64, or 44, respectively.
Application of stratification schemes
Traditional strata were defined using riluzole use (yes/no) and bulbar versus limb onset. Predicted survival strata were defined using the rank‐ordered log‐likelihood of predicted survival to divide the population into quantiles. The most effective quantile was identified by comparing the performance of four quantiles: (1) ≤20th, >20 to <90th, and ≥90th percentiles; (2) ≤25th, >25 to <75th, and ≥75th percentiles; (3) ≤33rd, >33 to <66th, and ≥66th percentiles; and (4) ≤50th and >50th percentile. Idealized representations of the distribution of patients based on randomizations performed using either traditional or algorithmic randomizations are depicted in Tables 1 and 2.
Table 1.
Traditional stratification
| Treatment arm | Placebo arm | |||
|---|---|---|---|---|
| Riluzole use | No riluzole | Riluzole use | No riluzole | |
| Bulbar onset | 24 | 16 | 24 | 16 |
| Limb onset | 46 | 14 | 46 | 14 |
A theoretical, idealized traditional stratification of a 200‐subject study using riluzole use and bulbar onset as stratifiers, assuming 80% riluzole use and 30% bulbar onset in the study population.
Table 2.
Predicted Survival Stratification
| Treatment arm | Placebo arm | ||||||
| Predicted survival percentile | Predicted survival percentile | ||||||
| ≤20th | >20th to <90th | ≥90th | ≤20th | >20th to <90th | ≥90th | ||
| 20 | 70 | 10 | 20 | 70 | 10 | ||
| treatment arm | Placebo arm | ||||||
| Predicted survival percentile | Predicted survival percentile | ||||||
| ≤25th | >25th to <75th | ≥75th | ≤25th | >25th to <75th | ≥75th | ||
| 25 | 50 | 25 | 25 | 50 | 25 | ||
| Treatment arm | Placebo arm | ||||||
| Predicted survival percentile | Predicted survival percentile | ||||||
| ≤33rd | >33rd to <66th | ≥66th | ≤33rd | >33rd to <66th | ≥66th | ||
| 33 | 34 | 33 | 33 | 34 | 33 | ||
| Treatment arm | Placebo arm | ||||||
| Predicted survival percentile | Predicted survival percentile | ||||||
| ≤50th | >50th | ≤50th | >50th | ||||
| 50 | 50 | 50 | 50 | ||||
A theoretical, idealized traditional stratification scheme of a 200‐subject study using predicted survival as a single stratifier and dividing strata at different percentiles.
Comparison of the stratification schemes
Randomization imbalance was defined as statistically significant differences (P < 0.05) between the two trial arms on any given subject characteristic. We used the t‐test for continuous variables and the chi‐square test for categorical values. The objective of the imbalance testing was to understand which variable(s) drives the observed improvement in statistical power. Because strata choice may have been that driving variable, we chose not to correct for strata in the imbalance testing. Since baseline parameters and demographics are key to evaluating the effectiveness of randomization in trials, we focused first on these characteristics, including FVC, ALSFRS‐R, time since symptom onset, time since diagnosis, age, weight and gender. In addition, we calculated randomization imbalances of the stratification variables themselves (log‐likelihood, riluzole use, and bulbar onset).
We also took advantage of the fact that this is a retrospective analysis with known outcomes. In these virtual trials, successful randomization should produce balanced outcomes between trial arms. We focused on outcome parameters frequently used as primary endpoints in ALS clinical trials, including change in FVC, slope of percent predicted FVC, time‐to‐death, slope of ALSFRS‐R, and change in ALSFRS‐R.
Randomizations were normalized as imbalances per thousand simulations, so that comparisons could readily be made across the different trial sizes simulated. The four quantiles for the predicted survival stratification (Table 2) were compared to each other and to traditional stratification (Table 1) using rates of randomization imbalance. The quantile demonstrating the lowest rate of randomization error was then compared in more detail to the traditional stratification method.
External validation
External validation of predicted survival stratification was performed by training a predictive model on the full PRO‐ACT survival dataset and applying it to the placebo arm patients (n = 279) from the BENEFIT‐ALS clinical trial.14 In this dataset, we applied 1000 unique randomization schedules and evaluated the rate of randomization imbalance using traditional stratification (RU and BO) and predicted survival. We performed the same comparisons described above to evaluate the rate of randomization imbalances using each technique.
Trial size and power simulation
To investigate whether the improved balance achieved by predicted survival stratification would translate to improved statistical power of a trial, we simulated a treatment effect and controlled for strata in our analysis. Briefly, subsets of patients were randomly sampled from PRO‐ACT at a range of sample sizes. For each iteration, an independently generated prediction was assigned to every patient. The subset of patients was then split into a treatment and control arms using three different randomization strategies; purely random assignment, stratified block randomization using riluzole use and bulbar onset, and stratified block randomization using predicted survival risk based on predetermined tertiles. We applied a simulated treatment benefit of a 2.5 months of survival. We tested the difference in survival rate using a regression analysis controlling for strata. Power was defined as the proportion of 100 simulated trials in which a regression test controlling for strata was able to detect the applied 2.5‐month survival benefit in the simulated treatment group
Computational methods
All computations were performed using the R statistical computing system (version 3.1.0;20) and the R base packages and add‐on packages gbm,21 plyr,22 and ggplot2.23 Data used in developing the models are available to registered PRO‐ACT users.15
Results
Model performance
Figure 2 shows the performance of the GBM survival model used to predicted survival for stratification. To evaluate model discrimination, predicted scores were used to split a sample population into low, average, and high mortality risk groups; the degree of separation among the three resulting K‐M curves was visually evaluated (Fig. 2A, black curves). Model calibration was further tested by overlaying the predicted survival curves for each of the three corresponding risk groups (Fig. 2A, colored lines). The degree of overlap of the predicted and actual survival curves and the clear separation of the three survival curves suggest good calibration and discrimination of the predictive model. Additionally, the survival prediction model demonstrates relatively high accuracy, as assessed by receiver operating characteristic curve (AUC = 0.766, Fig. 2B). This accuracy ensures appropriate rank ordering of the sample population.
Figure 2.
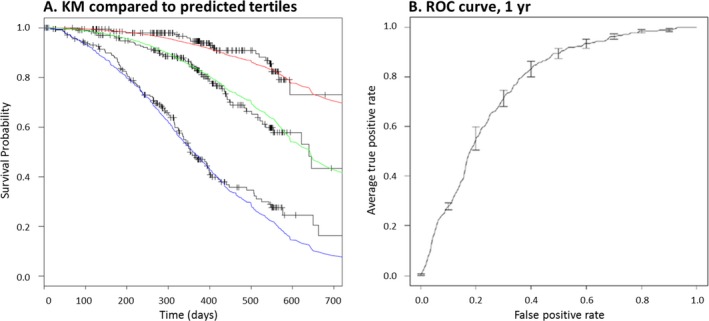
Model performance evaluated on a validation dataset. (A) Survival model accuracy was evaluated on the ability of the predictions to accurately stratify into low, medium, and high mortality risk groups, as well as by evaluating the degree of agreement between the predicted survival curves of each of these three groups (red, green, and blue curves) and the observed Kaplan–Meier curves (black stepwise curves). (B) A global evaluation of model performance is performed by plotting the average ROC curve across all folds of the internal tenfold cross‐validation (2B).
Comparison of randomization methods (internal dataset–PRO‐ACT)
Trial sizes ranging from approximately 44–448 patient records were randomly generated from the 4482 eligible records from PRO‐ACT and in silico randomizations were conducted as described in Figure 1. As expected, neither traditional nor predicted survival stratification demonstrated randomization imbalances on the variable(s) used to generate the strata (Fig. 3, Algorithm – log predicted survival and Traditional – riluzole use and bulbar onset). We also considered the ability of the stratification schemes to randomize the stratification variable(s) of the opposing scheme. The traditional method failed to randomize the variable of predicted survival an average of 49 times per 1000 randomizations. In contrast, the predicted survival method using tertiles had a lower imbalance rate, failing to randomize riluzole use and bulbar onset 33 and 25 times, respectively, per 1000 randomizations (Fig. 3).
Figure 3.
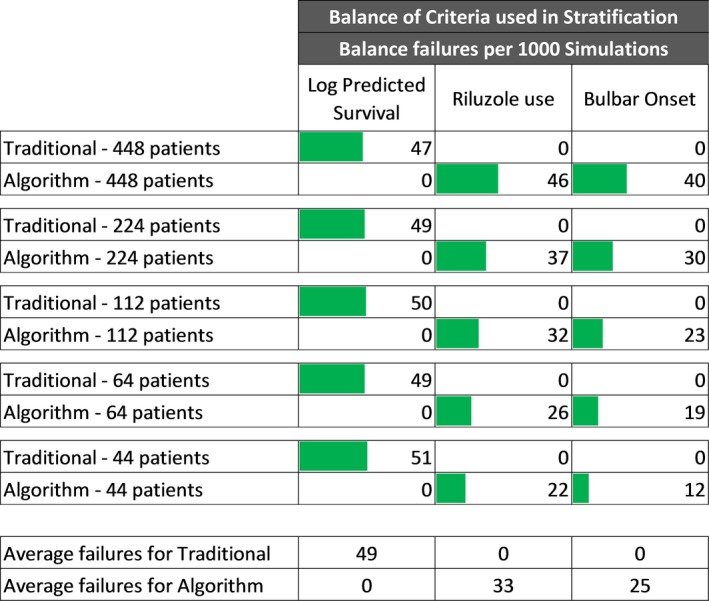
Arm balance failures of variables used to define strata per 1000 Simulations. Traditional stratification compared to stratification on tertile log‐likelihood percentiles.
Regardless of the quantile used, the predicted survival randomization method demonstrated generally lower imbalance rates than the traditional stratification method (Fig. 4 and Figures S1A–D). Averaging across all quantiles and randomization of both baseline features and outcomes, stratification by predicted survival had an average of 23.7% fewer randomization imbalances than the traditional randomization method (Fig. 4). Outcome measures had an average of 14.3% fewer imbalances while baseline features had 39.2% fewer imbalances.
Figure 4.

Summary of trial arm balance failure reductions by algorithmic compared to traditional stratification. Two arms of in silico trials were randomized by algorithmic or traditional (riluzole use/bulbar onset) methods as indicated in Figure 1. The indicated quantiles were used for algorithmic randomization.
Predicted survival stratification performed best when divided into tertiles (≤33rd, >33rd to <66th, ≥66th percentiles) that showed an average 27% reduction in imbalance relative to traditional stratification (Fig. 4). Tertile‐based stratification was selected for in‐depth analysis using an expanded feature set, and a wider range of trial sizes. Relative to the traditional randomization method, for the full panel of baseline features analyzed, analysis of virtual trials from 44 to 448 patients demonstrates an average of 22.3% reduction (range = −16 to 49%) in randomization imbalances (Fig. 5), and an 18.2% reduction (range = 11–39%) in outcome measure randomization imbalances (Fig. 6).
Figure 5.
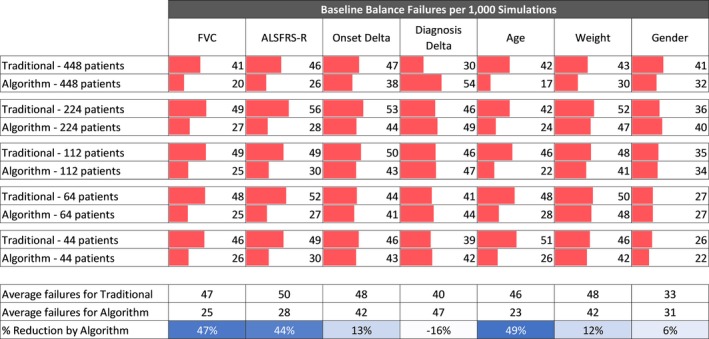
Balance analysis of baseline features. Traditional stratification compared to stratification on tertile log‐likelihood of survival percentiles for trial sizes ranging from 44 to 448 patients.
Figure 6.
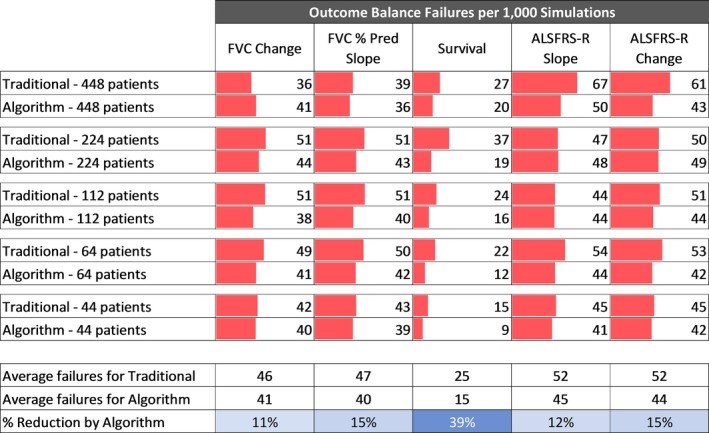
Balance analysis of outcomes. Traditional stratification compared to stratification on tertile log‐likelihood of survival percentiles for trial sizes ranging from 44 to 448 patients.
In addition to successfully stratifying the variables used in the randomization (i.e., BO and RU), the traditional method also successfully stratified diagnosis delta and gender at the baseline time point (4.0% and 3.3% imbalance rates, respectively, Fig. 5) and the survival outcome (2.5% imbalance rate, Fig. 6). Interestingly, diagnosis delta was the one variable that was successfully randomized by the traditional method but not by the algorithm.
Validation using an external dataset
We used predicted survival tertiles (i.e., ≤33rd, >33rd to <66th, ≥66th percentiles), defined from the distribution of predicted scores in the PRO‐ACT database, to predict survival and create strata using data from the BENEFIT‐ALS trial placebo arm. The resulting strata consisted of groups of 69, 118, and 92 patients; a distribution that represented the ≤25th, 26th to 67th, and ≥67th percentiles of the BENEFIT‐ALS dataset. The strata sizes indicate that the internal and external datasets have a similar distribution – within one percent for the higher strata and within 8% for the lower strata. Comparison of the predicted survival stratification to traditional stratification replicated the randomization failure analysis results from the internal (PRO‐ACT) validation (Fig. 7A), baseline features (Fig. 7B) and outcome features (Fig. 7C). As we found in the internal validation (Fig. 3), the stratification variables showed no imbalance, and the predicted survival stratification reduced the imbalance rate of BO and RU more than the traditional method reduced the imbalance of predicted survival. Furthermore, the survival prediction stratification reduced imbalance rates for the BENEFIT‐ALS randomization an average of 26.2% for baseline features (compared to 22.3% for the PRO‐ACT data, Fig. 5) and 13.3% for outcome features (compared to 18.2% for the PRO‐ACT data, Fig. 6).
Figure 7.
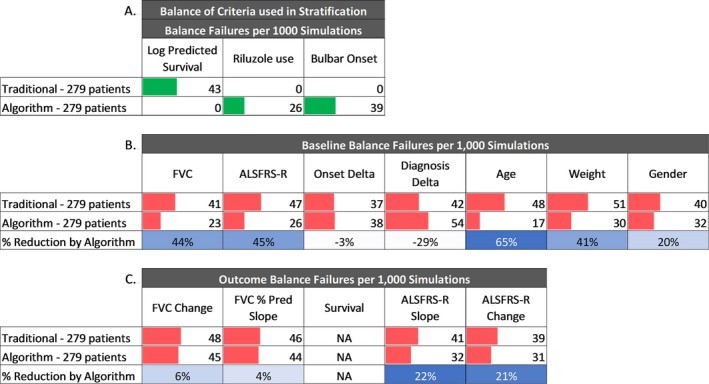
External validation of stratified randomization. A randomization simulation was performed on 279 placebo arm patients from an external, independent clinical trial using both traditional stratified randomization and algorithmic randomization. Predictions were generated using a GBM model trained on PRO‐ACT patient data, and stratified according to the log‐likelihood values corresponding to the tertiles evaluated from PRO‐ACT. A. Arm balance failures of variables used to define strata per 1000 simulations. B. Balance analysis of baseline features per 1000 simulations. C. Balance analysis of outcomes per 1000 simulations.
BENEFIT‐ALS captured 4 months of longitudinal data, during which there were no mortality events. The lack of mortality data prevented the comparison of randomization methods for the survival outcome. However, all other outcome measures evaluated showed a reduction in randomization failures relative to traditional stratification, ranging from 4% to 22% (Fig. 7).
Power simulation to demonstrate reduced sample size requirements for survival
We applied a simulated treatment effect of a 2.5‐month survival benefit in a trial using survival as the primary endpoint. We simulated trials of varying sample sizes and repeated each randomization 100 times, comparing unstratified randomization, the traditional stratified block randomization scheme (RU and BO), and the predicted survival stratification scheme. Power was defined as the proportion of 100 trials in which a regression test controlling for strata was able to detect the 2.5‐month extension of survival in the simulated treatment group (Fig. 8). The unstratified randomization crossed the 80% power threshold with a sample size above 500 patients. The traditional stratified randomization provided 80% power with approximately 470 patients. The predicted survival stratification provided 80% power with roughly 400 patients, a sample size reduction of approximately 20% relative to unstratified randomization and 15% relative to traditional stratification.
Figure 8.
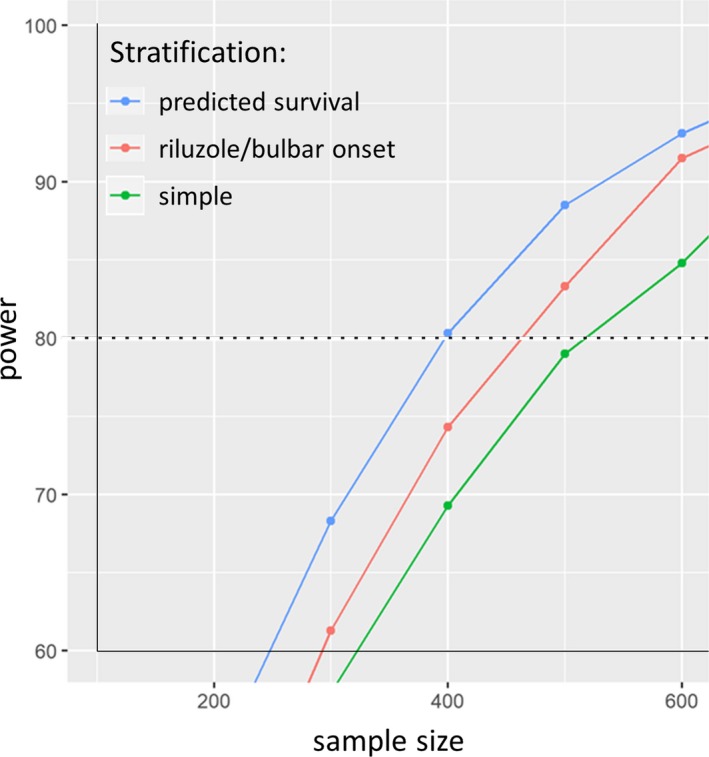
Plot of power versus sample size for a simulated treatment effect of extension of survival by 2.5 months. A series of simulations to evaluate the ability to detect a treatment effect of a 2.5‐month survival extension across a range of sample sizes. Samples of patients were selected from PRO‐ACT and were stratified and assigned to either a treatment or control arm using either a completely random assignment (green line) stratified by riluzole use and bulbar onset (red line) or by prognostic predicted survival (blue line), and an artificial treatment effect was applied. A simulated treatment effect was applied, and statistics were performed to establish the rate of detection of said treatment effect across a range of sample sizes.
Discussion
Randomization in trials is an attempt to balance baseline characteristics across treatment arms. While this generally works well, imbalances between treatment arms can occur due to chance. Stratification helps evenly distribute key baseline characteristics, further reducing the chances of randomization failure on these key variables. Investigators choose stratification variables that are most closely tied to the primary outcome of the trial, because balance is most critical for these variables. An important limitation is that only a few variables can be used as stratification variables – more than two stratification variables create too many strata and threaten the feasibility of the randomization scheme and paradoxically increase the chances of creating an imbalance of a key confounder. This limits the benefit of stratification in a multifactorial disease like ALS.
The output of our survival prediction algorithm for ALS is a single variable, log‐likelihood of survival. Log‐likelihood of survival is the predicted survival for a given patient. It is based on numerous baseline characteristics and predicts categories of short, medium, or long survival. We hypothesized that stratification based on predicted survival from our model might reduce randomization failures in small ALS trials and could even improve the statistical power (or reduce sample size) of ALS trials.
Using data from the PRO‐ACT database, we conducted virtual trials and demonstrate that using predicted survival as a single stratifying variable reduces randomization imbalances relative to a more traditional stratification scheme using two variables – riluzole use and bulbar onset.
Using an unstratified randomization, by chance alone, we expect an imbalance rate of 5% for a given baseline characteristic (i.e., P < 0.05) across simulated trials. In our virtual trials, traditional stratification (RU and BO) did not substantively reduce this expected rate of imbalance. In contrast, the stratification scheme based on predicted survival demonstrated imbalance rates lower than 5% for such variables as riluzole use and bulbar onset, indicating that stratification using predicted survival from our algorithm improves randomization balance. In fact, the predicted survival stratification was more effective on all but two characteristics (onset delta and diagnosis delta), a powerful endorsement of its benefits.
Stratification can improve balance in baseline characteristics across randomization groups. We demonstrate that stratification based on predicted survival from our algorithm improves the balance of baseline characteristics more than traditional methods of stratification. Even more importantly, we found that both traditional and predicted survival stratification methods reduced imbalance of outcome measures in the virtual trials compared to unstratified randomization. Critically, the predicted survival stratification was more effective than the traditional stratification in balancing survival and demonstrated a trend toward improving the balance of other important outcome variables – including FVC, FVC slope, ALSFRS‐R, and ALSFRS‐R slope. This observation provides direct evidence that our predicted survival correlates more strongly with ALS outcome measures than the traditional stratification variables, riluzole use and bulbar onset. Interestingly, the fact that the model performed better at balancing survival than functional decline may suggest that different factors predict functional decline than those that predict survival.
The additional reduction in imbalance gained by stratification using predicted survival translates to higher statistical power, or smaller sample size in ALS clinical trials. To optimize this effect, we explored different strata definitions for predicted survival. Because the output of our survival prediction model is the log‐likelihood of survival, a continuous variable, strata could be defined using any number of cutoffs. Our hypothesis that relatively equal strata sizes would be most effective was supported – the predicted survival stratification was most effective using tertiles (≤33rd, >33rd to <66th, ≥66th percentiles).
Our external validation using data from the placebo arm of the BENEFIT‐ALS trial demonstrates the generalizability of our approach – we can derive the algorithm for predicted survival using PRO‐ACT data and apply it to a predicted survival stratification scheme in a different, unrelated, contemporary trial.
Prospective ALS trials using predicted survival for stratification will require a priori specification of cutoffs for each stratum. If there is a deviation in the trial demographics, relative to the PRO‐ACT data used to determine strata cutoff, some variability in the size of each strata can be expected. For example, if a trial enrolls a higher percentage of slow progressors, the stratum containing long‐survivors will be larger than expected. In fact, in our modeling, when the thresholds were applied to the BENEFIT‐ALS data, the strata containing the patients with the lowest likelihood of survival captured only 26% of the sample, rather than the intended 33%. It is unsurprising that an a priori selection of tertile cutoffs resulted in successful reductions in imbalance in the external dataset, even though the number of trial participants in each observed stratum was not exactly equal.
Our final simulation is, perhaps, most important – we simulate a treatment effect and demonstrate that the treatment effect can be detected using fewer patients simply by implementing a stratification scheme based on predicted survival. Alternately, stratification using predicted outcomes can be used to increase the power of a clinical trial.
Our modeling demonstrates a robust improvement in randomization balance using predicted survival as a single stratifier, and defining strata using tertile cutoffs. We show a substantial reduction in the sample size needed to see a simulated treatment effect in virtual ALS trials. And, we demonstrate generalizability of the technique by using an external dataset for validation of our methods. These methods are ready for adoption in prospective ALS trials and could be adapted for use in other neurodegenerative diseases, including Alzheimer's, Parkinson's and Huntington's.
Conflict of Interest
None declared.
Supporting information
Figure S1. Comparison of Traditional randomization scheme to four algorithmic randomizations.
Acknowledgments
The algorithm for predicted survival was performed at Origent Data Sciences. This analysis was partially funded by Voyager Therapeutics, Inc. The external validation was funded by a grant awarded to David L. Ennist from the Amyotrophic Lateral Sclerosis Association (grant 17‐LGCA‐333). We would like to thank all the participants in the numerous ALS clinical trials contained in PRO‐ACT and the BENEFIT‐ALS trial.
The Pooled Resource Open‐Access ALS Clinical Trials Consortium
Data used in the preparation of this article were obtained from the Pooled Resource Open‐Access ALS Clinical Trials (PRO‐ACT) Database. As such, the following organizations within the PRO‐ACT Consortium contributed to the design and implementation of the PRO‐ACT Database and/or provided data, but did not participate in the analysis of the data or the writing of this report: (i) Neurological Clinical Research Institute, MGH; (ii) Northeast ALS Consortium; (iii) Novartis (iv) Prize4Life;(v) Regeneron Pharmaceuticals, Inc.;(vi) Sanofi; (vii) Teva Pharmaceutical Industries, Ltd.
Funding Statement
This work was funded by Amyotrophic Lateral Sclerosis Association grant 17‐LGCA‐333.
References
- 1. Bensimon G, Lacomblez L, Meininger V. A controlled trial of riluzole in amyotrophic lateral sclerosis. ALS/Riluzole Study Group. N Engl J Med. 1994;330:585–591. [DOI] [PubMed] [Google Scholar]
- 2. Lacomblez L, Bensimon G, Leigh PN, et al. Dose‐ranging study of riluzole in amyotrophic lateral sclerosis. Amyotrophic lateral Sclerosis/Riluzole Study Group II. Lancet 1996;347:1425–1431. [DOI] [PubMed] [Google Scholar]
- 3. Lacomblez L, Bensimon G, Leigh PN, et al. A confirmatory dose‐ranging study of riluzole in ALS. ALS/Riluzole Study Group‐II. Neurology 1996;47(6 Suppl 4):S242–S250. [DOI] [PubMed] [Google Scholar]
- 4. Kernan WN, Viscoli CM, Makuch RW, et al. Stratified randomization for clinical trials. J Clin Epidemiol 1999;52:19–26. [DOI] [PubMed] [Google Scholar]
- 5. Armitage P. Fisher, Bradford Hill, and randomization. Int J Epidemiol 2003;32:925–928. https://doi.org/10.1093/ije/dyg286. [DOI] [PubMed] [Google Scholar]
- 6. Kao LS, Tyson JE, Blakely ML, Lally KP. Clinical research methodology I: introduction to randomized trials. J Am Coll Surg 2008;206:361–369. https://doi.org/10.1016/j.jamcollsurg.2007.10.003. [DOI] [PMC free article] [PubMed] [Google Scholar]
- 7. Cudkowicz ME, Titus S, Kearney M, et al. ; . Safety and efficacy of ceftriaxone for amyotrophic lateral sclerosis: a multi‐stage, randomised, double‐blind, placebo‐controlled trial. Lancet Neurol 2014;13(11):1083–1091. https://doi.org/10.1016/S1474-4422(14)70222-4. [DOI] [PMC free article] [PubMed] [Google Scholar]
- 8. Cudkowicz ME, van den Berg LH, Shefner JM, et al. Dexpramipexole versus placebo for patients with amyotrophic lateral sclerosis (EMPOWER): a randomised, double‐blind, phase 3 trial. Lancet Neurol 2013;12:1059–1067.https://doi.org/10.1016/S1474-4422(13)70221-7 [DOI] [PubMed] [Google Scholar]
- 9. Miller RG, Block G, Katz JS, et al. . Randomized phase 2 trial of NP001‐a novel immune regulator: safety and early efficacy in ALS. Neurol Neuroimmunol Neuroinflamm. 2015; 2: e100 https://doi.org/10.1212/NXI.0000000000000100 [DOI] [PMC free article] [PubMed] [Google Scholar]
- 10. Therneau TM. How many stratification factors are “too many” to use in a randomization plan? Control Clin Trials 1993;14:98–108. [DOI] [PubMed] [Google Scholar]
- 11. Atassi N, Berry J, Shui A, et al. The PRO‐ACT database: design, initial analyses, and predictive features. Neurology 2014;83:1719–1725. https://doi.org/10.1212/WNL.0000000000000951 [DOI] [PMC free article] [PubMed] [Google Scholar]
- 12. Zach N, Ennist DL, Taylor AA, et al. Being PRO‐ACTive ‐ What can a clinical trial database reveal about ALS? Neurotherapeutics 2015;12:417–423. https://doi.org/10.1007/s13311-015-0336-z. [DOI] [PMC free article] [PubMed] [Google Scholar]
- 13. Küffner R, Zach N, Norel R, et al. Crowdsourced analysis of clinical trial data to predict amyotrophic lateral sclerosis progression. Nat Biotechnol 2015;33:51–57. https://doi.org/10.1038/nbt.3051. [DOI] [PubMed] [Google Scholar]
- 14. Shefner JM, Wolff AA, Meng L, et al. A randomized, placebo‐controlled, double‐blind phase IIb trial evaluating the safety and efficacy of tirasemtiv in patients with amyotrophic lateral sclerosis. Amyotroph Lateral Scler Frontotemporal Degener. 2016;17:426–435.https://doi.org/10.3109/21678421.2016.1148169. [DOI] [PubMed] [Google Scholar]
- 15. PRO‐ACT . Pooled resource open‐access als clinical trials database. Available at: https://nctu.partners.org/ProACT/ (Accessed December 31, 2015).
- 16. ALS CNTF treatment study (ACTS) phase I‐II Study Group . The amyotrophic lateral sclerosis functional rating scale. Assessment of activities of daily living in patients with amyotrophic lateral sclerosis. Arch Neurol. 1996; 53:141–147. [PubMed] [Google Scholar]
- 17. Cedarbaum JM, Stambler N, Malta E, et al. The ALSFRS‐R: a revised ALS functional rating scale that incorporates assessments of respiratory function. BDNF ALS Study Group (Phase III). J Neurol Sci 1999;169:13–21. [DOI] [PubMed] [Google Scholar]
- 18. Friedman DJH. Greedy function approximation: a gradient boosting machine. Ann Stat 2001;29:1189–1232. https://doi.org/10.1214/aos/1013203451. [Google Scholar]
- 19. Natekin A, Knoll A. Gradient boosting machines, a tutorial. Front Neurorobot 2013;. https://doi.org/10.3389/fnbot.2013.00021. [DOI] [PMC free article] [PubMed] [Google Scholar]
- 20. R Core Team . R. A language and environment for statistical computing. R Foundation for Statistical Computing. Vienna, Austria. http://www.R-project.org/. (Accessed March 1, 2015).
- 21. Ridgeway G. Package ‘gbm’ Version 2.1.1. 2015. Downloaded from CRAN Repository April 1, 2015. Available at: https://cran.r-project.org/web/packages/gbm/gbm.pdf. (Accessed June 15, 2015)
- 22. Wickham H. The split‐apply‐combine strategy for data analysis. J Stat Software 2011;40:1–29. [Google Scholar]
- 23. Wickham H. ggplot2: elegant graphics for data analysis. New York, NY: Springer, 2009. [Google Scholar]
Associated Data
This section collects any data citations, data availability statements, or supplementary materials included in this article.
Supplementary Materials
Figure S1. Comparison of Traditional randomization scheme to four algorithmic randomizations.


