

Abstract
Aims
To determine effects of glucagon-like peptide (GLP)-1 receptor agonists (RA) on uric acid (UA)-levels and kidney UA-clearance.
Material and methods
Post-hoc analyses of four controlled clinical trials, which assessed actions of GLP-1RA-administration on kidney physiology. Immediate effects of GLP-1RA exenatide-infusion versus placebo was determined in 9 healthy overweight males (Study-A) and in 52 overweight T2DM-patients (Study-B). Effects were also examined of 12-week long-acting GLP-1RA liraglutide versus placebo in 36 overweight T2DM-patients (Study-C) and of 8-week short-acting GLP-1RA lixisenatide versus once-daily titrated insulin-glulisine in 35 overweight T2DM-patients (Study-D). Plasma-UA, fractional (inulin-corrected) and absolute urinary-excretion of UA (UEUA) and sodium (UENa), and urine-pH was determined.
Results
Median baseline plasma-UA levels was 5.39 to 6.33 mg/dL across all studies (17-22% of subjects were hyperuricemic). In study-A, exenatide-infusion slightly increased plasma-UA (+0.07±0.02mg/dL, P=0.04), and raised absolute-UEUA (+1.58±0.65mg/min/1.73m2, P=0.02), but did not affect fractional-UEUA compared to placebo. Fractional-UEUA and absolute-UEUA correlated with increases in urine-pH (r:0.86, P=0.003 and r:0.92, P<0.001, respectively). Fractional-UEUA correlated with increased fractional-UENa (r:0.76, P=0.02). In study-B, exenatide-infusion did not affect plasma-UA, but increased fractional-UEUA (+0.76±0.38%, P=0.049) and absolute-UEUA (+0.75±0.27mg/min/1.73m2, P=0.007), compared to placebo. In regression analyses, both parameters were explained by changes in urine-pH, and in part, by changes in UENa. In study-C, liraglutide-treatment did not affect plasma-UA, UEUA, UENa, or urine-pH compared to placebo. In study-D, lixisenatide-treatment increased UENa and urine-pH from baseline, but did not affect plasma-UA or UEUA.
Conclusion
Immediate exenatide-infusion increases UEUA in overweight healthy males and T2DM-patients, likely via inhibiting Na+/H+-exchanger type-3 in the renal proximal tubule. Prolonged treatment with a long-acting or short-acting GLP-1RA does not affect plasma-UA or UEUA in T2DM patients with normal plasma UA-levels and relatively low cardiovascular risk. Our results suggest that the cardio-renal benefits of GLP-1RA are not mediated through changes in UA.
Introduction
In humans, uric acid (UA) is the final breakdown product of purine nucleotides, which originate from exogenous dietary sources, and endogenous de novo synthesis and tissue catabolism.1, 2 UA-formation from purines occurs mainly in the liver, with a prominent role for xanthine oxidase, the rate-limiting enzyme in UA-biosynthesis.3, 4 Normally, >70% of UA is excreted into the urine (with a fractional excretion of 5 to 10%), while the remainder is excreted through the intestines and perspiration.3, 5, 6 Hyperuricemia is usually defined as a plasma UA-level >6.8 mg/dL (405 μmol/L; corresponding with its solubility-point)6 and can be caused by reduced excretion by the kidney (90% of hyperuricemic cases) or UA-overproduction in the liver.3 Hyperuricemia can result in deposition of UA-crystals, leading to gout and nephrolithiasis. Moreover, evidence suggests that increased plasma-UA-levels –even in the high-normal range–4, 7 are an independent risk-factor for impaired fasting glucose, diabetes mellitus, hypertension, heart failure, coronary heart disease and chronic kidney disease.8 Accordingly, the indication for plasma UA lowering therapy –either with xanthine-oxidase inhibitors or uricosuric agents– may be broader than gout or UA nephrolithiasis. Interestingly, in studies in diverse populations, including type 2 diabetes mellitus (T2DM) patients,4, 9–11 plasma-UA lowering (therapy) improved (surrogate) cardio-renal end points, although dedicated large-sized trials are needed to firmly establish the causation between UA lowering and long-term clinical outcomes.44
Over the last three decades, multiple antihyperglycaemic drug-classes with different modes of action have been successfully licensed for the treatment of hyperglycaemia in T2DM. The results of recent long-term cardiovascular safety trials in thousands of at-risk T2DM patients indicate benefit of two of these drug-classes on cardiovascular and renal events and mortality: glucagon-like peptide-1 (GLP-1) receptor agonists (RA) (i.e. liraglutide12, 13 and semaglutide,14 while exenatide once-weekly tended [p=0.06] to improve cardiovascular risk15) and sodium-glucose co-transporter-2 (SGLT2) inhibitors (i.e. empagliflozin16, 17 and canagliflozin18). Delineation of the underlying cardio-renal protective mechanisms may have immediate relevance for the prevention and treatment of diabetes-related complications, but many uncertainties in this regard remain. For SGLT2 inhibitors, some have suggested that benefits are in-part explained by their ability to reduce serum UA-levels, likely through increased urinary UA-excretion.19 The effect of GLP-1RAs on plasma UA-levels and urinary-excretion of UA (UEUA) in humans are hitherto unknown. In rats with streptozotocin induced (type 1)-diabetes, daily GLP-1-peptide injections for 10 weeks reduced serum UA-concentrations by 58% compared to untreated diabetic rats.20
As GLP-1RA administration inhibits Na+/H+-exchanger type-3 (NHE3)-activity in the proximal tubule, causing natriuresis and alkalization of the urine,21–24 we hypothesise that this antihyperglycaemic drug-class may reduce plasma-UA levels by increasing urinary UA-excretion in humans with and without T2DM.25–27 To explore the effects of currently available GLP-1RAs –with clinically relevant differences in their pharmacokinetic profile (see below)– on plasma-UA and UEUA, we performed a post-hoc analysis of four clinical trials, which assessed the effects of these drugs on kidney physiology.21, 22, 24, 28 First, we assessed the immediate effects by means of administering intravenous exenatide-administration in healthy overweight males and T2DM patients. Second, as immediate effects on tubular UA-handling could be offset during chronic intervention, we also examined the effects of prolonged GLP-1RA therapy in overweight T2DM patients. The pharmacokinetic profile of a GLP-1RA is known to have different effects on gastric emptying rate, urinary sodium excretion and urinary alkalization during prolonged administration.22, 28–30
Material and methods
Trial designs
Post-hoc analyses of four phase-4 clinical intervention trials, all conducted at the Diabetes Center of the VU University Medical Center (VUMC) in Amsterdam (The Netherlands) between May 2013 and April 2017. All trials were primarily designed to assess the effects of immediate or prolonged GLP-1RA-administration on kidney physiology in overweight healthy males and T2DM patients.
A detailed overview of trial-designs and testing-procedures is shown in Figure 1. Study-A was an acute, non-blinded, placebo-controlled trial, examining the effect of placebo (isotonic saline) and subsequent exenatide-infusion at therapeutic concentrations in healthy overweight males.21 Study-B was an acute, randomised, double-blind, placebo-controlled, parallel-group trial, examining the effect of exenatide-infusion in T2DM patients.24 Patients from Study-B were subsequently enrolled in Study-C, which was a 12-week, randomised, double-blind, placebo-controlled trial, examining the effect of subcutaneous injections with liraglutide in T2DM patients.28 Study-D was an 8-week, randomised, open-label, comparator-controlled trial, examining the effect of subcutaneous injections with lixisenatide versus once-daily titrated insulin glulisine in T2DM patients.23
Figure 1.
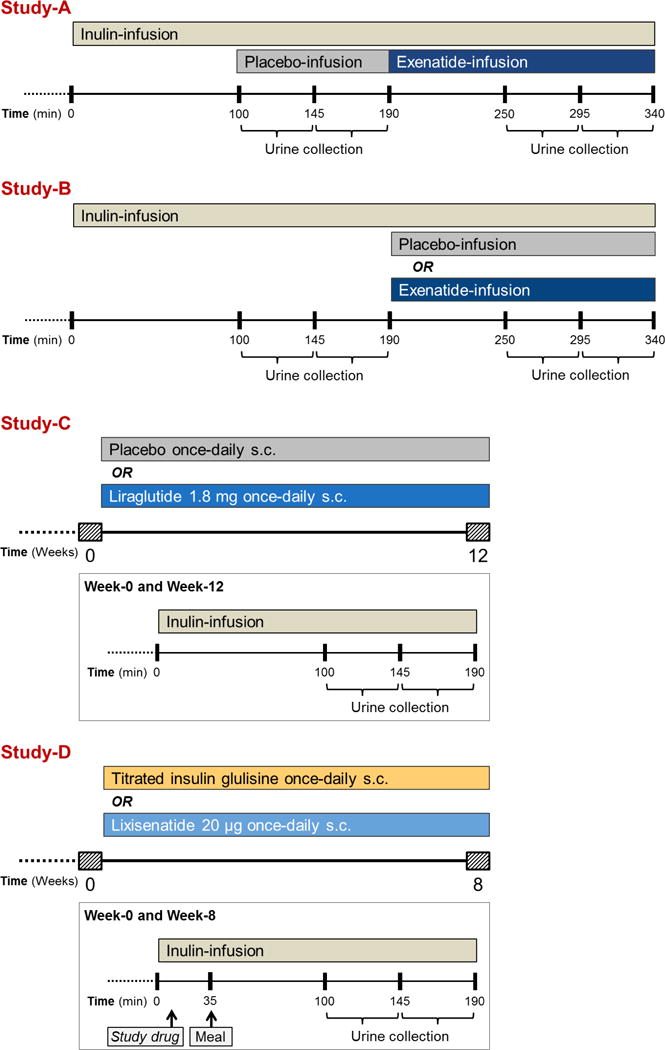
Trial designs
All trials were registered at ClinicalTrials.gov (ID’s: NCT01744236 [Studies A-C] and NCT02276196 [Study-D]. Trials were approved by the local ethic review board, and conducted in accordance with the Declaration of Helsinki and International Conference on Harmonization on Good Clinical Practice. All subjects provided written informed consent before any trial-related activities.
Detailed descriptions of participants, interventions and randomisation procedures has been reported.21, 23, 24, 28, 31 A brief description is provided the Supplemental methods.
Study protocols
Two days prior to testing procedures, participants were instructed to adhere to a controlled intake of protein (1.5–2.0 g/kg/day) and sodium (~150-200 mmol/day). In addition, prior to the experiments, participants were instructed to refrain from vigorous physical activity and alcohol consumption for ≥ 24 hours, and avoid caffeine-containing products or nicotine for ≥ 12 hours. After an overnight fast, and before arriving at the CRU of the Diabetes Center VUMC at 07:30 AM, patients consumed 500 mL of tap water to stimulate diuresis. T2DM patients delayed their morning medications, with the exception of metformin and thyroid hormone replacement therapy. Participants assumed a semi-recumbent position in a temperature controlled-room (23.0 ± 1.0 °C) throughout testing procedures. Intravenous catheters were inserted in an antecubital vein of both forearms to allow intermittent blood sampling (non-dominant side) and infusion of the kidney tracer substances (dominant side). Blood and urine was obtained for outcome variables as described in detail.21, 23, 24, 28 Subsequently, the kidney tests commenced as previously described in detail.21, 23, 24, 28 In all studies, a bolus of inulin was administered over 10 min, which was followed by a continuous infusion of 90 min, which served as an equilibration period.
In Study-A, subjects subsequently underwent two consecutive urine collection periods of 45 min during placebo-infusion, which were repeated after 60 min infusion with exenatide (Figure 1).21 In Study-B, participants subsequently underwent two urine collection periods of 45 min at baseline, which were repeated after 60 min infusion with exenatide or placebo (Figure 1).24 In Study-C, the baseline measurements of Study-B were repeated after 12 weeks treatment with liraglutide or placebo (Figure 1).28 In Study-D, participants consumed a standardized mixed breakfast consisting of bread with cheese and jam, and milk (416 kcal; 22 g protein, 48 g carbohydrates and 14 g fat) 35 minutes after the start of the inulin infusion (Figure 1).23 After the equilibration period, patients underwent two urine collection periods of 45 minutes at baseline, which were repeated at week-8. After 8 weeks lixisenatide or insulin glulisine was administered 30 and 10 min before the standardized breakfast, respectively.
In all studies, diuresis was prompted by oral intake of 10 mL/kg (maximum 1,000 mL) tap water during the inulin equilibration period, followed by an intake of 200 mL/h for the remainder of the testing day. Before and after each urine collection period, blood samples were taken to obtain the outcome variables as described in detail.21, 23, 24, 28 UA-excretion was measured over the second of two consecutive urine collection periods in Studies-A to C, and over both of the two urine collection periods in Study-D.
Biochemical analyses
UA was measured as urate using an enzymatic colorimetric test (Cobas-C501, Roche Diagnostics, Indianapolis, IN) and urine-pH was buffered to >8.0 with NaOH. Inulin was analysed as described previously.24 Routine blood determinations (HbA1c, glucose, sodium, osmolality, and creatinine) were performed at baseline and after prolonged therapy, using conventional assay methods by the Department of Clinical Chemistry in the VUMC. Venous blood glucose was measured throughout the kidney tests using an YSI-2300 STAT glucose analyzer (YSI Life Sciences, Yellow Springs, OH). Insulin was determined using an immunometric assay (ADVIA Centaur-XP Immunoassay System; Siemens Healthcare, Erlangen, Germany). Cross-reactivity of the assay with insulin glulisine (low) and insulin glargine (high) has been described.22 Urine-pH was measured by hand-held VARIO® 2V00 pH-meter and SenTix-V electrode (Wissenschaftlich-Technische Werkstätten GmbH, Weilheim, Germany).
Outcomes
In all studies, plasma-UA, fractional and absolute UE of UA (UEUA) and sodium (UENa), GFR, urine-pH, urine-osmolality, insulin (serum or plasma) and glucose (blood or plasma) were measured. Urinary-glucose was determined in Study-B to D. In Study-C, fractional-UEUA was additionally assessed at weeks 0, 2 and 12.
Calculations
Fractional UEUA and UENa were calculated by using inulin as reference substance, unless stated otherwise. Absolute electrolyte excretions were calculated by multiplying urinary-electrolyte concentrations by urine flow. GFR was calculated from inulin clearances. GFR and absolute electrolyte excretion were corrected for body surface area using the Mosteller formula.21, 23, 24, 28
Statistical methods
No a priori sample-size power calculation was performed for these post-hoc exploratory analyses. Statistical analyses were performed in the per protocol population of the separate trials as described,21, 23, 24, 28 using SPSS Statistics for Windows, V22.0 (IBM Corp, Armonk, NY). Log10-transformation of non-Gaussian distributed data was carried out to achieve normality prior to analyses. Paired t-test or Wilcoxon signed-rank test (as appropriate) were used to identify single effects of exenatide versus placebo in Study-A and within-group comparisons in Study-D. Multivariable linear regression models adjusting for corresponding baseline values only were used to identify effects of exenatide versus placebo (Study-B), liraglutide versus placebo Study-C) or lixisenatide versus insulin glulisine (Study-D). The Mann-Whitney test was used to assess between-group differences in urinary-glucose in Study-D. Pearson’s correlation or Spearman signed rank test (as appropriate) was used to assess associations. A two-sided P < 0.05 was considered statically significant for all comparisons. Data are presented as least square mean ± SEM or, in case of a non-Gaussian distribution, as median [interquartile range], unless stated otherwise.
Results
Study-A
The study population consisted of 9 subjects (Table 1).21 Plasma-UA was 6.33 [6.05-7.05] mg/dL (2 subjects hyperuricemic) during placebo, and increased upon exenatide-infusion to 6.48 [6.09-7.08] mg/dL (+0.07±0.02 mg/dL, P=0.04). Exenatide did not significantly affect fractional-UEUA (+0.82±0.47%, P=0.2), but increased absolute-UEUA compared to placebo-infusion (+1.58±0.65 mg/min/1.73m2, P=0.02; Figure 2). As previously reported, exenatide increased GFR, fractional-UENa, absolute-UENa, urine-pH (from 6.53 [6.03-6.90] to 7.04 [6.89-7.34], P=0.005) and osmolality (Supplemental Table 1).21 Exenatide reduced plasma glucose, without affecting plasma insulin concentrations (Supplemental Table 1).21
Table 1.
Baseline clinical and biochemical characteristics
| Study-A (N=9) | Study-B (N=52) | Study-C (N=36) | Study-D (N=35) | |
|---|---|---|---|---|
| Clinical characteristics | ||||
| Male sex, n (%) | 9 (100) | 39 (77) | 27 (75) | 23 (66) |
| Age, years | 22.0 [22.0–23.0] | 62.9 ± 6.9 | 63.0 ± 7.0 | 61.7 ± 6.6 |
| Weight, kg | 96.0 (7.0) | 99.0 ± 14.3 | 101.2 ± 14.9 | 97.5 ± 16.4 |
| BMI, kg/m2 | 29.3 ± (1.7) | 31.1 [28.3–33.6] | 31.2 [29.2–33.3] | 31.5 ± 4.0 |
| Systolic BP, mm Hg | 113 [107–123] | 135 ± 15 | 137 ± 16 | 134 ±16 |
| Diastolic BP, mm Hg | 67 [61–71] | 76 ± 6 | 77 ± 6 | 76 ± 9 |
| Biochemistry | ||||
| HbA1c, % | 5.1 [5.0–5.3] | 7.3 ± 0.6 | 7.4 ± 0.7 | 8.0 ± 0.9 |
| HbA1c, mmol/mol | 32 [31–34] | 57 ± 7 | 58 ± 8 | 64 ± 9 |
| Fasting plasma glucose, mmol/L | 4.9 [4.4–5.2] | 8.4 ± 1.5 | 8.6 ± 1.7 | 7.0 ± 2.0 |
| HOMA2-IR | 0.67 [0.59–1.47] | 1.7 [1.2–2.5] | 1.6 [1.1–2.4] | N/A* |
| Plasma-UA, mg/dL | 6.33 [6.05-7.05] | 5.50±1.04 | 5.39±1.07 | 5.68±1.19 |
| Hyperuricemia#, n (%) | 2 (22) | 9 (17) | 6 (17) | 7 (20) |
| Diabetes history characteristics | ||||
| Type 2 diabetes duration, years | N/A | 7 [4–12] | 8 [4–12] | 13 ± 7 |
| Metformin use, n (%) | N/A | 49 (94) | 34 (94) | 32 (91) |
| Sulphonylurea use, n (%) | N/A | 23 (44) | 15 (42) | 0 (0) |
| Insulin use, n (%) | N/A | 0 (0) | 0 (0) | 35 (100) |
| Xanthine-oxidase inhibitor use, n (%) | 0 (0) | 1 (2) | 1 (3) | 2 (6) |
| Antihypertensive medication use, n (%) | N/A | 34 (65) | 26 (72) | 22 (63) |
| RAS inhibitor use‡, n (%) | N/A | 32 (62) | 20 (56) | 22 (63) |
Data are shown as mean ± SD, median [IQR] or absolute (%).
Abbreviations: BMI=body mass index. BP=blood pressure. HbA1c=glycated hemoglobin. NA=not applicable. HOMA2-IR=updated homeostatic model assessment-insulin resistance. RAS=renin-angiotensin-system. UA=uric acid.
Not calculated due to interference with insulin glargine.
Defined as plasma-UA >6.8 mg/dL6. Distribution of hyperuricemic cases is as follows: Study-B, 5 randomised to placebo and 4 to exenatide; Study-C, 2 randomised to placebo and 4 to liraglutide; Study-D, 6 randomised to insulin glulisine and 1 to lixisenatide.
The use of losartan was as follows: Study-B, 1 randomised to placebo and 1 to exenatide; Study-C, 1 randomised to placebo and 1 to liraglutide; Study-D, 1 randomised to insulin glulisine and 2 to lixisenatide.
Figure 2. Effect of immediate and prolonged GLP-1RA administration in healthy overweight males (Study-A) and T2DM patients (Study-B to D).
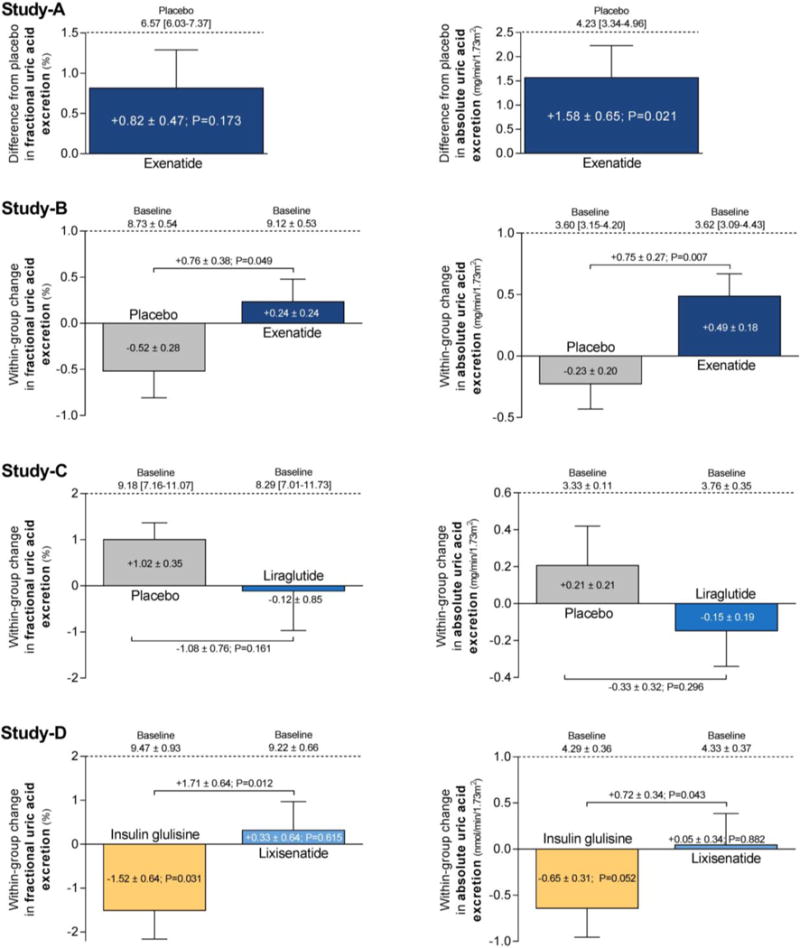
Data are mean ± SEM, median [IQR], or baseline-corrected mean difference ± SEM. Wilcoxon signed-rank test was used to examine effects of exenatide versus placebo in Study-A. Multiple linear regression corrected for correponding baseline values were used to determine exenatide-induced effects compared to placebo in Study-B, liraglutide-induced effects compared to placebo in Study-C, and lixisenatide-induced effects compared to insulin glulisine in Study-D. Paired t-test was used for within-group comparisons in Study-D.
Changes in fractional-UEUA and absolute-UEUA correlated with changes in urine-pH (r: 0.90, P=0.001 and r: 0.82, P=0.007, respectively) (Figure 3A–B), but not with changes in plasma-UA (r: -0.20, P=0.6 and r: -0.35, P=0.4), glucose (r: 0.58, P=0.1 and r: 0.27, P=0.5) or insulin (r: 0.17, P=0.7 and r: 0.26, P=0.5). Changes in fractional-UEUA correlated with changes in fractional-UENa (r: 0.75, P=0.019) (Figure 3C). Changes in fractional-UEUA absolute-UEUA and plasma-UA did not correlate with baseline plasma-UA (all P>0.3).
Figure 3. Correlations of within-group changes in healthy overweight males (Study-A).
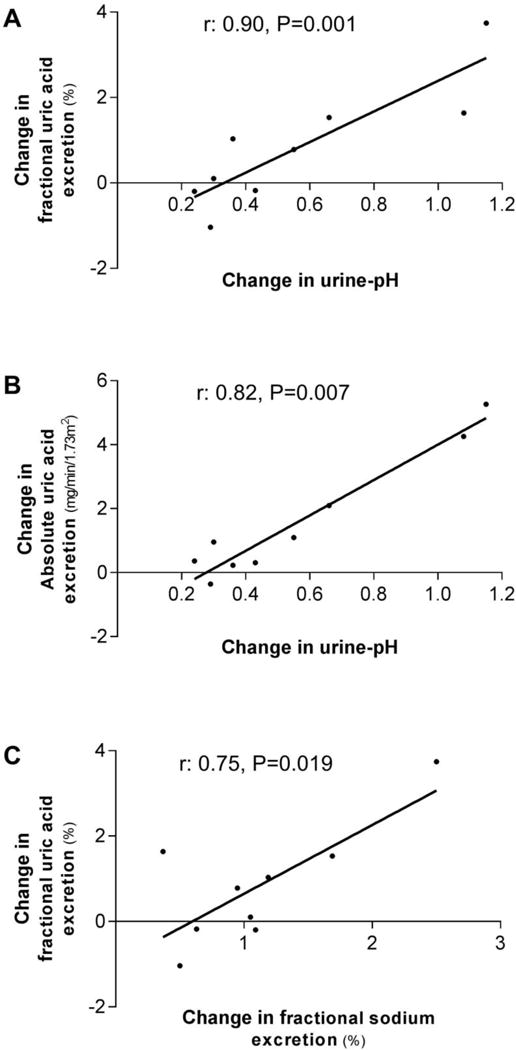
Spearman signed rank test (A and B) or Pearson’s correlation (C) was used to assess correlations.
Study-B
The study population consisted of 52 patients (Table 1).24 Mean± SD baseline UA was 5.50±1.04 mg/dL (9 patients hyperuricemic) and did not change during immediate exenatide-infusion compared to placebo (-0.01±0.02 mg/dL, P=0.8). While UA levels were not affected, exenatide-infusion increased fractional-UEUA (+0.76±0.38%, P=0.049) and absolute-UEUA (+0.75±0.27 mg/min/1.73m2, P=0.007), compared to placebo (Figure 2). As previously reported, exenatide increased fractional-UENa, absolute-UENa, urine-pH (+0.72±0.11, P<0.001) and urinary-osmolality (Supplemental Table 2).24 Urinary-glucose at baseline was <0.11 mmol/L in all but one patient (0.97 mmol/L) and was not affected by exenatide.24 Exenatide-infusion reduced blood glucose during the kidney tests, and increased serum insulin concentrations, compared to placebo (Supplemental Table 2). There were no changes in plasma renin concentrations (PRC).24
In regression analyses, exenatide-induced alterations in fractional-UEUA and absolute-UEUA were largely explained by the change in urine-pH (regression-coefficient reduced to 0.01±0.45% [P=0.9] and to -0.03±0.28 mg/min/1.73m2 [P=0.9], respectively), and in-part by respective changes in fractional-UENa (to 0.58±0.37%, P=0.1) and absolute-UENa (to 0.50±0.25 mg/min/1.73m2, P=0.049). Correcting for the change in blood glucose partially lowered the effect of exenatide on UEUA (to 0.67±0.64% [P=0.3] and to 0.56±0.48 mg/min/1.73m2 [P=0.3]). When correcting for exenatide-induced change in insulin, the regression-coefficient of fractional-UEUA and absolute-UEUA increased to 1.11±0.45% (P=0.02) and 0.95±0.31 mg/min/1.73m2 (P=0.004), respectively. In the exenatide-arm, changes in fractional-UEUA, absolute-UEUA and plasma-UA did not correlate with baseline UA levels (all P>0.6).
Study-C
The study population consisted of 36 patients (Table 1).28 Mean±SD baseline UA was 5.39±1.07 mg/dL (6 patients hyperuricemic). After 12-week treatment with liraglutide, no alterations in UA (P=0.8; Figure 4A) or UEUA (Figure 2 and Figure 4B) were observed compared to placebo. As previously reported, GFR, UENa, PRC, urine-pH, urine-osmolality and urinary-glucose excretion were not affected after 12 weeks of treatment. (Supplemental Table 3).28 Yet, compared to placebo, liraglutide reduced HbA1c by 1.3±0.2% (p=0.001), plasma glucose by 1.3±0.3 mmol/L (p<0.001), and bodyweight by 1.9±0.7 kg (P=0.009).28 There were no changes in PRC.28 At Week-2, no changes in UA (P=0.8), creatinine-based fractional-UEUA (-1.55±0.88%, P=0.09), or fractional-UENa were observed in the liraglutide compared to the placebo-arm (Figure 4A–B).28 In the liraglutide-, but not in the placebo-arm, changes from baseline to Week-12 in plasma-UA correlated with baseline plasma-UA (r: -0.52, P=0.022) (Figure 5), while fractional-UEUA or absolute-UEUA did not correlate with baseline plasma-UA (both P>0.5) or with changes in plasma-UA (both P>0.06). No correlations were observed in the liraglutide- or placebo-arm between changes from baseline to Week-2 in creatinine-based fractional-UEUA and baseline plasma-UA (P>0.6).
Figure 4. Effect of 12-week treatment with liraglutide in T2DM patients on creatinine-based fractional uric acid-excretion (A) and plasma uric acid (B).
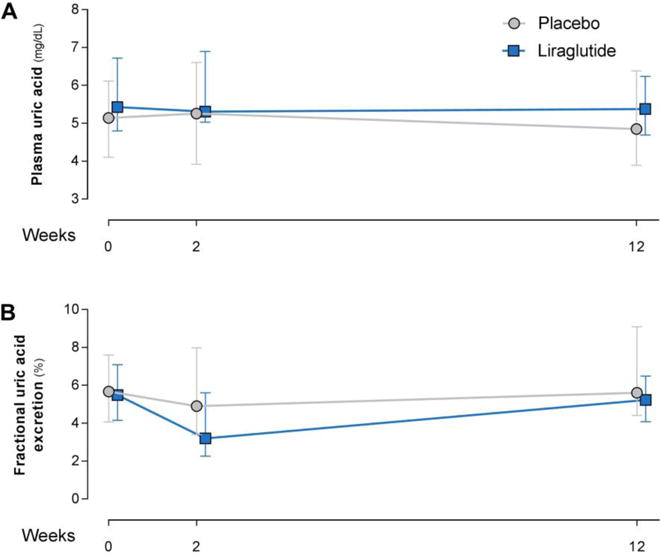
Data are median [IQR]. Multiple linear regression corrected for correponding baseline values was used to examine liraglutide-induced effects compared to placebo. No significant differences were found.
Figure 5. Correlation in T2DM patients on liraglutide (A; Study-C), or lixisenatide or insulin glulisine (B and C; Study-D).
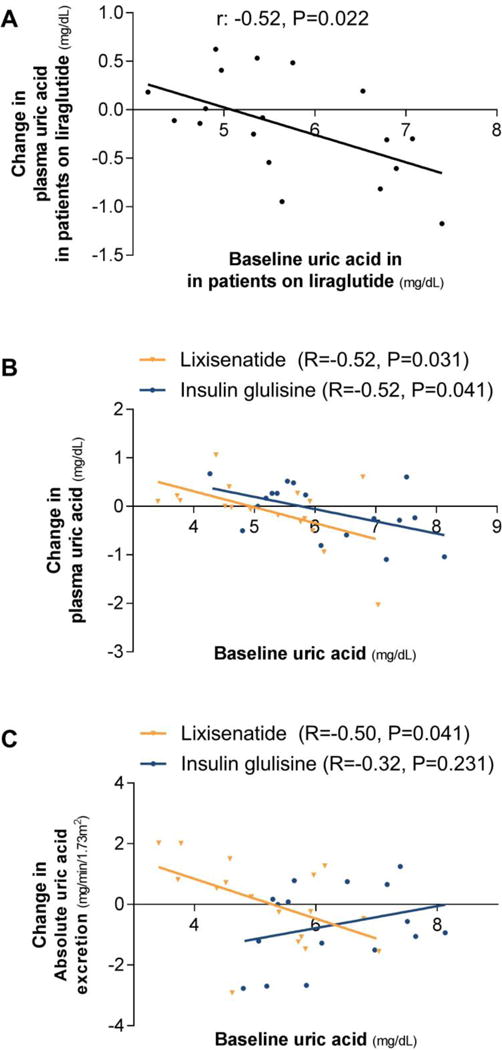
Spearman signed rank test was used to assess correlations.
Study-D
The study population consisted of 35 patients (Table 1). At baseline, mean±SD fasting UA was 5.68±1.19 mg/dL (7 patients hyperuricemic), which decreased after the meal by 0.09±0.04 mg/dL (P=0.03). Prior to randomisation, creatinine-based fractional-UEUA tended to increase slightly after the meal by 0.02±0.01% (P=0.051). After 8 weeks of treatment, fasting and postprandial UA did not differ between or within treatment arms (P>0.1 for all). Within-group, lixisenatide treatment did not affect postprandial fractional-UEUA (P=0.6) or absolute- UEUA (P=0.9), while insulin glulisine reduced fractional-UEUA (-1.52±0.64; P=0.03) and tended to reduce absolute-UEUA (-0.65 mg/min/1.73m2; P=0.052). This resulted in significant between-group differences (Figure 2). As previously reported, urine-pH and fractional-UENa increased with lixisenatide compared to insulin glulisine in the postprandial state, while GFR was not affected (Supplemental Table 4).23 Postprandial urinary-glucose did not differ between- (P=0.2) or within-groups (both P>0.6). Compared to insulin glulisine, lixisenatide did not change HbA1c (P=0.9), but decreased blood glucose during the kidney tests by 1.8±0.5 mmol/L (P=0.002). Within-group, insulin concentrations decreased with lixisenatide (Supplemental Table 4).23 Bodyweight decreased by 1.4±0.6 kg with lixisenatide compared to insulin glulisine (P=0.03).23 No within- or between-group differences in postprandial PRC or angiotensin-II were observed.23 In the lixisenatide- and insulin glulisine-arm, changes from baseline to Week-8 in plasma-UA correlated with fasting baseline plasma-UA (r: -0.52, P=0.031 and r: -0.52, P=0.041, respectively) (Figure 5B). Fasting or postprandial fractional-UEUA did not correlate with baseline plasma-UA (all P>0.08) or with changes in plasma-UA (all P>0.3). Changes in absolute-UEUA correlated with baseline plasma-UA in the lixisenatide-arm (r: -0.51, P=0.038) (Figure 5C), but not in the insulin glulisine-arm (r: 0.30, P=0.3), while changes in absolute-UEUA did not correlate with changes in plasma-UA in neither treatment group (both P>0.3).
Discussion
We are the first to determine the immediate and chronic effects of different GLP-1RAs on UA-levels and kidney UA-clearance in humans, using post-hoc analyses of four controlled clinical intervention trials. We demonstrate that GLP-1RA exenatide-infusion immediately increases UEUA in healthy overweight males and T2DM patients. Plasma UA-levels increased slightly in healthy subjects, but were unaffected in the T2DM population. In contrast, prolonged treatment with two pharmacologically different GLP-1RA (i.e. 12-weeks of liraglutide [long-acting agent], or 8-weeks of lixisenatide [short-acting agent]) did not affect UEUA or plasma UA-levels in T2DM patients (of whom ~20% fulfilled the criteria of hyperuricemia).
Recent landmark cardiovascular safety trials indicate that GLP-1RA provide cardiovascular and renal benefit compared to placebo (i.e. standard of care) in at-risk T2DM patients after prolonged therapy.13–15, 32 However, underlying cardio-renal protective mechanisms remain incompletely understood. Hyperuricemia is frequently observed in patients with pre- or recent-onset T2DM,33 and increased levels of UA are thought to partly mediate cardiovascular and renal risk in T2DM.4, 8 As GLP-1-peptide administration for 10-weeks in diabetic rats reduces UA-levels,20 and GLP-1RA exhibit clinically relevant tubular effects in humans,21–24 we hypothesised that GLP-1RA administration lowers plasma-UA by increasing kidney UA-clearance.25–27 Although intravenous exenatide administration rapidly increased UEUA in overweight healthy subjects (Study-A) and T2DM patients (Study-B), no reduction were observed in UA-levels. This could be explained by the short duration of the studies, although we cannot exclude that exenatide concurrently increased UA-production. Furthermore, upon prolonged treatment with either a short-acting or long-acting GLP-1RA, we did not observe effects on UA-clearance or UA-levels. As such, our results indicate that it is unlikely that UA is a relevant clinical mediator of the recently described cardio-renal benefits of GLP-1RAs in T2DM patients.
Although the tubular handling of UA in humans is incompletely understood, we propose several mechanisms by which exenatide-infusion could have immediately increased UEUA in our studied populations, based on correlation and regression analyses. The effect seems to large extent driven by a concurrent increase in urine-pH, and in part, by an increase in UENa. Inhibition of NHE3 by GLP-1RA21–24 may have decreased pH-dependent organic acid transporter (OAT)-4-activity,25 thereby reducing kidney UA-reabsorption. In addition, urinary alkalisation26, 27 or increased UENa2, 34 may have contributed directly to the uricosuric effect of acute exenatide administration. While high concentrations of urinary-glucose may stimulate UEUA via the tubular GLUT9 transporter,2, 35, 36 we did not observe any relevant glycosuria in our T2DM patient population at baseline or after treatment, which makes such a pathway unlikely. Furthermore, statistical adjustment for the observed decrease in blood glucose, which could result in modest reductions in glycosuria and consequent UA-excretion, did not increase UEUA. We also suggest that the exenatide-induced increase in insulin blunted the increase in UEUA, because insulin is known to augment tubular UA-reabsorption.2, 35 Finally, GLP-1RA can decrease renin-angiotensin-aldosterone-system (RAAS)-activity,37–39 which could increase UEUA by lowering of angiotensin-II.2 However, as we and others40, 41 did not observe changes in PRC or angiotensin-II, there seems no important role for RAAS-involvement, although some contribution of intrarenal RAAS cannot be excluded.
In order to explore the sustainability of the immediate GLP-1RA-induced effect on UEUE, and to determine whether this translates into plasma UA-lowering upon long-term treatment, we analysed the data of two clinical intervention trials involving structurally different GLP-1RAs (Study-C and Study-D). GLP-1RAs can be categorized as either short-acting/prandial compounds, which provide short-lived receptor activation (e.g. exenatide and lixisenatide) or as long-acting compounds (e.g. exenatide once-weekly and liraglutide), which activate GLP-1 receptors continuously. The pharmacokinetic differences between these drugs are known to lead to clinically relevant differences in their pharmacodynamic profiles. For example, due to their continuous receptor stimulation and resultant tachyphylaxis, the ability of long-acting GLP-1RAs to decrease gastric emptying rate and to inhibit areas in the central nervous system involved in hedonic feeding are not sustained during prolonged treatment.29, 30 In line with these observations, we recently suggested that tachyphylaxis and/or induction of compensatory mechanisms at the tubular level explains that only short-acting GLP-1RA harbor sustained natriuretic and urine alkalizing actions during prolonged treatment.23, 28 We hypothesised that such divergent actions could also emerge with respect to tubular UA-handling. Indeed, 12-week treatment with the long-acting GLP-1RA liraglutide compared to placebo did not affect UEUA. Interestingly, although 8-week treatment with the short-acting GLP-1RA lixisenatide increased UEUA compared to insulin glulisine, this was entirely mediated by an anti-uricosuric effect in the insulin glulisine-arm. Thus, these results do not indicate that lixisenatide affects UEUA. Finally, UA-levels were unaffected by either GLP-1RAs in our prolonged intervention studies despite decreases in bodyweight (potentially improving insulin resistance).42
In comparison, the initial stimulating effects of an SGLT2 inhibitor on UEUA also seems to wane upon prolonged intervention, as suggested by a mechanistic study in healthy subjects and in vitro transport experiments.43 However, in contrast to current GLP-1RA data, chronic SGLT2 inhibitor therapy does have a sustained suppressive effect on plasma-UA,36 suggesting that these drugs establish a new steady state in UA-metabolism and clearance.
Notably, our correlation analyses suggest that prolonged GLP-1RA treatment may lower plasma-UA in T2DM patients with higher baseline plasma-UA levels. However, as a similar relation is observed in patients treated with insulin glulisine, a glucose-dependent mechanism is suggested.35 In line, individual responses in renal UA-handling did not associate with changes in plasma-UA, although the isolated correlation of changes in absolute-UEUA with plasma-UA in patients treated with lixisenatide merits further research.
The described studies are not without limitations. First, intestinal UA-excretion or UA-formation was not assessed. Such measurements are technically challenging, and intestinal excretion was not expected to be affected substantially.3 UA-formation could theoretically be influenced by treatment through alterations in circulating fructose levels.35 We did not assess fructose levels in these trials, but emphasise that this would be confounded by glucose-lowering. Second, we did not measure UA-crystallization as the increment in urine-pH dramatically improves UA solubility (especially when pH >6.0-6.5),44 rendering the likelihood of precipitation negligible. It is tempting to speculate that this would potentially also prevent UA-mediated tubulopathy.35 However, we did not observe any effects on glomerular and tubular injury markers (albumin-creatinine ratio, KIM-1 or NGAL) as previously reported in T2DM patients without overt nephropathy.23, 24, 28 Third, since the intervention conditions in Study-A were performed sequentially, we cannot exclude time-dependent effects. This may explain the somewhat unexpected slight increase in plasma-UA after immediate exenatide-infusion in healthy subjects. Fourth, our T2DM population had a prolonged history of diabetes and we did not specifically include patients with (symptomatic or asymptomatic) hyperuricemia, which does not allow generalisation of the current data to patients with a shorter diabetes-history and/or higher UA-levels at baseline.33, 45 Fifth, T2DM patients in Study-B and Study-C had relatively low cardiovascular risk, while the duration of follow-up in Study-C and Study-D was relatively short, which may hamper direct generalisation to the recently published GLP-1RA cardiovascular outcome trials. Interestingly, the association between UA levels and progression of renal disease in diabetes appears, however, to be present only in healthier subjects, i.e. those with earlier stages of chronic kidney disease (CKD),46 and is lost in more advanced CKD.47, 48 Sixth, effects of lixisenatide were investigated in the postprandial state and an active comparator was used instead of placebo, which may have led to a more heterogeneous response and hampers direct comparison with the other reported studies that were performed in the fasting state. Seventh, lixisenatide markedly slows gastric emptying rate,23 which could affect purine uptake in the postprandial state. However, the effects of the mixed breakfast on plasma-UA and UEUA were minor at baseline. Finally, although we did not test prolonged treatment effects of exenatide twice-daily, the drug is structurally similar to lixisenatide, and harbors comparable pharmacokinetic and pharmacodynamic properties.49 As such, we believe it is unlikely that prolonged treatment this formulation of exenatide would result in differential effects on kidney UA-clearance and/or UA-levels.
In conclusion, immediate exenatide-infusion increases UEUA in healthy overweight males and T2DM patients by increasing UEUA, possibly mediated by GLP-1RA–induced NHE3-inhibition in the proximal tubule and/or consequent urine alkalization. Prolonged treatment with the long-acting GLP-1RA liraglutide or the short-acting GLP-1RA lixisenatide does not affect UEUA or UA-levels in T2DM patients with normal plasma UA-levels and relatively low cardiovascular risk. Our results indicate that it is unlikely that UA is a relevant mediator of the cardiovascular and renal benefits of GLP-1RA.
Supplementary Material
Acknowledgments
The authors extend their gratitude to all study participants who took part in these studies for their time and commitment to the demanding protocols. We thank J. Boerop and S. Gassman (Diabetes Center, Department of Internal Medicine, VU University Medical Center, Amsterdam, The Netherlands) for their excellent practical support during the test visits. The technical laboratory assistance of A. Dijk and N. Willekes-Koolschijn (Department of Nephrology and Hypertension, University Medical Center, Utrecht, The Netherlands) was much appreciated. We thank Dr. R.G. IJzerman for his clinical guidance whenever that was needed during the conduct of Study-D. Parts of the data from study-B and study-C were presented at the 76th Scientific Sessions of the American Diabetes Association (New Orleans, LA, 10–14 June 2016).
Funding
The research leading to the results of Studies A to C has received funding from the European Community's Seventh Framework Programme (FP7/2007-2013) under grant agreement n° 282521 – the SAFEGUARD project; and the Dutch Kidney Foundation, under grant agreement IP12.87. For Study-C Novo Nordisk provided liraglutide and liraglutide-placebo pens. Study-D was an investigator-initiated study, entirely planned and conducted under the scientific supervision of M.D. and, after her passing in 2014, D.H.v.R. and M.H.H.K. Funding for the study was provided by Sanofi-Aventis. Sanofi-Aventis provided prefilled lixisenatide and insulin glulisine pens for subcutaneous use. Self-monitoring blood glucose devices were provided by Menarini Diagnostics. Funders of all studies had no role in the study design, in collection, analysis, and interpretation of data, in the writing of the report or in the decision to submit the article for publication. P.B. received salary support from NIH/NIDDK T32 DK063687.
Disclosures
L.T. consulted for Eli Lilly & Co., and M.H.A.M. consulted for Eli Lilly & Co. and Novo Nordisk. Through M.H.H. Kramer and M. Diamant, the VU University Medical Center received research grants from AstraZeneca, Boehringer Ingelheim, Novo Nordisk and Sanofi. D.H.vR. serves on advisory boards for AstraZeneca, Merck Sharp & Dohme, Novo Nordisk and Sanofi. The above authors declare that they did not receive personal fees in connection to their roles described above; all honoraria were paid to their employer (the VU University Medical Center, Amsterdam, The Netherlands). PB has a consultancy agreement with Boehringer Ingelheim.
Footnotes
No other potential conflicts of interest relevant to this article are reported.
Author contributions
L.T. designed Study-D, performed the measurements, analysed and interpreted the data and drafted and completed the final manuscript. M.H.A.M. designed Study-D, performed measurements, was involved in statistical analyses, interpretation of the data, and contributed to the drafting and critical revision of the manuscript. M.M.S. designed Studies A to C, performed measurements, was involved in statistical analyses, and contributed to the critical revision of the manuscript. M.D. designed all studies and was initially involved in the discussion and supervision. P.B., M.H.H.K, E.J.H., J.A.J. and D.H.v.R. contributed to the interpretation of the data, discussion of the intellectual content and critical editing of the manuscript.
References
- 1.Low RK, Stoller ML. Uric acid-related nephrolithiasis. Urol Clin North Am. 1997;24:135–148. doi: 10.1016/s0094-0143(05)70359-1. [DOI] [PubMed] [Google Scholar]
- 2.Mandal AK, Mount DB. The molecular physiology of uric acid homeostasis. Annu Rev Physiol. 2015;77:323–345. doi: 10.1146/annurev-physiol-021113-170343. [DOI] [PubMed] [Google Scholar]
- 3.Anzai N, Endou H. Drug discovery for hyperuricemia. Expert Opin Drug Discov. 2007;2:1251–1261. doi: 10.1517/17460441.2.9.1251. [DOI] [PubMed] [Google Scholar]
- 4.Lytvyn Y, Perkins BA, Cherney DZ. Uric acid as a biomarker and a therapeutic target in diabetes. Can J Diabetes. 2015;39:239–246. doi: 10.1016/j.jcjd.2014.10.013. [DOI] [PubMed] [Google Scholar]
- 5.Lipkowitz MS. Regulation of uric acid excretion by the kidney. Curr Rheumatol Rep. 2012;14:179–188. doi: 10.1007/s11926-012-0240-z. [DOI] [PubMed] [Google Scholar]
- 6.Maiuolo J, Oppedisano F, Gratteri S, Muscoli C, Mollace V. Regulation of uric acid metabolism and excretion. Int J Cardiol. 2016;213:8–14. doi: 10.1016/j.ijcard.2015.08.109. [DOI] [PubMed] [Google Scholar]
- 7.Ficociello LH, Rosolowsky ET, Niewczas MA, et al. High-normal serum uric acid increases risk of early progressive renal function loss in type 1 diabetes: results of a 6-year follow-up. Diabetes Care. 2010;33:1337–1343. doi: 10.2337/dc10-0227. [DOI] [PMC free article] [PubMed] [Google Scholar]
- 8.Li X, Meng X, Timofeeva M, et al. Serum uric acid levels and multiple health outcomes: umbrella review of evidence from observational studies, randomised controlled trials, and Mendelian randomisation studies. BMJ. 2017;357:j2376. doi: 10.1136/bmj.j2376. [DOI] [PMC free article] [PubMed] [Google Scholar]
- 9.Kao MP, Ang DS, Gandy SJ, et al. Allopurinol benefits left ventricular mass and endothelial dysfunction in chronic kidney disease. J Am Soc Nephrol. 2011;22:1382–1389. doi: 10.1681/ASN.2010111185. [DOI] [PMC free article] [PubMed] [Google Scholar]
- 10.MacIsaac RL, Salatzki J, Higgins P, et al. Allopurinol and Cardiovascular Outcomes in Adults With Hypertension. Hypertension. 2016;67:535–540. doi: 10.1161/HYPERTENSIONAHA.115.06344. [DOI] [PubMed] [Google Scholar]
- 11.Su X, Xu B, Yan B, Qiao X, Wang L. Effects of uric acid-lowering therapy in patients with chronic kidney disease: A meta-analysis. PLoS One. 2017;12:e0187550. doi: 10.1371/journal.pone.0187550. [DOI] [PMC free article] [PubMed] [Google Scholar]
- 12.Mann JFE, Orsted DD, Brown-Frandsen K, et al. Liraglutide and Renal Outcomes in Type 2 Diabetes. N Engl J Med. 2017;377:839–848. doi: 10.1056/NEJMoa1616011. [DOI] [PubMed] [Google Scholar]
- 13.Marso SP, Daniels GH, Brown-Frandsen K, et al. Liraglutide and Cardiovascular Outcomes in Type 2 Diabetes. N Engl J Med. 2016;375:311–322. doi: 10.1056/NEJMoa1603827. [DOI] [PMC free article] [PubMed] [Google Scholar]
- 14.Marso SP, Bain SC, Consoli A, et al. Semaglutide and Cardiovascular Outcomes in Patients with Type 2 Diabetes. N Engl J Med. 2016;375:1834–1844. doi: 10.1056/NEJMoa1607141. [DOI] [PubMed] [Google Scholar]
- 15.Holman RR, Bethel MA, Mentz RJ, et al. Effects of Once-Weekly Exenatide on Cardiovascular Outcomes in Type 2 Diabetes. N Engl J Med. 2017;377:1228–1239. doi: 10.1056/NEJMoa1612917. [DOI] [PMC free article] [PubMed] [Google Scholar]
- 16.Wanner C, Inzucchi SE, Lachin JM, et al. Empagliflozin and Progression of Kidney Disease in Type 2 Diabetes. N Engl J Med. 2016;375:323–334. doi: 10.1056/NEJMoa1515920. [DOI] [PubMed] [Google Scholar]
- 17.Zinman B, Wanner C, Lachin JM, et al. Empagliflozin, Cardiovascular Outcomes, and Mortality in Type 2 Diabetes. N Engl J Med. 2015;373:2117–2128. doi: 10.1056/NEJMoa1504720. [DOI] [PubMed] [Google Scholar]
- 18.Neal B, Perkovic V, Mahaffey KW, et al. Canagliflozin and Cardiovascular and Renal Events in Type 2 Diabetes. N Engl J Med. 2017;377:644–657. doi: 10.1056/NEJMoa1611925. [DOI] [PubMed] [Google Scholar]
- 19.Zhao Y, Xu L, Tian D, et al. Effects of sodium-glucose co-transporter 2 (SGLT2) inhibitors on serum uric acid level: A meta-analysis of randomized controlled trials. Diabetes Obes Metab. 2017 doi: 10.1111/dom.13101. [DOI] [PubMed] [Google Scholar]
- 20.Lotfy M, Singh J, Rashed H, Tariq S, Zilahi E, Adeghate E. The effect of glucagon-like peptide-1 in the management of diabetes mellitus: cellular and molecular mechanisms. Cell Tissue Res. 2014;358:343–358. doi: 10.1007/s00441-014-1959-9. [DOI] [PubMed] [Google Scholar]
- 21.Muskiet MH, Tonneijck L, Smits MM, et al. Acute renal haemodynamic effects of glucagon-like peptide-1 receptor agonist exenatide in healthy overweight men. Diabetes Obes Metab. 2016;18:178–185. doi: 10.1111/dom.12601. [DOI] [PubMed] [Google Scholar]
- 22.Muskiet MHA, Tonneijck L, Smits MM, et al. GLP-1 and the kidney: from physiology to pharmacology and outcomes in diabetes. Nat Rev Nephrol. 2017;13:605–628. doi: 10.1038/nrneph.2017.123. [DOI] [PubMed] [Google Scholar]
- 23.Tonneijck L, Muskiet MHA, Smits MM, et al. Postprandial renal haemodynamic effect of lixisenatide vs once-daily insulin-glulisine in patients with type 2 diabetes on insulin-glargine: An 8-week, randomised, open-label trial. Diabetes Obes Metab. 2017;19:1669–1680. doi: 10.1111/dom.12985. [DOI] [PubMed] [Google Scholar]
- 24.Tonneijck L, Smits MM, Muskiet MHA, et al. Acute renal effects of the GLP-1 receptor agonist exenatide in overweight type 2 diabetes patients: a randomised, double-blind, placebo-controlled trial. Diabetologia. 2016;59:1412–1421. doi: 10.1007/s00125-016-3938-z. [DOI] [PMC free article] [PubMed] [Google Scholar]
- 25.Hagos Y, Stein D, Ugele B, Burckhardt G, Bahn A. Human renal organic anion transporter 4 operates as an asymmetric urate transporter. J Am Soc Nephrol. 2007;18:430–439. doi: 10.1681/ASN.2006040415. [DOI] [PubMed] [Google Scholar]
- 26.Kanbara A, Hakoda M, Seyama I. Urine alkalization facilitates uric acid excretion. Nutr J. 2010;9:45. doi: 10.1186/1475-2891-9-45. [DOI] [PMC free article] [PubMed] [Google Scholar]
- 27.Kanbara A, Miura Y, Hyogo H, Chayama K, Seyama I. Effect of urine pH changed by dietary intervention on uric acid clearance mechanism of pH-dependent excretion of urinary uric acid. Nutr J. 2012;11:39. doi: 10.1186/1475-2891-11-39. [DOI] [PMC free article] [PubMed] [Google Scholar]
- 28.Tonneijck L, Smits MM, Muskiet MH, et al. Renal Effects of DPP-4 Inhibitor Sitagliptin or GLP-1 Receptor Agonist Liraglutide in Overweight Patients With Type 2 Diabetes: A 12-Week, Randomized, Double-Blind, Placebo-Controlled Trial. Diabetes Care. 2016;39:2042–2050. doi: 10.2337/dc16-1371. [DOI] [PubMed] [Google Scholar]
- 29.Meier JJ, Rosenstock J, Hincelin-Mery A, et al. Contrasting Effects of Lixisenatide and Liraglutide on Postprandial Glycemic Control, Gastric Emptying, and Safety Parameters in Patients With Type 2 Diabetes on Optimized Insulin Glargine With or Without Metformin: A Randomized, Open-Label Trial. Diabetes Care. 2015;38:1263–1273. doi: 10.2337/dc14-1984. [DOI] [PubMed] [Google Scholar]
- 30.Ten Kulve JS, Veltman DJ, van Bloemendaal L, et al. Liraglutide Reduces CNS Activation in Response to Visual Food Cues Only After Short-term Treatment in Patients With Type 2 Diabetes. Diabetes Care. 2016;39:214–221. doi: 10.2337/dc15-0772. [DOI] [PubMed] [Google Scholar]
- 31.Smits MM, Tonneijck L, Muskiet MH, et al. Cardiovascular, renal and gastrointestinal effects of incretin-based therapies: an acute and 12-week randomised, double-blind, placebo-controlled, mechanistic intervention trial in type 2 diabetes. BMJ Open. 2015;5:e009579. doi: 10.1136/bmjopen-2015-009579. [DOI] [PMC free article] [PubMed] [Google Scholar]
- 32.Muskiet MH, Tonneijck L, Smits MM, Kramer MH, Heerspink HJ, van Raalte DH. Pleiotropic effects of type 2 diabetes management strategies on renal risk factors. Lancet Diabetes Endocrinol. 2015;3:367–381. doi: 10.1016/S2213-8587(15)00030-3. [DOI] [PubMed] [Google Scholar]
- 33.Bo S, Cavallo-Perin P, Gentile L, Repetti E, Pagano G. Hypouricemia and hyperuricemia in type 2 diabetes: two different phenotypes. Eur J Clin Invest. 2001;31:318–321. doi: 10.1046/j.1365-2362.2001.00812.x. [DOI] [PubMed] [Google Scholar]
- 34.Bobulescu IA, Moe OW. Renal transport of uric acid: evolving concepts and uncertainties. Adv Chronic Kidney Dis. 2012;19:358–371. doi: 10.1053/j.ackd.2012.07.009. [DOI] [PMC free article] [PubMed] [Google Scholar]
- 35.Bjornstad P, Lanaspa MA, Ishimoto T, et al. Fructose and uric acid in diabetic nephropathy. Diabetologia. 2015;58:1993–2002. doi: 10.1007/s00125-015-3650-4. [DOI] [PMC free article] [PubMed] [Google Scholar]
- 36.Davies MJ, Trujillo A, Vijapurkar U, Damaraju CV, Meininger G. Effect of canagliflozin on serum uric acid in patients with type 2 diabetes mellitus. Diabetes Obes Metab. 2015;17:426–429. doi: 10.1111/dom.12439. [DOI] [PMC free article] [PubMed] [Google Scholar]
- 37.Gutzwiller JP, Tschopp S, Bock A, et al. Glucagon-like peptide 1 induces natriuresis in healthy subjects and in insulin-resistant obese men. J Clin Endocrinol Metab. 2004;89:3055–3061. doi: 10.1210/jc.2003-031403. [DOI] [PubMed] [Google Scholar]
- 38.Skov J, Dejgaard A, Frokiaer J, et al. Glucagon-like peptide-1 (GLP-1): effect on kidney hemodynamics and renin-angiotensin-aldosterone system in healthy men. J Clin Endocrinol Metab. 2013;98:E664–E671. doi: 10.1210/jc.2012-3855. [DOI] [PubMed] [Google Scholar]
- 39.Skov J, Pedersen M, Holst JJ, et al. Short-term effects of liraglutide on kidney function and vasoactive hormones in type 2 diabetes: a randomized clinical trial. Diabetes Obes Metab. 2016;18:581–589. doi: 10.1111/dom.12651. [DOI] [PubMed] [Google Scholar]
- 40.Lovshin JA, Barnie A, DeAlmeida A, Logan A, Zinman B, Drucker DJ. Liraglutide promotes natriuresis but does not increase circulating levels of atrial natriuretic peptide in hypertensive subjects with type 2 diabetes. Diabetes Care. 2015;38:132–139. doi: 10.2337/dc14-1958. [DOI] [PubMed] [Google Scholar]
- 41.von Scholten BJ, Persson F, Rosenlund S, et al. The effect of liraglutide on renal function: A randomized clinical trial. Diabetes Obes Metab. 2017;19:239–247. doi: 10.1111/dom.12808. [DOI] [PubMed] [Google Scholar]
- 42.Nielsen SM, Bartels EM, Henriksen M, et al. Weight loss for overweight and obese individuals with gout: a systematic review of longitudinal studies. Ann Rheum Dis. 2017;76:1870–1882. doi: 10.1136/annrheumdis-2017-211472. [DOI] [PMC free article] [PubMed] [Google Scholar]
- 43.Chino Y, Samukawa Y, Sakai S, et al. SGLT2 inhibitor lowers serum uric acid through alteration of uric acid transport activity in renal tubule by increased glycosuria. Biopharm Drug Dispos. 2014;35:391–404. doi: 10.1002/bdd.1909. [DOI] [PMC free article] [PubMed] [Google Scholar]
- 44.Halbirk M, Norrelund H, Moller N, et al. Cardiovascular and metabolic effects of 48-h glucagon-like peptide-1 infusion in compensated chronic patients with heart failure. Am J Physiol Heart Circ Physiol. 2010;298:H1096–1102. doi: 10.1152/ajpheart.00930.2009. [DOI] [PubMed] [Google Scholar]
- 45.Yuan HJ, Yang XG, Shi XY, Tian R, Zhao ZG. Association of serum uric acid with different levels of glucose and related factors. Chin Med J (Engl) 2011;124:1443–1448. [PubMed] [Google Scholar]
- 46.De Cosmo S, Viazzi F, Pacilli A, et al. Serum Uric Acid and Risk of CKD in Type 2 Diabetes. Clin J Am Soc Nephrol. 2015;10:1921–1929. doi: 10.2215/CJN.03140315. [DOI] [PMC free article] [PubMed] [Google Scholar]
- 47.Nacak H, van Diepen M, de Goeij MC, Rotmans JI, Dekker FW, group P-s Uric acid: association with rate of renal function decline and time until start of dialysis in incident pre-dialysis patients. BMC Nephrol. 2014;15:91. doi: 10.1186/1471-2369-15-91. [DOI] [PMC free article] [PubMed] [Google Scholar]
- 48.Nacak H, van Diepen M, Qureshi AR, et al. Uric acid is not associated with decline in renal function or time to renal replacement therapy initiation in a referred cohort of patients with Stage III, IV and V chronic kidney disease. Nephrol Dial Transplant. 2015;30:2039–2045. doi: 10.1093/ndt/gfv225. [DOI] [PMC free article] [PubMed] [Google Scholar]
- 49.Meier JJ. GLP-1 receptor agonists for individualized treatment of type 2 diabetes mellitus. Nat Rev Endocrinol. 2012;8:728–742. doi: 10.1038/nrendo.2012.140. [DOI] [PubMed] [Google Scholar]
Associated Data
This section collects any data citations, data availability statements, or supplementary materials included in this article.