

Abstract
Key points
T‐wave alternans (TWA) and T‐wave lability (TWL) are precursors of ventricular arrhythmias in long QT syndrome; however, the mechanistic link remains to be clarified.
Computer simulations show that action potential duration (APD) prolongation and slowed heart rates promote APD alternans and chaos, manifesting as TWA and TWL, respectively.
Regional APD alternans and chaos can exacerbate pre‐existing or induce de novo APD dispersion, which combines with enhanced I Ca,L to result in premature ventricular complexes (PVCs) originating from the APD gradient region.
These PVCs can directly degenerate into re‐entrant arrhythmias without the need for an additional tissue substrate or further exacerbate the APD dispersion to cause spontaneous initiation of ventricular arrhythmias.
Experiments conducted in transgenic long QT rabbits show that PVC alternans occurs at slow heart rates, preceding spontaneous intuition of ventricular arrhythmias.
Abstract
T‐wave alternans (TWA) and irregular beat‐to‐beat T‐wave variability or T‐wave lability (TWL), the ECG manifestations of action potential duration (APD) alternans and variability, are precursors of ventricular arrhythmias in long QT syndromes. TWA and TWL in patients tend to occur at normal heart rates and are usually potentiated by bradycardia. Whether or how TWA and TWL at normal or slow heart rates are causally linked to arrhythmogenesis remains unknown. In the present study, we used computer simulations and experiments of a transgenic rabbit model of long QT syndrome to investigate the underlying mechanisms. Computer simulations showed that APD prolongation and slowed heart rates caused early afterdepolarization‐mediated APD alternans and chaos, manifesting as TWA and TWL, respectively. Regional APD alternans and chaos exacerbated pre‐existing APD dispersion and, in addition, APD chaos could also induce APD dispersion de novo via chaos desynchronization. Increased APD dispersion, combined with substantially enhanced I Ca,L, resulted in a tissue‐scale dynamical instability that gave rise to the spontaneous occurrence of unidirectionally propagating premature ventricular complexes (PVCs) originating from the APD gradient region. These PVCs could directly degenerate into re‐entrant arrhythmias without the need for an additional tissue substrate or could block the following sinus beat to result in a longer RR interval, which further exacerbated the APD dispersion giving rise to the spontaneous occurrence of ventricular arrhythmias. Slow heart rate‐induced PVC alternans was observed in experiments of transgenic LQT2 rabbits under isoproterenol, which was associated with increased APD dispersion and spontaneous occurrence of ventricular arrhythmias, in agreement with the theoretical predictions.
Keywords: T‐wave alternans, QT prolongation, dispersion of repolarization, Torsade de Pointes
Key points
T‐wave alternans (TWA) and T‐wave lability (TWL) are precursors of ventricular arrhythmias in long QT syndrome; however, the mechanistic link remains to be clarified.
Computer simulations show that action potential duration (APD) prolongation and slowed heart rates promote APD alternans and chaos, manifesting as TWA and TWL, respectively.
Regional APD alternans and chaos can exacerbate pre‐existing or induce de novo APD dispersion, which combines with enhanced I Ca,L to result in premature ventricular complexes (PVCs) originating from the APD gradient region.
These PVCs can directly degenerate into re‐entrant arrhythmias without the need for an additional tissue substrate or further exacerbate the APD dispersion to cause spontaneous initiation of ventricular arrhythmias.
Experiments conducted in transgenic long QT rabbits show that PVC alternans occurs at slow heart rates, preceding spontaneous intuition of ventricular arrhythmias.
Introduction
T‐wave alternans (TWA) and irregular beat‐to‐beat variability or T‐wave lability (TWL) are widely observed ECG precursors of lethal arrhythmias and sudden cardiac death (Traube, 1872; Schwartz & Malliani, 1975; Zareba et al. 1994; Berger et al. 1997; Armoundas et al. 2000, 2002; Rosenbaum, 2001; Nemec et al. 2003; Narayan, 2006; Drew et al. 2010). Whether or how TWA and TWL are causally linked to arrhythmogenesis in the clinical setting remains unknown.
The corresponding cellular phenomenon to TWA is action potential duration (APD) alternans in ventricles. APD alternans have been widely investigated in experiments and computer models and the underlying mechanisms are mainly attributed to steep APD restitution and intracellular calcium (Ca2+) cycling instabilities (Qu et al. 2010; Qu & Weiss, 2015). APD alternans resulting from these mechanisms requires the engagement of a steep change in refractoriness of the ion channels, which usually occurs when the diastolic interval (DI) is short or the heart rate is fast. This agrees with the fact that APD alternans is usually induced by fast pacing in experiments (Cao et al. 1999; Pastore et al. 1999; Christini et al. 2006; Choi et al. 2007; Hayashi et al. 2007; Mironov et al. 2008; Cutler et al. 2009; Wilson et al. 2009; Ziv et al. 2009; Lau et al. 2015; Prudat et al. 2016; Zhou et al. 2016) and simulations (Qu et al. 2000; ten Tusscher & Panfilov, 2006; Zhu & Clancy, 2007; Tao et al. 2008; Wang et al. 2016; Zhou et al. 2016), typically 2–5 Hz or even faster. Irregular beat‐to‐beat APD variability or APD chaos, which can be a candidate mechanism of TWL, has also been shown to be potentiated by fast pacing (Guevara et al. 1981; Chialvo et al. 1990; Watanabe et al. 1995). The mechanistic link between APD alternans and arrhythmias is via a spatially discordant alternans that serves as a tissue substrate for re‐entry to form (Cao et al. 1999; Pastore et al. 1999; Qu et al. 2000; Choi et al. 2007). The development of discordant alternans requires the engagement of conduction velocity restitution (Cao et al. 1999; Qu et al. 2000; Hayashi et al. 2007; Mironov et al. 2008) and conduction velocity restitution is mainly determined by sodium (Na+) channel recovery, which also occurs at short DIs or fast heart rates.
By contrast to APD alternans and chaos induced by fast heart rates in experiments and simulations, TWA and TWL in patients typically occur at normal heart rates (∼1 Hz) and are usually potentiated by bradycardia (Brockmeier et al. 2001; Grabowski et al. 2004; Feldman & Campagna, 2006; Wegener et al. 2008; Holley & Cooper, 2009; Drew et al. 2010; Liu et al. 2013; Shu et al. 2014). In recent studies (Sato et al. 2009; Qu et al. 2010; Qu & Chung, 2012; Landaw et al. 2017), we have shown that APD alternans and chaos can occur at normal or slow heart rates under the condition of reduced repolarization reserve (long QT). Under the long QT condition, the occurrence of early afterdepolarization (EAD) results in an all‐or‐none behaviour, which causes a steep APD response that is responsible for the genesis of APD alternans and chaos. EAD‐mediated chaos has been demonstrated in experiments conducted in rabbits (Sato et al. 2009, 2010). EAD‐mediated alternans has also been observed in experiments in rabbits (Guo et al. 2008; Liu et al. 2013). However, whether or how APD alternans and chaos occurring at normal or slow heart rates is causally linked to the initiation of arrhythmias remains to be clarified.
In the present study, we used computer simulation and rabbit experiments to investigate the mechanisms linking TWA and TWL to arrhythmogenesis under conditions of QT prolongation. We show that regional APD alternans and chaos occurred by APD lengthening and the occurrence of EADs, manifesting as TWA and TWL in the ECG. APD alternans and chaos can exacerbate pre‐existing or induce de novo APD dispersion in tissue. Differing from the traditional understanding that enhanced APD dispersion potentiates a tissue substrate for conduction block, we show that the enhanced APD dispersion, combined with an excessive increase in L‐type Ca2+ current (I Ca,L), could result in a tissue‐scale dynamical instability leading to the spontaneous genesis of premature ventricular complexes (PVCs). As result of APD alternans and chaos, PVC alternans and more complex PVC patterns occurred. The PVCs could directly degenerate into re‐entrant arrhythmias without the need for an additional tissue substrate, or they could block the following sinus beat to result in a longer RR interval, which further exacerbated the APD dispersion to cause spontaneous occurrence of ventricular arrhythmias. Experimentally, LQT2 rabbits showed frequent PVC alternans that caused increase of APD dispersion and initiation of polymorphic ventricular tachycardia (pVT) under isoproterenol, in agreement with the theoretical predictions.
Methods
Ethical approval
The experimental investigation in the present study conformed with the current Guide for Care and Use of Laboratory Animals published by the National Institutes of Health (NIH Publication No. 85‐23, revised 2011) and was approved by the Lifespan Animal Welfare Committee at Rhode Island Hospital.
Computer simulations
Computer simulations were carried out using monodomain tissue models, including 1D cable and isotropic 2D tissue models, with voltage (V) described by the following partial differential equation:
| (1) |
for the 1D cable model and:
| (2) |
for the 2D tissue model. In eqns (1) and (2), C m is the membrane capacitance and was set to C m = 1 μF cm−2 and D is the diffusion constant, which is proportional to the gap junction conductance, and was set to 0.0005 cm2/ms for both 1D cable and 2D tissue. An Euler method with Δx = Δy = 0.015 cm and Δt = 0.01 ms was used for numerical integration of eqns (1) and (2). All computer simulations were performed on Tesla GPUs (NVIDIA Corp., Santa Clara, CA, USA) with software written in the CUDA programing language.
I ion was taken from the rabbit ventricular action potential model by Huang et al. (2016), which was modified from the model developed by Mahajan et al. (2008). Specifically, the Markovian L‐type Ca2+ channel formulation in the model of Mahajan et al. (2008) was replaced with a Hodgkin–Huxley‐type formulation. This modification allows us to more precisely change the window I Ca,L to generate EADs. A detailed justification and mathematical formulation were provided previously by Huang et al. (2016).
We simulated a condition of type 2 LQTS (LQT2) in which QT prolongation was simulated by removing the fast component of the delayed rectifier potassium current (I Kr) (i.e. we set G Kr = 0). Repolarization and APD heterogeneities were modelled by spatial distributions of the slow component of the delayed rectifier potassium current (I Ks) (Fig. 1 A, inset). The length of the 1D cable was 200 cells (3 cm). The maximum conductance of I Ks in one half of the cable (100 cells) was set as G Ks2 and the other half was set as G Ks1. G Ks1 = 1 mS cm−2 for all simulations, whereas G Ks2 was set to 0.6 or 0.7 mS cm−2 depending on the simulation, which is specified as appropriate. Periodic stimuli were applied from the long APD end (the first five cells) of the cable with a pulse strength 50 μA cm−2 (Fig. 1 A). In 2D tissue, the APD heterogeneity was simulated by assigning a smaller G Ks (G Ks2 = 0.6 mS cm−2) in a circular region in the tissue.
Figure 1. Regional APD alternans and chaos induced by QT prolongation in a heterogeneous 1D cable.
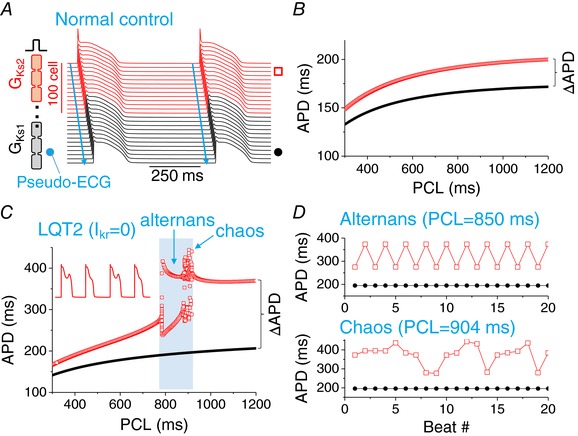
A, schematic plot of the 1D cable model and a space‐time plot of voltage for two beats from a simulation of normal control (PCL = 600 ms). The length of the cable is 200 cells. The normal control model was the same as in our previous study (Huang et al. 2016) with the parameters: G Ca,L = 50 mmol/(cm,C) for the whole cable, G Ks2 = 0.6 mS cm−2 for the first 100 cells (red, long APD region) and G Ks1 = 1 mS cm−2 for the next 100 cells (black, short APD region). The stimulus was applied from the long APD end of the cable as marked. The arrows indicate the direction of propagation. The location of ECG electrode is at the short APD end of the cable as marked. B, APD versus PCL for the normal control recorded from the two sites as indicated in (A). C, APD versus PCL for I Kr blocked. The parameters are the same as for (A) except G Kr = 0. APDs from 20 consecutive pacing beats were plotted for each PCL. D, voltage versus time and APD versus beat number (#) from the two recording sites in the alternans regime (PCL = 850 ms). E, same as (D) but in the chaotic regime (PCL = 904 ms). F, same as (D) but in the stable regime (PCL = 1000 ms). [Color figure can be viewed at http://wileyonlinelibrary.com]
The maximum conductance of I Ca,L for normal control was G Ca,L = 50 mmol/(cm,C), which is the same as reported in Huang et al. (2016). We increased G Ca,L to simulate the effect of isoproterenol. Isoproterenol also affects many other ionic currents, such as I Ks, as well as the functions of Ca2+ cycling proteins (Xie et al. 2013). However, based on the study by Liu et al. (2012), the increase of the maximum conductance of I Ca,L occurs much more quickly than that of I Ks after isoproterenol infusion (averaged time constant 9.2 s and 43.6 s, respectively (Liu et al. 2012). As shown by Liu et al. (2012) and Xie et al. (2013), as a result of the difference in the time course of I Ca,L and I Ks elevation, EADs can be induced in a varying time windows after application of isoproterenol or β‐adrenergic stimulation because of the faster increase of I Ca,L conductance. Therefore, to facilitate a clean exploration of the underlying dynamics, we only increased the maximum conductance of ICa,L to simulate the immediate effect of isoproterenol; additional justifications are provided in Huang et al. (2016).
Pseudo‐ECGs were calculated using the formula (Sadrieh et al. 2014):
| (3) |
where and (x 0, y 0, z 0) is the position of the ECG electrode. For the 1D cable, the electrode was placed at the short APD end of the cable as indicated in Fig. 1 A.
Rabbit experiments
Transgenic LQT2 rabbits (Brunner et al. 2008) were euthanized with buprenorphene (0.03 mg kg−1 i.m.), acepromazine (0.5 mg kg−1 i.m.), xylazene (15 mg kg−1 i.m.), ketamine (60 mg kg−1 i.m.), pentothal (35 mg kg−1 IV) and heparin (200 U kg−1). Hearts were excised, retrogradely perfused through the aorta, with (in mmol L−1) 130 NaCl, 24 NaHCO3, 1.0 MgCl2, 4.0 KCl, 1.2 NaH2PO4, 5 dextrose and 1.25 CaCl2 (pH 7.4), then gassed with 95% O2 and 5% CO2, and stained with voltage‐sensitive dye, di‐4‐ANEPPS or RH‐237 (Invitrogen, Carlsad, CA, USA). Hearts were placed in a water‐heated chamber to maintain temperature at 37.0 ± 0.2 °C and then 5 μmol L−1 blebbistatin was added to reduce movement artefacts. Perfusion rate was set to 20 mL min−1. ECGs were monitored continuously with a Powerlab system (AD Instruments, Sydney, Australia). In total, 33 LQT2 rabbits were used in this project. The atrioventricular (AV) node was ablated to control heart rate using a cautery unit (World Precision Instruments, Sarasota, FL, USA). After ablation, the rabbits exhibited a slower heart rate, with the cycle length typically ranging from 700 ms to 2000 ms. If the cycle length was longer than 2000 ms, the base of the right ventricle was paced at a cycle length of 2000 ms. Isoproterenol was delivered as a bolus injection via the bubble trap (5 mL, 140 nm) to hearts to trigger ectopic excitations and pVT. Fluorescence images of action potentials were recorded from the anterior surface of the heart using a CMOS camera (100 × 100 pixels, 1000 frames s−1, 2.0 × 2.0 cm2 field of view; Ultima‐L, SciMedia, Japan). Activation maps and APD maps were generated using dF/dt for activation and dF 2/dt 2 for repolarization using digital image analysis routines as described previously (Kim et al. 2015). APD dispersion (ΔAPD) was measured by calculating APDmax – APDmin from APD maps. The values are represented as the mean ± SD. PVC dynamics from LQT2 rabbits were complex, showing 1:1 ∼ 3:1 and more complex patterns under isoproterenol, frequently followed by pVTs. In the present study, only PVC alternans were analysed to simplify data analysis and comparison with the non‐PVC group.
Results
APD lengthening results in regional APD alternans and chaos, as well as an abrupt increase in dispersion of repolarization
We simulated a heterogeneous 1D cable of coupled rabbit ventricular myocytes (Fig. 1 A), where I Ks is smaller in one half of the cable (red) than in the other half (black). The cable was paced from the long APD side with a constant pacing cycle length (PCL). For normal control, no alternans or other complex APD behaviours occurred for PCL from 300 ms to 1200 ms (Fig. 1 B). At PCL = 300 ms, APD was 148 ms in the long APD region and 132 ms in the short APD region, and increased to 200 ms and 172 ms at PCL = 1200 ms, respectively. Thus, the APD difference of the two regions (ΔAPD) increased from 16 ms to 28 ms. Under normal conditions, the dispersion of repolarization only had a small increase as the pacing rate decreased.
To lengthen APD, we removed I Kr from the model such as under conditions of LQT2. Figure 1 C shows APD versus PCL for this case. APD became 166 ms in the long APD region and 141 ms in the short APD region at PCL = 300 ms (ΔAPD = 25 ms). As PCL was increased, APD increased faster in the long APD region than in the short APD region. ΔAPD increased to 85 ms at PCL = 780 ms after which ΔAPD increased abruptly to as much as 225 ms (see ΔAPD versus PCL in Fig. 3). For PCLs between 780 ms and 920 ms (Fig. 1 C, shaded), the action potential in the long APD region became unstable, resulting in APD alternans and irregular beat‐to‐beat APD variation (Fig. 1 D). During APD alternans, EADs occurred in the long APD region in every other beat (Fig. 1 C, inset). Because our model is deterministic (no random noise), the irregular APD variation is dynamical chaos, a ubiquitous phenomenon in nature (Gleick, 2008). Chaotic APD dynamics caused by the presence of EADs has been investigated previously (Sato et al. 2009), showing that the beat‐to‐beat irregular appearance of EADs widely observed in experiments is probably dynamical chaos. For PCL >920 ms, the action potential became stable again, with the long APD region exhibiting an EAD in every beat. Note that in the unstable regime, DI = PCL – APD was always greater than 400 ms, agreeing with the clinical observation that TWA occurs at long DIs (Wegener et al. 2008).
Figure 3. Exacerbation of APD dispersion by regional APD alternans and chaos.
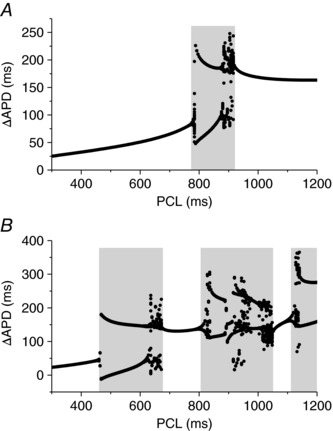
A, ΔAPD versus PCL for the case in Fig. 1 C. B, ΔAPD versus PCL for the case in Fig. 2 A. Grey regions highlight the PCL regimes of alternans and chaos, showing greatly exacerbated APD dispersion by alternans and chaos.
When I Ca,L was increased (such as under isoproterenol) (Liu et al. 2012), APD was further prolonged and more complex APD dynamics occurred in the cable (Fig. 2 A). APD alternans began at shorter PCLs (460 ms in Fig. 2 A) and multiple unstable regimes (Fig. 2 A, shaded) existed between stable regimes. In this case, APD alternans and chaos also occurred in the short APD region (in the PCL range from 900 ms to 1050 ms).
Figure 2. T‐wave alternans and lability.
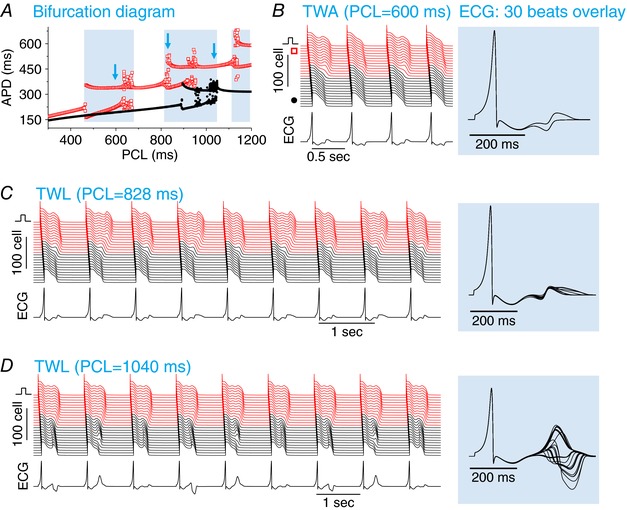
A, APD versus PCL for I Kr blocked and increased I Ca,L. The parameters are the same as for Fig. 1 C except G Ca,L = 80 mmol/(cm,C). APDs from 20 consecutive pacing beats were plotted for each PCL. The grey regions mark the PCL regimes of unstable behaviours. The open arrows indicate the PCLs for the cases shown in (B) to (D) below. B, TWA, PCL = 600 ms. Space‐time plot of voltage (upper), pseudo‐ECG trace (lower) and overlapping ECGs from 30 consecutive beats (right). C, TWL, PCL = 828 ms in which the ECG exhibits a small T‐wave morphology variability with large QT variability. D, TWL, PCL = 1040 ms in which the ECG exhibits a large T‐wave morphology variability but small QT variability. [Color figure can be viewed at http://wileyonlinelibrary.com]
Therefore, under the conditions of QT prolongation, EADs are promoted by slowing of the heart rate, resulting in APD alternans and chaos. Regional alternans and chaos can substantially exacerbate the pre‐existing dispersion of repolarization and promote an abrupt increase in dispersion of repolarization.
Regional APD alternans and chaos manifest as TWA and TWL
To link the APD dynamics to T‐wave dynamics of the ECG, we calculated a pseudo‐ECG by placing an electrode close to the end of the cable (Fig. 1 A). Figure 2 B shows a case (Fig. 2 A, first arrow) in which APD alternans occurs in the long APD region, resulting in TWA for which both the T‐wave morphology and QT interval alternated. Figure 2 C shows a case (Fig. 2 A, second arrow) in which APD varied chaotically in the long APD region, which resulted in a large beat‐to‐beat chaotic variation of the QT interval and a small variation of the T‐wave amplitude. Figure 2 D shows a case (Fig. 2 A, third arrow) in which APD varied chaotically in the short APD region, which resulted in a small variation in QT interval but a very large beat‐to‐beat variation in T‐wave amplitude and morphology. These T‐wave dynamics are very similar to the TWL recorded in patients (Brockmeier et al. 2001; Nemec et al. 2003).
Exacerbation of APD dispersion by TWA and TWL
The occurrence of regional APD alternans and chaos manifests as TWA and TWL in the ECG, although they also greatly exacerbate the APD gradient and appear abruptly as PCL changes. In Fig. 3, we plot ΔAPD (as defined in Fig. 1) versus PCL for the cases shown in Fig. 1 C and Fig. 2 A. For the case shown in Fig. 1 C, ΔAPD increased gradually to ∼85 ms until PCL = 780 ms at which APD alternans occurred suddenly in the long APD region. This resulted in a ΔAPD of 225 ms in one of the two alternating beats and 50 ms in the other beat. Therefore, regional APD alternans resulted in a very large APD gradient in one beat but slightly suppressed the APD gradient in the other beat. When APD chaos occurred in the long APD region (PCL ∼900 ms), ΔAPD in some of the beats became as large as 250 ms. When PCL >920 ms, the action potential was stable again. Although ΔAPD remained large, it was smaller than the maximum ΔAPD in the alternans and chaos regime. For the case shown in Fig. 2 A, the maximum ΔAPD in the alternans and chaos regimes became even larger (Fig. 3 B). Therefore, regional alternans and chaos can greatly accentuate the pre‐existing APD gradient or dispersion (a more than two‐fold increase, as shown in Fig. 3).
PVCs and complex PVC patterns resulted from regional APD alternans and chaos by enhancing I Ca,L
Exacerbated dispersion of repolarization caused by TWA or TWL can be a tissue substrate for re‐entry induction once there exists a properly‐timed PVC, which is one possible mechanistic link from TWA and TWL to ventricular arrhythmogenesis. However, based on the recent study by Huang et al. (2016), under LQTS, enhanced dispersion of repolarization combined with enhanced I Ca,L can result in PVCs that arise inherently from the APD gradient region, which can also directly degenerate into re‐entrant arrhythmias without requiring an additional tissue substrate. To induce PVCs, we needed to increase I Ca,L to even higher values. Figure 4 A shows an example in which PVCs (as indicated by an asterisk) occurred. They originated from the APD gradient region and occurred every other beat (2:1), resulting in a PVC alternans pattern. Because the PVCs originated from the APD gradient region, they always occur during the T‐wave, manifesting on ECG as the typical ‘R‐on‐T’. As a result of the complex APD dynamics, different PVC patterns can be observed depending on PCLs (Fig. 4 B). Similar PVC patterns were observed in experiments of rabbits with LV hypotrophy (3:1 and 4:1 patterns, etc.) (Yan et al. 2001).
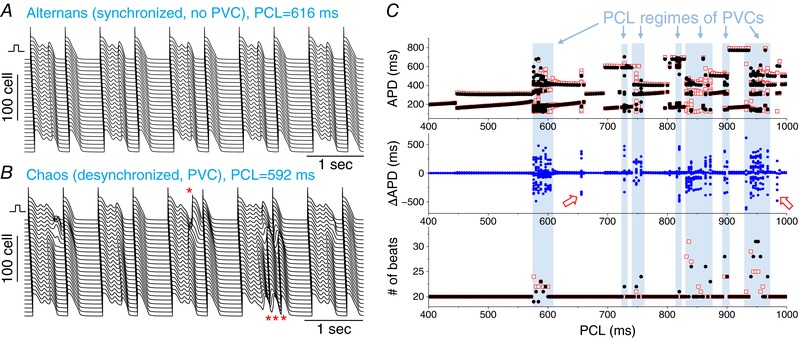
Figure 4. PVCs and complex PVC patterns induced by APD alternans and chaos.
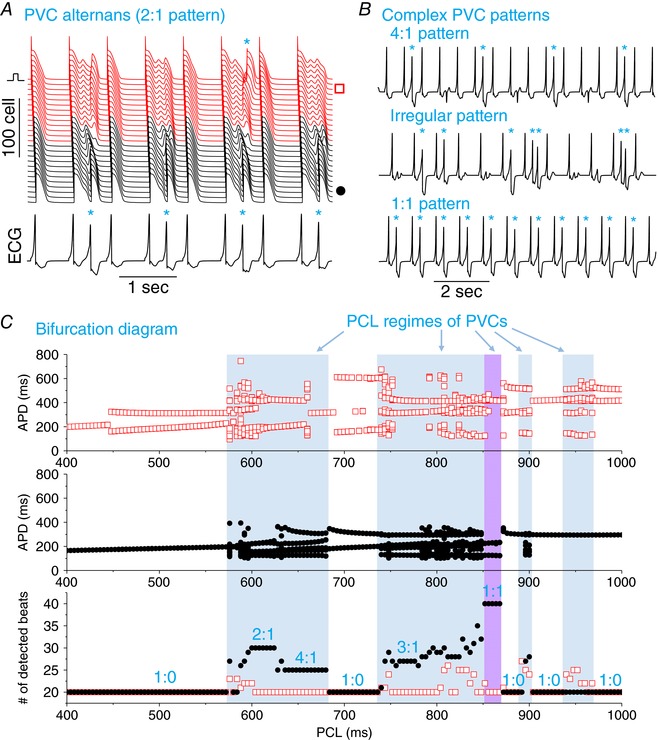
A, space‐time plot of voltage (upper) and pseudo‐ECG trace (lower). PCL = 600 ms. B, pseudo‐ECG traces showing different PVC patterns: 4:1 pattern (PCL = 640 ms), irregular pattern with couplets (PCL = 800 ms) and 1:1 pattern (PCL = 856 ms). C, APD versus PCL from the long APD region (upper panel) and from the short APD region (middle), and number (#) of beats detected versus PCL (lower) from the two recording sites (indicated by a red square and black circle, respectively). A total of 20 paced beats was given for each PCL and, if more than 20 beats were detected at the recording sites, then PVCs have occurred. The purple region indicates the PCL regime in which no alternans or chaos was observed but PVCs still occurred. The n:m ratio is the ratio of paced beats versus PVCs. 1:0 indicates no PVCs, whereas 2:1 indicates one PVC for each two paced beats. Parameters are the same as for Fig. 2 except G Ca,L = 160 mmol/(cm,C) and G Ks2 = 0.7 mS cm−2. Asterisks in A and B indicate PVCs. [Color figure can be viewed at http://wileyonlinelibrary.com]
The occurrence of different PVC patterns depends on the PCL. Figure 4 C shows APD and PVCs for the entire PCL range from 400 ms to 1000 ms. PVCs occurred in certain regimes of PCL (Fig. 4 C, shaded), mainly when APD was either alternating or chaotic (in either the long or the short APD region or both). PVCs were detected in both ends of the cable. However, TWA or TWL was neither sufficient, nor required for PVCs to occur. For example, the system was stable for the PCL regime of the 1:1 pattern in Fig. 4 C (purple region, PCL ∼860 ms). There are also regions that alternans occurred without the occurrence of PVCs (e.g. the regions around PCL ∼500 ms, 700 ms and 1000 ms). The key to the formation of PVCs is dispersion of repolarization and enhanced I Ca,L, as demonstrated systematically in the study by Huang et al. (2016). The role of TWA and TWL is to further exacerbate the dispersion of repolarization to promote PVCs.
TWL induces de novo dispersion of repolarization and PVCs in a homogeneous cable
Although both TWA and TWL can exacerbate the pre‐existing APD heterogeneities to induce PVCs, TWL can also induce dispersion of repolarization and PVCs de novo in homogeneous tissues. As reported previously (Sato et al. 2009), when chaos occurs, APD dispersion can develop via a tissue‐scale instability in homogeneous tissue without the presence of pre‐existing heterogeneities. To demonstrate this phenomenon, we simulated a homogeneous cable in which the cells are identical. When APD dynamics is in either the stable or alternans regimes, the action potentials are synchronized across the cable and APD varied concordantly in space (Fig. 5 A, upper). When APD dynamics is in the chaotic regimes, the cells became desynchronized, and the APD varied discordantly in space (Fig. 5 A, lower), resulting in a large APD dispersion (Fig. 5 B, shaded).
Figure 5. APD chaos induced dispersion in a homogenous 1D cable.
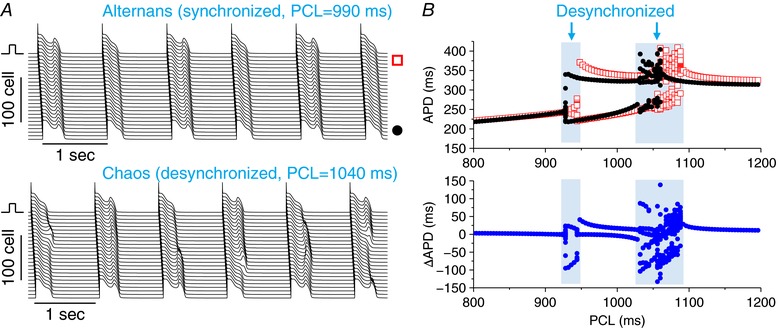
A, space‐time plots of voltage for a case of alternans (upper, PCL = 990 ms) and a case of chaos (lower, PCL = 1040 ms) with a lower but still enhanced I Ca,L. G Ca,L = 80 mmol/(cm,C) and G Ks1 = G Ks2 = 1 mS cm−2. B, APD versus PCL (upper) from the two recording sites as shown in (A) and ΔAPD versus PCL (lower). APDs and ΔAPDs from 20 consecutive beats were plotted for each PCL. As a result of the localized stimulus, the system is not ‘truly homogenous’ and thus there is a small APD difference between the two recording sites, even when the cells are synchronized. [Color figure can be viewed at http://wileyonlinelibrary.com]
Although dispersion of repolarization can be induced by APD chaos, enhanced I Ca,L is still required for PVCs to occur. We then simulated a case with a higher I Ca,L (Fig. 6). In this case, in both the stable and alternans regime, the cells still remained synchronized (see ΔAPD in Fig. 6 C). In the alternans regime, EADs occurred in alternating beats and the alternans was spatially concordant (Fig. 6 A). However, in the chaotic regimes, the cells were desynchronized and the APD varied discordantly in space, resulting in large APD dispersion (Fig. 6 B). As a result of the large APD dispersion and high I Ca,L, PVCs occurred. PVCs were detected at the PCLs only when chaos occurred (Fig. 6 C).
Figure 6. APD chaos induced PVCs in a homogenous 1D cable.
A, space‐time plots of voltage for a case of alternans, PCL = 616 ms. B, space‐time plots of voltage for a case of chaos, PCL = 592 ms. PVCs are marked by an asterisk (*). C, APD, ΔAPD and the number of beats detected versus PCL. The shaded regions indicate the PCL regimes that PVCs were observed, which are regimes of APD chaos. PVCs were observed in both ends of the cable. Two exceptions (open arrows) were observed in which chaotic APD occurred but no PVCs were observed. This could be a result of the limited simulation duration and PVCs might still occur at these PCLs if sufficiently long simulations were carried out. G Ca,L = 160 mmol/(cm,C) and G Ks1 = G Ks2 = 0.7 mS cm−2. [Color figure can be viewed at http://wileyonlinelibrary.com]
TWA and TWL precede spontaneous arrhythmia initiation in a 2D tissue model
To demonstrate how the PVCs caused by TWA or TWL can initiate re‐entrant arrhythmias, we simulated a heterogeneous 2D tissue model (Fig. 7). We set a circular region of long APD in the centre of the tissue by using lowered I Ks. When paced with PCL = 600 ms, the T‐wave was stable. After the PCL was suddenly increased to 700 ms, TWA occurred. After four alternating beats, the APD dispersion became sufficiently large to cause a PVC (first asterisk in the pseudo‐ECG trace). The excitation originated from the APD gradient region, then propagated around the long APD region and, finally, collided at the left side (Fig. 7 B). This PVC blocked the following paced beat, resulting in a long RR interval. Because of the longer RR interval, the APD in the centre region was further prolonged, resulting in a couplet during the following paced beats. Again, the next paced beat was blocked by the couplet. Following the final long cycle, a third PVC episode occurred, which finally led to the formation of a figure‐of‐eight re‐entry (Fig. 7 C), resulting in a sustained VT. The scenario of arrhythmia initiation shown in this simulation is very similar to those seen in many clinical recordings (Drew et al. 2010).
Figure 7. Arrhythmias induced following TWA in a 2D tissue model.
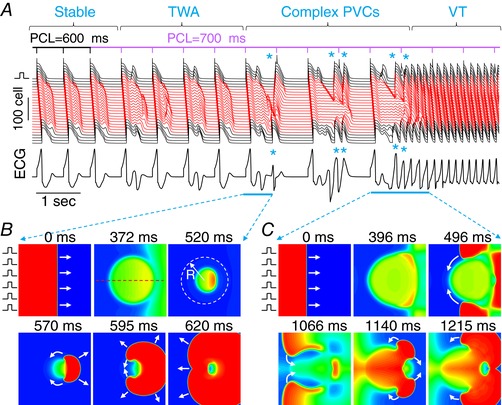
A, space‐time plot of voltage recorded from the centre line (indicated by the dashed line in the upper‐middle of B) and the pseudo‐ECG. PVCs are marked with an asterisk (*). B, voltage snapshots (time 0 for the first panel) from the first single PVC episode. During the pacing beat, the repolarization of the centre region was delayed (panels 2 and 3), which led to a unidirectionally propagating PVC (panel 4), propagating around the centre region (panel 5). The two tips collided without forming re‐entry but manifested as an ectopic beat. C, voltage snapshots (time 0 for the first panel) from the later episode that the PVCs eventually lead to figure‐of‐eight re‐entry. This episode is similar to that in (B) but the two tips survived and continued to induce re‐entry. Parameters: tissue size is 300 × 300 cells. The radius of the circular region (indicated by the dashed circle in the upper‐right of B) is R = 100 cells. The maximum conductance of I Ks is G Ks2 = 0.6 mS cm−2 inside the circle and G Ks1 = 1 mS cm−2 outside the circle. The red traces in (A) were recorded from the inside of the circle and the black traces were from the outside of the circle. G Ca,L = 160 mmol/(cm,C) is uniform over the entire tissue domain. [Color figure can be viewed at http://wileyonlinelibrary.com]
Slow heart rate‐induced PVC alternans and arrhythmias in experiments of transgenic LQT2 rabbits
We previously reported that overexpression of pore mutant KCNH2 (HERG‐G628S) in the rabbit hearts produced LQT2 rabbits with prolongation of the QT interval and sudden cardiac death (Brunner et al. 2008; Odening et al. 2012). These rabbits showed increased APD dispersion and high risks for spatially discordant alternans associated with ventricular fibrillation induction under rapid pacing (Ziv et al. 2009). On the other hand, pVTs occurred spontaneously under sympathetic stimulation using isoproterenol under slow heart rates induced by AV ablation. We inspected the ECG recordings from 33 LQT2 rabbits that showed pVTs under isoproterenol (140 nm) and acute AV ablation condition. The PVC dynamics were complex, dynamically changing from 2:1 or 3:1 to 1:1. Among 33 LQT2 rabbits, ECG recordings from 15 LQT2 rabbits showed PVC alternans (45%) before the onset of pVT and ventricular fibrillation. We then examined changes in APD dispersion during PVC alternans before the onset of pVT. Among 15 LQT2 hearts that exhibited PVC alternans in ECGs, optical mapping captured nine PVC alternans events that preceded pVT initiation from eight LQT2 hearts. A representative example of PVC alternans is shown in Fig. 8 A. Figure 8 B shows the maps of action potential propagation of intrinsic beats (the initial action potential upstrokes) and PVC propagation (bottom two maps). The first PVC (of beat 0) originated from the left bottom corner and propagated to the rest of the heart. The second PVC originated from two locations, showing that the initial PVC sites are dynamically changing. The maps of APD in Fig. 8 C and D show that APD dispersion progressively increase before pVT initiation (ΔAPD from 88 ± 21 ms to 160 ± 34 ms, n = 8 hearts. In this episode of PVC alternans and pVT initiation, APD maps of beat 1 and 3 show the island of prolonged APD region in the middle and the largest gradient of APD is marked with a white line in the APD map of beat 3. Figure 8 E shows a series of activations during pVT initiation. The first action potential upstroke (beat 0) shows the same activation pattern as that of intrinsic beat in Fig. 8 B. The following beat 1 started from the left side of the field of view, which can be considered as a PVC in Fig. 8 A. The following beats 2 and 3 started from the upper left corner that lead to pVT. Importantly, these beats originated from the largest APD gradients, agreeing with the prediction from the computer modelling that large APD gradients can trigger de novo PVCs to initiate re‐entrant arrhythmias. These results indicate that PVC alternans exacerbates APD dispersion, precipitating pVT initiation.
Figure 8. Slow heart rate induced PVC alternans and arrhythmogenesis in experiments of transgenic LQT2 rabbits.
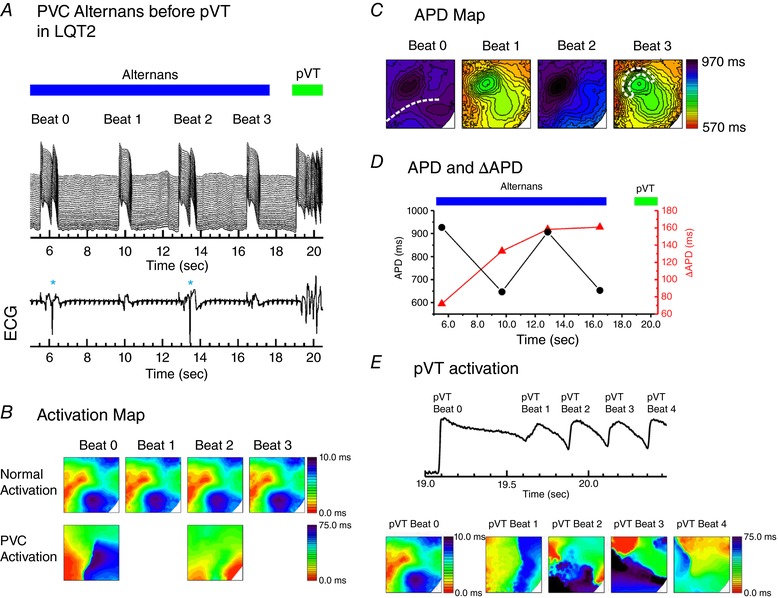
A, space‐time plot of membrane potential (top) from the dashed line of the first panel in (C) and simultaneously recorded ECG trace (bottom) in an AV‐ablated LQT2 transgenic rabbit heart under isoproterenol (140 nm). QRS complexes (large amplitude deflections) are completely dissociated with P‐wave (multiple small amplitude deflections) showing complete AV conduction block. Before pVT initiation, PVCs occurred during each alternating beat, causing beat‐to‐beat APD alternans, which eventually led to pVT initiation. B, activation maps of intrinsic beats (top) and PVCs (bottom) from (A). C, APD maps of beat 0 to 3. The region of largest APD gradient is marked with a white dotted line in the fourth panel. D, APD and ΔAPD during PVC alternans. E, activation patterns during pVT initiation. pVT beat 0 is from the first action potential upstroke. The beat 1, equivalent to a PVC, originated from the left side of field view. The following two pVT beats originated from the locations where APD gradient was largest (see APD maps of beat 1 and beat 3) and initiated re‐entry for pVT. [Color figure can be viewed at http://wileyonlinelibrary.com]
Discussion
In the present study, we used computational models of rabbit ventricular tissue and experiments of transgenic LQT2 rabbits to investigate the mechanistic links between TWA and TWL and the genesis of PVCs and ventricular arrhythmias. Our major novel finding is that TWA and TWL can exacerbate pre‐existing or induce de novo tissue heterogeneities and, when combined with enhanced I Ca,L, can cause a tissue‐scale dynamical instability resulting in spontaneous genesis of PVCs and arrhythmias. This differs from the traditional known roles of APD alternans in arrhythmogenesis in which alternans provides a tissue substrate for conduction blocks and re‐entry formation and properly timed PVCs from other sources are needed as triggers. The novel mechanistic insights from the present study using computer models and experiments of rabbits may shed light on the roles of TWA and TWL in the genesis of arrhythmias in human hearts and the development of effective therapies for prevention of arrhythmias caused by QT prolongation, as discussed in detail below.
Mechanisms linking TWA and TWL to arrhythmogenesis
APD alternans has traditionally been considered as an arrhythmia substrate by causing spatially discordant alternans (Cao et al. 1999; Pastore et al. 1999; Qu et al. 2000; Choi et al. 2007), which is usually potentiated by fast pacing to engage the steep recovery phase of the ion channels. At a fast heart rate, such as in ventricular tachyarrhythmias, alternans can promote conduction blocks and wavebreaks to form new wavelets. However, in patients with LQTS (Brockmeier et al. 2001; Grabowski et al. 2004; Feldman & Campagna, 2006; Wegener et al. 2008; Holley & Cooper, 2009; Drew et al. 2010; Liu et al. 2013; Shu et al. 2014), TWA is usually observed occurring at normal or slow heart rates in which the DI is long and thus most of the ion channels should have recovered or in their slowly recovery phase. Therefore, the refractoriness‐based mechanisms of alternans under rapid heart rates are probably not a candidate mechanism of TWA at normal or slow heart rates seen in LQTS patients. This also supported by the fact that isoproterenol can be used to increase the heart rate to prevent immediate recurrence of torsade de pointes in acquired LQTS (Viskin, 1999). APD alternans caused by reduced repolarization reserve or the occurrence of EADs (Guo et al. 2008; Sato et al. 2009; Qu et al. 2010; Qu & Chung, 2012; Liu et al. 2013), which is potentiated by slowing the heart rates, can be a candidate mechanism of TWA in patients. Moreover, APD chaos occurs via the same dynamical mechanism, which can be a candidate mechanism of TWL. The dynamical mechanism of alternans and chaos under reduced repolarization reserve is still related to the steep change in APD restitution caused by the occurrence of EADs (Sato et al. 2009, 2010) but, as shown in a recent study (Landaw et al. 2017), short‐term cardiac memory plays a key role in the genesis of these non‐linear dynamics. Although random fluctuations in ion channel openings can potentially be a cause for TWL, the large variation in T‐wave amplitude and QT interval seen clinically cannot be explained by random ion channel fluctuations because the APD variation caused by ion channel noise, particularly in well‐coupled tissue (Heijman et al. 2013), is too small.
Differing from the transitional understanding that APD alternans plays the role of a substrate for arrhythmia initiation and maintenance (Karma, 1994; Cao et al. 1999; Pastore et al. 1999; Qu et al. 2000; ten Tusscher & Panfilov, 2006), we have demonstrated a novel mechanism of arrhythmia initiation by TWA and TWL in which TWA and TWL exacerbate dispersion of repolarization to promote PVCs. Specifically, APD prolongation manifesting as QT prolongation on the ECG causes APD alternans and chaos under normal or slow heart rates. Regional APD alternans and chaos can greatly exacerbate the pre‐existing dispersion of repolarization, causing alternans (i.e. TWA) or irregular variation (i.e. TWL) in both the T‐wave amplitude and the QT interval. Furthermore, APD chaos can also induce APD dispersion de novo in homogeneous tissue via chaos desynchronization (Xie et al. 2007; Sato et al. 2009). Increased dispersion of repolarization combined with enhanced I Ca,L promotes a tissue‐scale instability to initiate PVCs, as demonstrated in detail in the study by Huang et al. (2016). Because the PVCs propagate unidirectionally, it can degenerate directly into ventricular arrhythmias without the need for an additional tissue substrate for conduction block. This is different from the traditional mechanism of arrhythmia initiation in which a PVC propagates toward the APD gradient region and is then locally blocked at the gradient region to form a figure‐of‐eight re‐entry (Pastore et al. 1999; Qu et al. 2000). Note that, the role of TWA and TWL is to exacerbate the APD dispersion and they are not required for the spontaneous initiation of arrhythmias. As shown in recent studies (Dutta et al. 2016; Huang et al. 2016; Vandersickel et al. 2016), APD dispersion is key for spontaneous arrhythmogenesis under the condition of reduced repolarization reserve. The detailed mechanisms of repolarization gradient induced PVCs and their spontaneous degeneration into ventricular arrhythmias under the condition of QT prolongation have been demonstrated in our previous study (Huang et al. 2016).
Optical mappings using transgenic LQT2 rabbit provide evidence that PVC alternans can indeed occur in the rabbit heart at slow heart rates, which can eventually lead to the initiation of pVT. The occurrence of alternans increased APD dispersion. These observations agree well with the computer simulation results and they are probably caused by the same mechanisms.
Implications for arrhythmogenesis in cardiac diseases
QT prolongation occurs not only in LQTS, but also in other diseased conditions, such as heart failure. TWA and TWL are also frequently observed in patients with these diseases (Armoundas et al. 2002; Narayan, 2006; Qu et al. 2010). Although TWA and TWL are widely observed to precede ventricular arrhythmias, their roles in arrhythmogenesis and the underlying mechanistic links are still not well understood (Narayan, 2006). The present study provides novel insights into the mechanistic links of TWA and TWL to the genesis of ventricular arrhythmias in LQTS. Specifically, QT prolongation and/or slowing of the heart rate cause APD alternans and chaos, manifesting as TWA and TWL in the ECG, respectively. APD alternans and chaos can exacerbate or induce de novo APD dispersion to cause PVCs, which, when combined with enhanced I Ca,L, can degenerate spontaneously into ventricular arrhythmias. However, as we have shown in the present study, TWA or TWL is caused by QT prolongation and the PVCs are caused by enhanced APD dispersion and therefore TWA or TWL is not required but potentiates this mechanism of arrhythmogenesis. This is agreement with the clinical observation (Zareba et al. 1994) that LQTS patients with TWA had a higher incidence of arrhythmias and sudden death than those without TWA; however, QT prolongation was required for TWA to occur. This indicates that QT prolongation but not TWA is the primary cause of arrhythmias in patients with LQTS, whereas TWA potentiates their arrhythmia risk.
Limitations
We simulated QT prolongation only by blocking I Kr and the heterogeneities by heterogeneous I Ks distributions. Whether the results of the present study are applicable to QT prolongation and heterogeneities caused by other ionic currents needs further investigation. We simulated the effects of isoproterenol or β‐stimulation by only increasing the maximum conductance of I Ca,L. Isoproterenol affects other ionic currents as well as Ca2+ cycling proteins with different time courses (Xie et al. 2013), which may need a more detailed description of the signalling process to allow proper modelling. Because the major immediate effect of isoproterenol is the increase in I Ca,L, we model this increase as the main acute effect of β‐stimulation.
The exact source of the EADs in the rabbit experiments is also difficult to pinpoint. It is possible that these EADs, and thus the PVCs, in the rabbit experiments were caused by spontaneous Ca2+ release as a result of isoproterenol (Volders et al. 1997; Choi et al. 2002; Zhao et al. 2012; Němec et al. 2016). However, a recent study by Terentyev et al. (2014) showed that the EADs observed in LQT2 rabbit myocytes were caused by aberrant Ca2+ release, which increases the NCX current to enable reactivation of I Ca,L in the action potential plateau. It has also been shown experimentally that TWL can be caused by spontaneous Ca2+ oscillations (Nemec et al. 2010). As a result of technical limitations, we could only provide experimental evidence of PVC alternans preceding pVT and unable to cleanly design experiments to systematically demonstrate the bifurcations shown in computer simulations.
The results obtained in the present study are based on rabbit models and experiments performed at heart rates much slower than normal rabbit heart rates. It is unclear whether the mechanisms of arrhythmias are applicable to sudden cardiac death of LQTS rabbits. Although the heart rates in our simulations are within the range of human heart rates under physiological and pathophysiological conditions, human models are still needed in future studies to confirm whether these mechanisms are applicable to arrhythmogenesis in human. We also only simulated 1D cable and 2D tissue models. Whole heart models may be needed to obtain the proper ECG morphologies of LQTS (Sadrieh et al. 2014). Nevertheless, we consider that our results provide a novel mechanism linking TWA or TWL to arrhythmogenesis, which may be generally applicable to arrhythmogenesis caused by QT prolongation.
Conclusions
The present study shows that TWA and TWL are APD alternans and chaos, respectively, arising from the same dynamical mechanism. They are causally linked to arrhythmogenesis by exacerbating pre‐existing or inducing de novo APD dispersion, which combines with an excessive increase of I Ca,L to cause spontaneous initiation of PVCs and ventricular arrhythmias in LQTS.
Additional information
Competing interests
The authors declare that they have no competing financial interests.
Author contributions
WL, XH and MBL performed the computer simulations. TK performed the experiments. BKC designed the experiments. ZQ designed the overall study and wrote the manuscript. All authors analysed and interpreted the data, edited the manuscript, approved the final version of the manuscript submitted for publication, and agreed to be accountable for all aspects of the work in ensuring that questions related to the accuracy or integrity of any part of the work are appropriately investigated and resolved. All persons designated as authors qualify for authorship, and all those who qualify for authorship are listed.
Funding
This work was supported by grants from National Institute of Health R01 HL110791, R01 HL139829, P01 HL078931, F30 HL132449 (MBL) and the China Scholarship Council and Jiangxi University of Science and Technology, China (WL).
Biographies
Weiqing Liu is Professor of Physics at Jiangxi University of Science and Technology. He obtained his PhD from Beijing University of Posts and Telecommunications. He was a research fellow in University of Singapore, a postdoctoral fellow in Wuhan Institute of Physics and Mathematics, Chinese Academy of Sciences, and a visiting scholar in University of California, Los Angeles. His research focuses on non‐linear dynamics in complex systems.

Tae Yun Kim is postdoctoral fellow at the Cardiovascular Research Centre, Rhode Island Hospital and Brown University. He obtained his PhD in non‐linear dynamics and biophysics from Korea University. His research focuses on optical mapping and mechanisms of cardiac arrhythmias.
Xiaodong Huang is Associate Professor of South China University of Technology. He obtained his PhD from Beijing Normal University in 2011. During 2014 and 2015, he worked as a postdoctoral fellowship in University of California, Los Angeles. His research focuses on non‐linear dynamics and cardiology.
Edited by: Don Bers & Bjorn Knollmann
References
- Armoundas AA, Nanke T & Cohen RJ (2000). Images in cardiovascular medicine. T‐wave alternans preceding torsade de pointes ventricular tachycardia. Circulation 101, 2550. [DOI] [PubMed] [Google Scholar]
- Armoundas AA, Tomaselli GF & Esperer HD (2002). Pathophysiological basis and clinical application of T‐wave alternans. J Am Coll Cardiol 40, 207–217. [DOI] [PubMed] [Google Scholar]
- Berger RD, Kasper EK, Baughman KL, Marban E, Calkins H & Tomaselli GF (1997). Beat‐to‐beat QT interval variability: novel evidence for repolarization lability in ischemic and nonischemic dilated cardiomyopathy. Circulation 96, 1557–1565. [DOI] [PubMed] [Google Scholar]
- Brockmeier K, Aslan I, Hilbel T, Eberle T, Ulmer HE & Lux RL (2001). T‐wave alternans in LQTS: repolarization‐rate dynamics from digital 12‐lead Holter data. J Electrocardiol 34, 93–96. [DOI] [PubMed] [Google Scholar]
- Brunner M, Peng X, Liu GX, Ren XQ, Ziv O, Choi BR, Mathur R, Hajjiri M, Odening KE, Steinberg E, Folco EJ, Pringa E, Centracchio J, Macharzina RR, Donahay T, Schofield L, Rana N, Kirk M, Mitchell GF, Poppas A, Zehender M & Koren G (2008). Mechanisms of cardiac arrhythmias and sudden death in transgenic rabbits with long QT syndrome. J Clin Invest 118, 2246–2259. [DOI] [PMC free article] [PubMed] [Google Scholar]
- Cao JM, Qu Z, Kim YH, Wu TJ, Garfinkel A, Weiss JN, Karagueuzian HS & Chen PS (1999). Spatiotemporal heterogeneity in the induction of ventricular fibrillation by rapid pacing: importance of cardiac restitution properties. Circ Res 84, 1318–1331. [DOI] [PubMed] [Google Scholar]
- Chialvo DR, Gilmour RF & Jalife J (1990). Low dimensional chaos in cardiac tissue. Nature 343, 653–657. [DOI] [PubMed] [Google Scholar]
- Choi BR, Burton F & Salama G (2002). Cytosolic Ca2+ triggers early afterdepolarizations and Torsade de Pointes in rabbit hearts with type 2 long QT syndrome. J Physiol‐London 543, 615–631. [DOI] [PMC free article] [PubMed] [Google Scholar]
- Choi BR, Jang W & Salama G (2007). Spatially discordant voltage alternans cause wavebreaks in ventricular fibrillation. Heart Rhythm 4, 1057–1068. [DOI] [PMC free article] [PubMed] [Google Scholar]
- Christini DJ, Riccio ML, Culianu CA, Fox JJ, Karma A & Gilmour RF Jr (2006). Control of electrical alternans in canine cardiac purkinje fibers. Phys Rev Lett 96, 104101. [DOI] [PMC free article] [PubMed] [Google Scholar]
- Cutler MJ, Wan X, Laurita KR, Hajjar RJ & Rosenbaum DS (2009). Targeted SERCA2a gene expression identifies molecular mechanism and therapeutic target for arrhythmogenic cardiac alternans. Circ Arrhythm Electrophysiol 2, 686–694. [DOI] [PMC free article] [PubMed] [Google Scholar]
- Drew BJ, Ackerman MJ, Funk M, Gibler WB, Kligfield P, Menon V, Philippides GJ, Roden DM & Zareba W (2010). Prevention of torsade de pointes in hospital settings: a scientific statement from the American Heart Association and the American College of Cardiology Foundation. Circulation 121, 1047–1060. [DOI] [PMC free article] [PubMed] [Google Scholar]
- Dutta S, Mincholé A, Zacur E, Quinn TA, Taggart P & Rodriguez B (2016). Early afterdepolarizations promote transmural reentry in ischemic human ventricles with reduced repolarization reserve. Prog Biophys Mol Biol 120, 236–248. [DOI] [PMC free article] [PubMed] [Google Scholar]
- Feldman DN & Campagna R (2006). Images in cardiology: macroscopic T‐wave alternans. Clin Cardiol 29, 422. [DOI] [PMC free article] [PubMed] [Google Scholar]
- Gleick J ( 2008). Chaos: Making a New Science (Enhanced Edition). Penguin Group, New York, NY. [Google Scholar]
- Grabowski M, Karpinski G, Filipiak KJ & Opolski G (2004). Images in cardiovascular medicine. Drug‐induced long‐QT syndrome with macroscopic T‐wave alternans. Circulation 110, e459–460. [DOI] [PubMed] [Google Scholar]
- Guevara MR, Glass L & Shrier A (1981). Phase locking, period‐doubling bifurcations, and irregular dynamics in periodically stimulated cardiac cells. Science 214, 1350–1353. [DOI] [PubMed] [Google Scholar]
- Guo D, Young L, Patel C, Jiao Z, Wu Y, Liu T, Kowey PR & Yan GX (2008). Calcium‐activated chloride current contributes to action potential alternations in left ventricular hypertrophy rabbit. Am J Physiol Heart Circ Physiol 295, H97–H104. [DOI] [PubMed] [Google Scholar]
- Hayashi H, Shiferaw Y, Sato D, Nihei M, Lin SF, Chen PS, Garfinkel A, Weiss JN & Qu Z (2007). Dynamic origin of spatially discordant alternans in cardiac tissue. Biophys J 92, 448–460. [DOI] [PMC free article] [PubMed] [Google Scholar]
- Heijman J, Zaza A, Johnson DM, Rudy Y, Peeters RL, Volders PG & Westra RL (2013). Determinants of beat‐to‐beat variability of repolarization duration in the canine ventricular myocyte: a computational analysis. PLoS Comput Biol 9, e1003202. [DOI] [PMC free article] [PubMed] [Google Scholar]
- Holley CL & Cooper JA (2009). Macrovolt T‐wave alternans and polymorphic ventricular tachycardia. Circulation 120, 445–446. [DOI] [PubMed] [Google Scholar]
- Huang X, Kim TY, Koren G, Choi B‐R & Qu Z (2016). Spontaneous initiation of premature ventricular complexes and arrhythmias in type 2 long QT syndrome. Am J Physiol Heart Circ Physiol 311, H1470–H1484. [DOI] [PMC free article] [PubMed] [Google Scholar]
- Karma A (1994). Electrical alternans and spiral wave breakup in cardiac tissue. Chaos 4, 461–472. [DOI] [PubMed] [Google Scholar]
- Kim TY, Kunitomo Y, Pfeiffer Z, Patel D, Hwang J, Harrison K, Patel B, Jeng P, Ziv O, Lu Y, Peng X, Qu Z, Koren G & Choi B‐R (2015). Complex excitation dynamics underlie polymorphic ventricular tachycardia in a transgenic rabbit model of long QT syndrome type 1. Heart Rhythm 12, 220–228. [DOI] [PMC free article] [PubMed] [Google Scholar]
- Landaw J, Garfinkel A, Weiss JN & Qu Z (2017). Memory‐Induced Chaos in Cardiac Excitation. Phys Rev Lett 118, 138101. [DOI] [PMC free article] [PubMed] [Google Scholar]
- Lau E, Kossidas K, Kim TY, Kunitomo Y, Ziv O, Song Z, Taylor C, Schofield L, Yammine J, Liu G, Peng X, Qu Z, Koren G & Choi B‐R (2015). Spatially discordant alternans and arrhythmias in tachypacing‐induced cardiac myopathy in transgenic LQT1 rabbits: the importance of IKsand Ca2+ cycling. PLoS ONE 10, e0122754. [DOI] [PMC free article] [PubMed] [Google Scholar]
- Liu GX, Choi BR, Ziv O, Li W, de Lange E, Qu Z & Koren G (2012). Differential conditions for early after‐depolarizations and triggered activity in cardiomyocytes derived from transgenic LQT1 and LQT2 rabbits. J Physiol 590, 1171–1180. [DOI] [PMC free article] [PubMed] [Google Scholar]
- Liu T, Patel C, Guo D, Ju R, Kowey P & Yan G‐X (2013). Early afterdepolarization alternans manifests T wave alternans in left ventricular hypertrophy. Circulation 128, A10368. [Google Scholar]
- Mahajan A, Shiferaw Y, Sato D, Baher A, Olcese R, Xie L‐H, Yang M‐J, Chen P‐S, Restrepo JG, Karma A, Garfinkel A, Qu Z & Weiss JN (2008). A rabbit ventricular action potential model replicating cardiac dynamics at rapid heart rates. Biophys J 94, 392–410. [DOI] [PMC free article] [PubMed] [Google Scholar]
- Mironov S, Jalife J & Tolkacheva EG (2008). Role of conduction velocity restitution and short‐term memory in the development of action potential duration alternans in isolated rabbit hearts. Circulation 118, 17–25. [DOI] [PMC free article] [PubMed] [Google Scholar]
- Narayan SM (2006). T‐wave alternans and the susceptibility to ventricular arrhythmias. J Am Coll Cardiol 47, 269–281. [DOI] [PubMed] [Google Scholar]
- Nemec J, Hejlik JB, Shen W‐K & Ackerman MJ (2003). Catecholamine‐induced T‐wave lability in congenital long QT syndrome: a novel phenomenon associated with syncope and cardiac arrest. Mayo Clin Proc 78, 40–50. [DOI] [PubMed] [Google Scholar]
- Nemec J, Kim JJ, Gabris B & Salama G (2010). Calcium oscillations and T‐wave lability precede ventricular arrhythmias in acquired long QT type 2. Heart Rhythm 7, 1686–1694. [DOI] [PMC free article] [PubMed] [Google Scholar]
- Němec J, Kim JJ & Salama G (2016). The link between abnormal calcium handling and electrical instability in acquired long QT syndrome – does calcium precipitate arrhythmic storms? Prog Biophys Mol Biol 120, 210–221. [DOI] [PMC free article] [PubMed] [Google Scholar]
- Odening KE, Choi BR, Liu GX, Hartmann K, Ziv O, Chaves L, Schofield L, Centracchio J, Zehender M, Peng X, Brunner M & Koren G (2012). Estradiol promotes sudden cardiac death in transgenic long QT type 2 rabbits while progesterone is protective. Heart Rhythm 9, 823–832. [DOI] [PMC free article] [PubMed] [Google Scholar]
- Pastore JM, Girouard SD, Laurita KR, Akar FG & Rosenbaum DS (1999). Mechanism linking T‐wave alternans to the genesis of cardiac fibrillation. Circulation 99, 1385–1394. [DOI] [PubMed] [Google Scholar]
- Prudat Y, Madhvani RV, Angelini M, Borgstom NP, Garfinkel A, Karagueuzian HS, Weiss JN, de Lange E, Olcese R & Kucera JP (2016). Stochastic pacing reveals the propensity to cardiac action potential alternans and uncovers its underlying dynamics. J Physiol 594, 2537–2553. [DOI] [PMC free article] [PubMed] [Google Scholar]
- Qu Z & Chung D (2012). Mechanisms and determinants of ultralong action potential duration and slow rate‐dependence in cardiac myocytes. PLoS ONE 7, e43587. [DOI] [PMC free article] [PubMed] [Google Scholar]
- Qu Z, Garfinkel A, Chen PS & Weiss JN (2000). Mechanisms of discordant alternans and induction of reentry in simulated cardiac tissue. Circulation 102, 1664–1670. [DOI] [PubMed] [Google Scholar]
- Qu Z & Weiss JN (2015). Mechanisms of ventricular arrhythmias: from molecular fluctuations to electrical turbulence. Annu Rev Physiol 77, 29–55. [DOI] [PMC free article] [PubMed] [Google Scholar]
- Qu Z, Xie Y, Garfinkel A & Weiss JN (2010). T‐wave alternans and arrhythmogenesis in cardiac diseases. Front Physiol 1, 154. [DOI] [PMC free article] [PubMed] [Google Scholar]
- Rosenbaum DS (2001). T wave alternans: a mechanism of arrhythmogenesis comes of age after 100 years. J Cardiovasc Electrophysiol 12, 207–209. [DOI] [PubMed] [Google Scholar]
- Sadrieh A, Domanski L, Pitt‐Francis J, Mann SA, Hodkinson EC, Ng CA, Perry MD, Taylor JA, Gavaghan D, Subbiah RN, Vandenberg JI & Hill AP (2014). Multiscale cardiac modelling reveals the origins of notched T waves in long QT syndrome type 2. Nature communications 5, 5069. [DOI] [PubMed] [Google Scholar]
- Sato D, Xie LH, Nguyen TP, Weiss JN & Qu Z (2010). Irregularly appearing early afterdepolarizations in cardiac myocytes: random fluctuations or dynamical chaos? Biophys J 99, 765–773. [DOI] [PMC free article] [PubMed] [Google Scholar]
- Sato D, Xie LH, Sovari AA, Tran DX, Morita N, Xie F, Karagueuzian H, Garfinkel A, Weiss JN & Qu Z (2009). Synchronization of chaotic early afterdepolarizations in the genesis of cardiac arrhythmias. Proc Natl Acad Sci USA 106, 2983–2988. [DOI] [PMC free article] [PubMed] [Google Scholar]
- Schwartz PJ & Malliani A (1975). Electrical alternation of the T‐wave: clinical and experimental evidence of its relationship with the sympathetic nervous system and with the long Q‐T syndrome. Am Heart J 89, 45–50. [DOI] [PubMed] [Google Scholar]
- Shu J, Li Y, Ju R & Yan G‐X (2014). Two types of T wave alternans in long‐QT syndrome. J Cardiovasc Electrophysiol 25, 910–912. [DOI] [PubMed] [Google Scholar]
- Tao T, O'Neill SC, Diaz ME, Li YT, Eisner DA & Zhang H (2008). Alternans of cardiac calcium cycling in a cluster of ryanodine receptors: a simulation study. Am J Physiol Heart Circ Physiol 295, H598–H609. [DOI] [PMC free article] [PubMed] [Google Scholar]
- ten Tusscher KH & Panfilov AV (2006). Alternans and spiral breakup in a human ventricular tissue model. Am J Physiol Heart Circ Physiol 291, H1088–H1100. [DOI] [PubMed] [Google Scholar]
- Terentyev D, Rees CM, Li W, Cooper LL, Jindal HK, Peng X, Lu Y, Terentyeva R, Odening KE, Daley J, Bist K, Choi BR, Karma A & Koren G (2014). Hyperphosphorylation of RyRs underlies triggered activity in transgenic rabbit model of LQT2 syndrome. Circ Res 115, 919–928. [DOI] [PMC free article] [PubMed] [Google Scholar]
- Traube L (1872). Ein fall von pulsus bigeminus nebst bemerkungen tiber die lebershwellungen bei klappenfehlern und uber acute leberatrophic. Ber Klin Wschr 9, 185. [Google Scholar]
- Vandersickel N, de Boer TP, Vos MA & Panfilov AV (2016). Perpetuation of torsade de pointes in heterogeneous hearts: competing foci or re‐entry? J Physiol 594, 6865–6878. [DOI] [PMC free article] [PubMed] [Google Scholar]
- Viskin S (1999). Long QT syndromes and torsade de pointes. Lancet 354, 1625–1633. [DOI] [PubMed] [Google Scholar]
- Volders PG, Kulcsar A, Vos MA, Sipido KR, Wellens HJ, Lazzara R & Szabo B (1997). Similarities between early and delayed afterdepolarizations induced by isoproterenol in canine ventricular myocytes. Cardiovasc Res 34, 348–359. [DOI] [PubMed] [Google Scholar]
- Wang W, Whittaker DG, Ni H, Wang K & Zhang H (2016). Two aspects of cardiac alternans — Difference and correlation between them. In 2016 Computing in Cardiology Conference (CinC 2016), pp. 1101–1104. IEEE: Vancouver, Canada. [Google Scholar]
- Watanabe M, Otani NF & Gilmour RF (1995). Biphasic restitution of action potential duration and complex dynamics in ventricular myocardium. Circ Res 76, 915–921. [DOI] [PubMed] [Google Scholar]
- Wegener FT, Ehrlich JR & Hohnloser SH (2008). Amiodarone‐associated macroscopic T‐wave alternans and torsade de pointes unmasking the inherited long QT syndrome. Europace 10, 112–113. [DOI] [PubMed] [Google Scholar]
- Wilson LD, Jeyaraj D, Wan X, Hoeker GS, Said TH, Gittinger M, Laurita KR & Rosenbaum DS (2009). Heart failure enhances susceptibility to arrhythmogenic cardiac alternans. Heart Rhythm 6, 251–259. [DOI] [PMC free article] [PubMed] [Google Scholar]
- Xie Y, Grandi E, Puglisi JL, Sato D & Bers DM (2013). beta‐adrenergic stimulation activates early afterdepolarizations transiently via kinetic mismatch of PKA targets. J Mol Cell Cardiol 58, 153–161. [DOI] [PMC free article] [PubMed] [Google Scholar]
- Xie Y, Hu G, Sato D, Weiss JN, Garfinkel A & Qu Z (2007). Dispersion of refractoriness and induction of reentry due to chaos synchronization in a model of cardiac tissue. Phys Rev Lett 99, 118101. [DOI] [PubMed] [Google Scholar]
- Yan GX, Rials SJ, Wu Y, Liu T, Xu X, Marinchak RA & Kowey PR (2001). Ventricular hypertrophy amplifies transmural repolarization dispersion and induces early afterdepolarization. Am J Physiol Heart Circ Physiol 281, H1968–H1975. [DOI] [PubMed] [Google Scholar]
- Zareba W, Moss AJ, le Cessie S & Hall WJ (1994). T wave alternans in idiopathic long QT syndrome. J Am Coll Cardiol 23, 1541–1546. [DOI] [PubMed] [Google Scholar]
- Zhao Z, Wen H, Fefelova N, Allen C, Baba A, Matsuda T & Xie LH (2012). Revisiting the ionic mechanisms of early afterdepolarizations in cardiomyocytes: predominant by Ca waves or Ca currents? Am J Physiol Heart Circ Physiol 302, H1636–H1644. [DOI] [PMC free article] [PubMed] [Google Scholar]
- Zhou X, Bueno‐Orovio A, Orini M, Hanson B, Hayward M, Taggart P, Lambiase PD, Burrage K & Rodriguez B (2016). In vivo and in silico investigation into mechanisms of frequency dependence of repolarization alternans in human ventricular cardiomyocytes. Circ Res 118, 266–278. [DOI] [PMC free article] [PubMed] [Google Scholar]
- Zhu ZI & Clancy CE (2007). L‐type Ca2+ channel mutations and T‐wave alternans: a model study. Am J Physiol Heart Circ Physiol 293, H3480–H3489. [DOI] [PubMed] [Google Scholar]
- Ziv O, Morales E, Song YK, Peng X, Odening KE, Buxton AE, Karma A, Koren G & Choi BR (2009). Origin of complex behaviour of spatially discordant alternans in a transgenic rabbit model of type 2 long QT syndrome. J Physiol 587, 4661–4680. [DOI] [PMC free article] [PubMed] [Google Scholar]