

Ohanna et al. show that in BRAFV600E melanoma cells, NAMPT expression induces transcriptomic and epigenetic reshufflings that steers melanoma cells toward an invasive phenotype associated with resistance to targeted therapies and immunotherapies.
Keywords: melanoma, metabolism, NAD, targeted therapy
Abstract
In BRAFV600E melanoma cells, a global metabolomic analysis discloses a decrease in nicotinamide adenine dinucleotide (NAD+) levels upon PLX4032 treatment that is conveyed by a STAT5 inhibition and a transcriptional regulation of the nicotinamide phosphoribosyltransferase (NAMPT) gene. NAMPT inhibition decreases melanoma cell proliferation both in vitro and in vivo, while forced NAMPT expression renders melanoma cells resistant to PLX4032. NAMPT expression induces transcriptomic and epigenetic reshufflings that steer melanoma cells toward an invasive phenotype associated with resistance to targeted therapies and immunotherapies. Therefore, NAMPT, the key enzyme in the NAD+ salvage pathway, appears as a rational target in targeted therapy-resistant melanoma cells and a key player in phenotypic plasticity of melanoma cells.
Reprogramming of cellular energy metabolism has been rediscovered recently as an emerging hallmark of cancer (Ward and Thompson 2012). In 1930, Otto Warburg identified alterations of energy metabolism in cancer cells (Warburg 1956). For ATP production, cancer cells switch from oxidative phosphorylation (OXPHOS) to glycolysis regardless of the oxygen supply, leading to a process called “aerobic glycolysis.” This switch is frequently associated with an enhanced glucose uptake that compensates for the poor energetic efficiency of glycolysis compared with OXPHOS.
BRAF oncogenic mutations, which increase glycolytic activity in a variety of cancer cells, particularly in melanoma, play a key role in this metabolic switch (Parmenter et al. 2014). The inhibition of glycolysis upon BRAF inhibitor (BRAFi) treatment participates in the therapeutic response (Baudy et al. 2012; Parmenter et al. 2014). However, as phenotypically and functionally plastic cells, melanoma cells can rewire their metabolism toward OXPHOS or glutaminolysis upon BRAFi exposure, a process that might dampen the efficacy of the drug and support tumor growth (Haq et al. 2013; Baenke et al. 2016; Falletta et al. 2017).
Therefore, these alternative metabolic pathways for energy supply or the restoration of glycolysis (Parmenter et al. 2014) might also contribute to the acquisition of resistance to BRAFi, leading to treatment failure in patients with BRAF mutated melanoma. Furthermore, glycolysis, OXPHOS, and glutaminolysis are intertwined with other key metabolic pathways, such as protein catabolism, which can fuel the Krebs cycle and fatty acid synthesis/β-oxidation pathways (through citrate and acetyl-CoA) that also represent alternative sources of energy.
In addition to the energy demand, cellular metabolism has been shown to interfere more globally with melanoma cell phenotype. Indeed, glutamine limitation causes a translational and transcriptional reprogramming of melanoma cells toward invasive and therapy-resistant phenotypes (Falletta et al. 2017). Therefore, obtaining a complete view of the different metabolic pathways deregulated upon BRAF inhibition in melanoma cells is pivotal to a better understanding of the mechanisms involved in the implementation of resistances and improvements in anti-melanoma therapies.
In the present study, using a global metabolic profiling, we disclose a down-regulation of the nicotinamide adenine dinucleotide (NAD+) levels by a BRAFi (PLX4032). We show that the BRAF/ERK pathway, through STAT5 activation, regulates the transcription of nicotinamide phosphoribosyltransferase (NAMPT), the key enzyme in the maintenance of cellular NAD+ levels. Importantly, forced NAMPT expression dampens the anti-proliferative effect of PLX4032 and leads to major transcriptomic and epigenetic unheavals that turn melanoma cells toward invasive and BRAFi-resistant phenotypes. Together, these observations point to NAMPT as a key player in BRAFi resistance and melanoma cell plasticity and as a potential target in melanomas.
Results
Alteration of metabolism by PLX4032 in BRAFV600E melanoma cells
To fully elucidate the effect of PLX4032 on the metabolism of melanoma cells, we performed global metabolic profiling using ultrahigh-performance liquid chromatography-tandem mass spectroscopy (UPLC-MS/MS) of two distinct human melanoma cell lines (UACC62 and WM9) that harbor the BRAFV600E mutation. Analysis of >500 metabolites identified 119 metabolites altered by treatment with PLX4032. A total of 60 metabolites was down-regulated, whereas 59 metabolites were up-regulated (Supplemental Table S1). In this list, only 52 metabolites are annotated in the Kyoto Encyclopedia of Genes and Genomes (KEGG) database or Human Metabolome Database (HMDB). Figure 1A shows the heat map of these annotated metabolites. Furthermore, analysis identified enrichment in glycolysis, citric acid, pyruvate metabolism, and mitochondrial electron transport chain function (Fig. 1B; Supplemental Table S2). All of the metabolites in these pathways were inhibited by PLX4032 treatment, indicating a global inhibition of the carbohydrate metabolism and energy production. Additionally, we observed that the majority of dipeptides, monoacylglycerols, and long-chain fatty acids species detected in our cells (Supplemental Fig. S1A–F) was up-regulated upon PLX4032 treatment, suggesting a global increase in protein catabolism and lipid metabolism. Note that these metabolites are poorly annotated in the KEGG database or HMDB, and therefore MetaboAnalyst (http://www.metaboanalyst.ca) or other tools did not identify any enrichment in these metabolite sets. A schematic view of the metabolic consequences of BRAF inhibition is provided (Supplemental Fig. S1G).
Figure 1.

PLX4032 decreases the levels of NAD+ in BRAFV600E melanoma cells. (A) Heat map of the top 40 metabolites significantly regulated by 5 µM PLX4032 for 24 h in WM9 and UACC62 cells. The deregulation of NAD metabolism is highlighted (red asterisk). (B) KEGG pathway analysis of metabolomic data by MetaboAnalyst. (Green) Metabolites in the subpathways are all down-regulated; (blue) metabolites in the subpathways can be up-regulated or down-regulated. (C) Intracellular NAD+ levels in a panel of BRAFV600E and wild-type BRAF (BRAFWT) human melanoma cells exposed or not to 5 µM PLX4032 for 24 h. The values represent the means + SD of five independent experiments.
Among the other metabolites affected by PLX4032 treatment, our attention was drawn by the inhibition of NAD+ levels and the global inhibition of nicotinamide metabolism (Fig. 1A,B). Because of the key role of NAD+ in numerous key cellular functions, such as metabolism (carbohydrate metabolism and energy production), post-translation modifications (ADP ribosylation), and epigenetics (deacetylation), we then focused our attention on the NAD+ metabolism. Dose response experiments in A375, WM9, and UACC62 (Supplemental Fig. S2A) showed that PLX4032 decreased cell numbers with an IC50 of ∼0.1 µM and a maximal effect between 1 and 5 µM (5 µM was used in the following experiments). We then extended the analysis of NAD+ levels in a larger panel of melanoma cell lines and short-term melanoma cell cultures. As expected, PLX4032 inhibited cell proliferation in BRAFV600E but not in wild-type BRAF (BRAFWT) human melanoma cells (Supplemental Fig. S2B). Importantly, PLX4032 reduced intracellular NAD+ levels in all BRAFV600E mutated melanoma cell lines but not in BRAFWT human melanoma cells (Fig. 1C). Furthermore, additional BRAFis as well as MEK and ERK inhibitors also decreased NAD+ levels, indicating that ERK pathway inhibition impacted NAD+ metabolism in melanoma cells (Supplemental Fig. S2C). Note that glucose-starved melanoma cells did not display changes in NAD+ levels, ruling out the inhibition of glucose metabolism as a confounding factor for lowering NAD+ levels (Supplemental Fig. S2D).
BRAFV600E regulates NAD+ levels and controls NAMPT expression through STAT5 activation
The NAD+ level is primarily maintained in human cells via the “salvage” pathway, in which NAMPT is the rate-limiting enzyme (Canto et al. 2015). Our results indicated that PLX4032 reduced NAMPT expression (Fig. 2A). Both NAMPT mRNA and NAD+ levels declined in parallel in response to PLX4032, which was compatible with the notion that the reduction of NAD+ in response to PLX4032 was a consequence of the inhibition of NAMPT expression (Supplemental Fig. S3A). No inhibition of NAMPT expression by PLX4032 was observed in BRAFWT human melanoma cells (Supplemental Fig. S3B).
Figure 2.

The BRAF/MEK/ERK signaling pathway regulates NAMPT expression at the transcriptional level. (A) Western blot analysis of NAMPT in BRAFV600E melanoma cells exposed or not to 5 µM PLX4032 for 48 h. Phospho-ERK analysis showed the efficiency of PLX4032, and ERK2 was used as loading control. (B,C) Analysis of publicly available data sets GSE42872 (n = 3) and GSE20051 (n = 5) of melanoma cells exposed to PLX4032. Scatter plots showing the means ± SD of the NAMPT mRNA expression are shown. (D) Activity of the NAMPT promoter in WM9 cells exposed to increasing doses of PLX4032 for 48 h. Data are shown as the means ± SD of three experiments. (E) Schematic representation of the NAMPT promoter showing two canonical (TTCxxxGAA) STAT5-binding sites (S#1 and S#2) and a nonrelevant amplicon (S#3). (F) A375 melanoma cells were left untreated or exposed to PLX4032 for 48 h. Chromatin immunoprecipitation (ChIP) was performed using antibodies directed against STAT5 and/or IgG antibody as a control. The isolated genomic DNA was analyzed by real-time PCR using primers surrounding S#1, S#2, or S#3. Data are shown as the means + SD of three experiments. (G) The activity of the NAMPT promoter reporter in A375 melanoma cells transfected with a control vector or a vector encoding a constitutively active form of STAT5. Data are shown as the means + SD of three experiments. (H) Western blot analysis of NAMPT, STAT5, and ERK in A375 and WM9 control cells or cells exposed to 5 µM PLX4032 or 100 µM STAT5 inhibitor for 48 h.
Analysis of publicly available microarray data sets (GSE20051 and GSE42872) confirmed the inhibition of NAMPT mRNA expression in BRAFV600E melanoma cell lines exposed to BRAFi (Fig. 2B,C).
The inhibition of NAMPT expression in A375 melanoma cells was also observed with the MEK inhibitors U0126, PD98059, and GSK1120212 (Trametinib) and the ERK inhibitor SCH77294, the efficiencies of which were shown on the inhibition of ERK phosphorylation levels (Supplemental Fig. S3C). We also observed the inhibition of NAMPT expression in publicly available microarray data (GSE51115) of melanoma cell lines exposed to the MEK inhibitor PD0325901 (Supplemental Fig. S3D).
Additionally, forced expression of BRAFV600E in normal human melanocytes stimulated the ERK signaling pathway and increased levels of NAMPT (Supplemental Fig. S3E), with a concomitant increase in NAD+ (Supplemental Fig. S3F). MEK and ERK inhibitors prevented up-regulation of NAMPT in normal melanocytes (Supplemental Fig. S3E).
Altogether, our data demonstrate that the BRAF/MEK/ERK signaling cascade plays a key role in the control of NAMPT expression and the regulation of NAD+ metabolism in melanoma cells.
Changes in NAMPT mRNA levels suggested that the BRAF/ERK pathway controlled NAMPT at the transcriptional level. Using a human NAMPT promoter luciferase reporter construct, we showed that PLX4032 induced a dose-dependent decrease in NAMPT promoter activity in both WM9 (Fig. 2D) and A375 cells (Supplemental Fig. S4A). MEK and ERK inhibitors also strongly reduced NAMPT promoter activity (Supplemental Fig. S4B). To identify the regulatory elements, we assessed the effect of PLX4032 on human NAMPT promoter constructs of different lengths. The results revealed that the BRAF/ERK-responsive element was localized between −1182 and −2682 base pairs (bp) upstream of the transcriptional start site (TSS) (Supplemental Fig. S4C). Within this region, Sun et al. (2014) reported STAT5-binding sites promoting NAMPT gene transcription in response to the mechanical stress signal. Therefore, we hypothesized that in melanoma cells, the ERK pathway might control NAMPT expression through STAT5 activation. Analysis of the −1182/−2682 fragment identified two canonical (TTCxxxGAA) STAT5-binding sites at −1260 (S#1) and −1963 (S#2) (Fig. 2E). Next, we performed ChIP-qPCR (chromatin immunoprecipitation [ChIP] combined with quantitative PCR [qPCR]) assays with control or anti-STAT5 antibodies. When using a set of primers spanning the S#1 STAT5-binding site, we observed an enrichment of chromatin immunoprecipitated with STAT5 antibody (compared with control IgG) that was dramatically reduced in cells exposed to PLX4032 (Fig. 2F, middle panel). In contrast, no enrichment was observed when using sets of primers spanning the S#2 STAT5-binding site or located in the 1-kb proximal region (S#3). These data demonstrated that STAT5 bound to the NAMPT promoter.
In agreement with this observation, we showed in A375 cells that STAT5 inhibitor decreased both basal and BRAFV600E-stimulated NAMPT promoter activity, thereby demonstrating the involvement of STAT5 in the BRAFV600E-induced stimulation of NAMPT transcription (Supplemental Fig. S4D). Additionally, a constitutively active form of STAT5 (Onishi et al. 1998) was sufficient to drive the transactivation of the NAMPT promoter (Fig. 2G).
Furthermore, in both A375 and WM9 cells, PLX4032 inhibited both ERK and STAT5 phosphorylation, while the STAT5 inhibitor efficiently reduced STAT5 phosphorylation but did not affect ERK phosphorylation (Fig. 2H). Both BRAF and STAT5 inhibitors decreased NAMPT expression (Fig. 2H) and NAD+ levels (Fig. 1D; Supplemental Fig. S4E). In the NRASQ61K mutated melanoma HMVII cells, PLX4032 had no effect on either ERK or STAT5 phosphorylation, while the STAT5 inhibitor efficiently reduced STAT5 phosphorylation and NAMPT expression (Supplemental Fig. S4F). The STAT5 inhibitor also translated into a parallel decrease in NAD+ levels (Supplemental Fig. S4G).
Taken together, these data demonstrate that the BRAF/ERK pathway regulates NAMPT expression and, consequently, NAD+ levels at the transcriptional level through STAT5 activation.
NAMPT controls melanoma cell proliferation
To determine the impact of NAD+ metabolism on melanoma cell proliferation, we silenced NAMPT using siRNAs and inhibited its function with FK866, a highly specific noncompetitive inhibitor. As expected, two different NAMPT siRNAs efficiently inhibited NAMPT expression in WM9 cells (Fig. 3A) and NAD+ levels (Fig. 3B). FK866 did not affect NAMPT expression (Fig. 3A) but decreased NAD+ levels (Fig. 3B). Similar results were obtained in A375 and UACC62 cells (Supplemental Fig. S5A,B). FK866 caused a dose-dependent reduction of NAD+ level in the three cell lines tested, with a similar IC50 of ∼0.3 µM and a maximal effect at 1 µM (Supplemental Fig. S5C). FK866 also caused a dose-dependent inhibition of cell number, with a IC50 of ∼3 µM in A375 and UACC62 and 0.5 µM in WM9. In the three cell lines, the maximal effect was obtained between 1 and 5 µM; 5 µM was used in the following experiments (Supplemental Fig. S5D).
Figure 3.

NAMPT inhibition decreases melanoma cell proliferation and xenograft development and restores PLX4032 sensitivity. (A) Western blot analysis of NAMPT expression in WM9 melanoma cells transfected with control (Ctl) siRNA or two different NAMPT siRNAs (si#1 and si#2) or exposed to a NAMPT inhibitor (FK866). HSP90 was used as loading control. (B) Intracellular NAD+ levels in WM9 melanoma cells treated as in A. Values represent the means + SD of three independent experiments. (C) Proliferation of WM9 melanoma cells treated as in A. Cells were trypsinized and counted each day. Values represent the means ± SD of three independent experiments. (D) Cell number of WM9 melanoma cells exposed to 5 µM FK866 or 500 µM FK866 plus NAD+ for 72 h. Values represent the means + SD of three independent experiments. (E) Growth curve of tumor xenografts after subcutaneous injection of WM9 cells. Mice (six per group) were treated or not with PLX4032 or FK866. Data are shown as the means ± SD of tumor volume. The black arrow indicates the beginning of the treatment. (F) PLX4032-resistant WM9 melanoma cells were transfected with control or NAMPT siRNA (si#1 and si#2) and subsequently exposed to 5 µM PLX4032. After 72 h, the cells were counted. The histogram represents the means + SD of three independent experiments. (G) Cell number of PLX4032-resistant WM9 melanoma cells exposed to 5 µM FK866 or 500 µM FK866 plus NAD+ for 72 h. Data are presented as the means + SD of three independent experiments. (H) Growth curve of tumor xenografts after subcutaneous injection of WM9 cells resistant to PLX4032. Mice (six per group) were treated with vehicle, PLX4032, or FK866. Data are shown as the means ± SD of tumor volume. The black arrow indicates beginning of the treatment. (I) Frozen sections of xenografts were stained with DAPI and subjected to transferase-mediated UTP nick end labeling (TUNEL). Representative images are shown.
Accordingly, we showed that FK866 or NAMPT knockdown by siRNA elicited a dramatic inhibition of WM9 melanoma cell proliferation (Fig. 3C). Interestingly, the addition of exogenous NAD+ to the culture medium prevented FK866-mediated inhibition of cell proliferation, thereby demonstrating that the effect of FK866 was causally associated with NAD+ depletion and not with nonspecific effects (Fig. 3D). Similar data were obtained in the A375 and UACC62 cell lines (Supplemental Fig. S5E,F). Flow cytometry analysis of DAPI-permeable cells showed that NAMPT inhibition by siRNA or FK866 increased melanoma cell death (Supplemental Fig. S6A).
We next monitored the effect of PLX4032 and FK866 in vivo. WM9 cells were subcutaneously engrafted into 6-wk-old female athymic nude mice. When the tumors became palpable (0.1–0.2 cm3), the mice were treated every 2 d with the vehicle (labrafil) or PLX4032 or FK866 alone. Compared with the vehicle, both PLX4032 and FK866 treatments impaired WM9 melanoma cell xenograft growth (Fig. 3E). PLX4032 and FK866 caused no weight loss in the treated mice (data not shown). qRT–PCR analysis revealed decreased NAMPT expression in PLX4032-treated tumors (Supplemental Fig. S6B). A reduced NAD+ level was also observed (Supplemental Fig. S6C).
Next, we evaluated the effect of NAMPT inhibition on BRAFi-resistant melanoma cells. As expected, BRAFi-resistant WM9 melanoma cells (WM9R) were not sensitive to PLX4032's effects but were sensitive to NAMPT knockdown by two siRNAs (Fig. 3F) and NAMPT inhibition by FK866 (Fig. 3G). Importantly, the effects of FK866 were reversed by addition of NAD+. Interestingly, although NAMPT inhibition had a marked effect on BRAFi-resistant cells, we observed a statistically significant restoration of PLX4032 sensitivity in BRAFi-resistant cells upon depletion of NAMPT (Fig. 3F). Similar observations were obtained in BRAFi-resistant A375 melanoma cells (A375R) (Supplemental Fig. S7A,B).
As expected, xenografts derived from WM9R cells were not affected by PLX4032. In contrast, FK866 inhibited tumor growth (Fig. 3H). The combination of the low-dose FK866 resulted in additive growth inhibition. Terminal deoxynucleotidyl transferase-mediated UTP nick end labeling (TUNEL) staining revealed apoptotic cells in tumor sections from FK866-treated mice compared with control or PLX4032-treated mice (Fig. 3I).
We performed in vivo experiments on A375R cells (Corazao-Rozas et al. 2013) with 25 mg/kg PLX4032 or two doses of FK866 (1.5 mg/kg and 15 mg/kg) alone or with the low FK866 dose in combination with PLX4032 (Supplemental Fig. S7C). In contrast to PLX4032, increasing doses of FK866 dose-dependently reduced melanoma progression. As expected, a reduction in NAD+ was observed in the FK866-treated tumors (Supplemental Fig. S7D). The combination of both PLX4032 and FK866 resulted in a synergistic inhibition of melanoma growth. Thus, both in vitro and in vivo, FK866 treatment caused melanoma cell death and restored PLX4032 sensitivity in BRAFi-resistant melanoma cells. Altogether, the striking effect of NAMPT inhibition on BRAFi-resistant melanoma xenografts suggested that targeting NAMPT might be a valid therapeutic option to overcome BRAFi resistance.
NAMPT induces drug resistance and activates an invasive gene program
We next examined whether NAMPT might affect the response to PLX4032. Forced expression of NAMPT (Fig. 4A) enhanced the intracellular NAD+ level (Fig. 4B) but did not significantly affect proliferation (data not shown). Furthermore, forced expression of NAMPT or addition of exogenous NAD markedly decreased the efficiency of PLX4032 in inhibiting the proliferation of melanoma cells (Fig. 4C,D). To understand how NAMPT can favor the acquisition of resistance to BRAFi, we performed a transcriptomic analysis of three different melanoma cell lines (WM9, M14, and SKmel28) in control conditions or after forced expression of NAMPT. Differential expression and statistical analysis indicated that 1111 genes were regulated (449 down-regulated and 662 up-regulated). Ingenuity Pathway Analysis identified a striking increase in the functions associated with cell movement and migration (top 10 functions) (Supplemental Table S3). Among the top 10 upstream activators, TNF, TGFB, and SMARCA4 were increased, while MITF was decreased (Table 1). These observations indicated that increased NAMPT expression may activate TNF and TGFβ pathways (Supplemental Fig. S8A,B). Interestingly, we also observed that genes down-regulated by NAMPT clustered with the proliferation gene profile described previously (Hoek et al. 2008; Verfaillie et al. 2015), while the up-regulated genes were associated with the invasive genes (Fig. 4E). Therefore, NAMPT induced a phenotypic switch toward the invasive phenotype that has been frequently associated with resistance to targeted therapies.
Figure 4.

NAMPT affects the sensitivity of melanoma cells to BRAFis. (A) Western blot analysis of NAMPT expression in A375 and WM9 melanoma cells transduced with a control empty adenovirus (EV) or an adenovirus encoding NAMPT (Ad NAMPT). HSP90 was used as a loading control. (B) Intracellular NAD+ levels in A375 and WM9 melanoma cells transduced with a control or NAMPT adenovirus. Values represent the means + SD of three independent experiments. (C) A375 and WM9 melanoma cells transduced with a control or NAMPT adenovirus were exposed to 5 µM PLX4032. After 72 h, the cells were counted. The histogram represents the means + SD of three independent experiments. (D) The number of A375 and WM9 melanoma cells exposed to 5 µM FK866 or 500 µM FK866 plus NAD+ for 72 h. Values represent the means + SD of three independent experiments. (E) Heat map from transcriptomic analysis showing the gene expression level and clustering according to the invasive and proliferative signature from Verfaillie et al. (2015). (Blue) Down-regulated genes; (red) up-regulated genes.
Table 1.
Potential upstream regulators of the NAMPT transcriptional program in melanoma cells
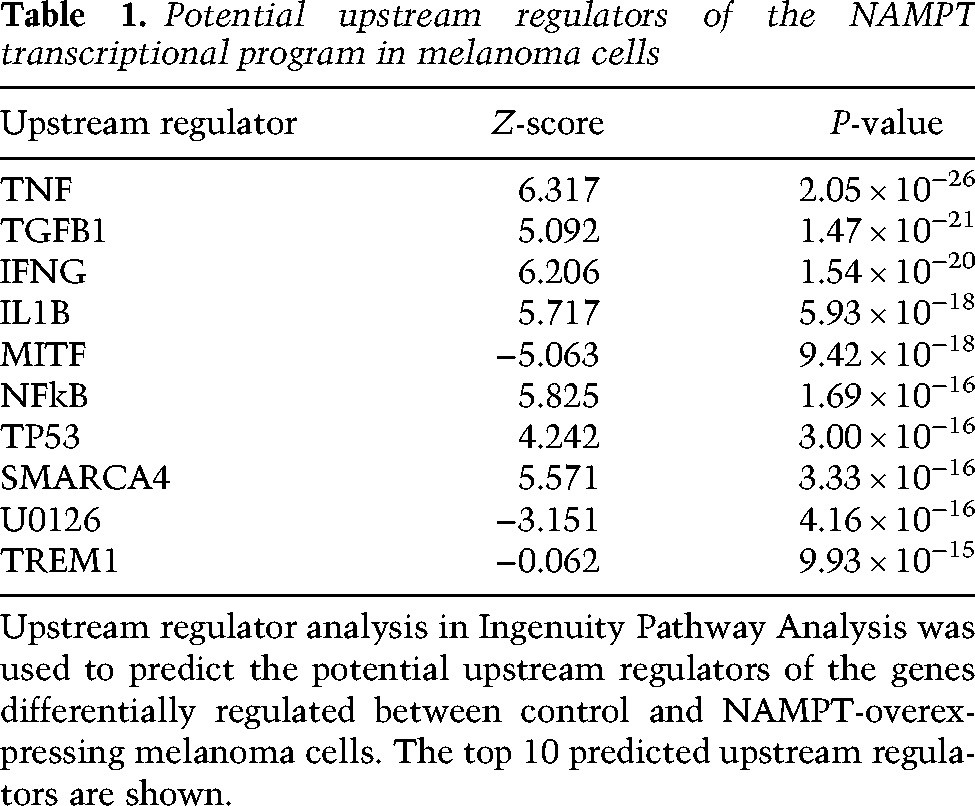
Of note, SMARCA4 (BRG1), which is activated in our analysis, is a MITF partner and a key player in the regulation of chromatin remodeling, suggesting that increased NAMPT expression might affect the epigenetic landscape.
NAMPT induced a reshuffling of the epigenetic landscape
To identify the effect of NAMPT on the epigenetic landscape, we performed ChIP-seq (ChIP combined with high-throughput sequencing) analyses of key activating (H3K27ac and H3K4me3) or repressive (H3K27me3) histone marks. Comparative analysis of the ChIP-seq data using read density matrix clustering (SeqMiner) identified 41,000 peaks within 12 clusters (Fig. 5A), among which six (1–6) out of 12 showed an alteration of histone marks by NAMPT. Clusters 2, 3, and 5 showed an increase in H3K4me3 marks, and clusters 1, 2, and 6 showed an increase in H3K27me3 marks. H3K27ac marks were decreased in cluster 4 and increased in cluster 3 together with H3K4me3 marks (Supplemental Fig. S9). Further analysis indicated that among the 662 up-regulated genes, 356 displayed enhanced active marks (H3K27ac and H3K4me3) and/or decreased repressive marks (H3K27me3) (Fig. 5B). Only 15 genes overlapped with a decrease in active marks and/or an increase in repressive marks (Supplemental Fig. S10A). Among the 449 down-regulated genes, 68 overlapped with a decrease in active marks and/or an increase in repressive marks (Fig. 5C), and 21 genes had an increase in active marks (H3K27ac and H3K4me3) and/or a decrease in repressive marks (Supplemental Fig. S10B). A track view of our data in the University of California at Santa Cruz (UCSC) browser of genes associated with the proliferative profile such as M-MITF (Fig. 5D), CDK2, and BIRC7 (Supplemental Fig. S11A,B) or with the invasive profile such as AXL (Fig. 5E), ITGB4, and WNT5A (Supplemental Fig. S11C,D) suggested that forced NAMPT expression induced a reshaping of the epigenetic landscape that led to a transcriptomic switch toward the invasive phenotype associated with resistance to targeted and immunotherapies (Muller et al. 2014; Falletta et al. 2017).
Figure 5.

NAMPT changes the histone mark landscape. (A) SeqMiner cluster heat maps showing signal intensities for H3K27me3, H3K27ac, and H3K4me3 in the region ±5 kb around the TSS in control or NAMPT-overexpressing 501mel melanoma cells. (B) Venn diagram displaying the intersection of genes up-regulated by NAMPT with active histone marks up-regulated and repressive histone marks down-regulated by NAMPT. (C) Venn diagram displaying the intersection of genes down-regulated by NAMPT with active histone marks down-regulated and repressive histone marks up-regulated by NAMPT. (D) UCSC browser view of H3K27ac and H3K4me3 ChIP-seq binding density at the MITF locus. (E) UCSC browser view of H3K27ac and H3K4me3 ChIP-seq binding density at the AXL locus.
NAMPT induced a switch toward an invasive phenotype
Finally, as predicted by the epigenetic and transcriptomic analysis, Boyden chamber experiments demonstrated that forced NAMPT expression increased the motile capacity of WM9 cells (Fig. 6A). Western blot analysis confirmed the increased expression of NAMPT and demonstrated the up-regulation of fibronectin expression and an inhibition of MITF expression (Fig. 6B), in agreement with a switch toward an invasive phenotype. These results have been obtained also in two additional cell lines: 501Mel and SKMel28 (Supplemental Fig. S12A–D). Furthermore, transduction of WM9 at low multiplicity of infection (MOI) with NAMPT-GFP adenovirus resulted in expression of NAMPT in ∼70% of cells, visualized by GFP. Cells exhibited a loss of MITF expression exclusively in GFP-positive cells (Fig. 6C). Finally, we showed that ZEB1 (Caramel et al. 2013), which has been reported as a key player in pseudo-EMT (epithelial–mesenchymal transition) and phenotypic switch in melanoma cells, was down-regulated by NAMPT silencing and up-regulated by forced NAMPT expression (Fig. 6D). In line with that, ZEB1 was dramatically increased in the transcriptomic analysis and underwent deep epigenetic reshuffling (Supplemental Fig. S12E). In conclusion, these data unveil how NAMPT, through epigenetic remodeling of genes that mediate the phenotypic switch, regulates the motile properties of melanoma cells.
Figure 6.

NAMPT enhances the motile capacity of melanoma cells. (A) Boyden chamber experiments of control or NAMPT-overexpressing WM9 melanoma cells. Values represent means + SD of three independent experiments. Representative images are shown. (B) Western blot analysis of MITF, fibronectin (FN), and NAMPT of control or NAMPT-overexpressing WM9 melanoma cells. HSP90 was used as a loading control. (C) Immunofluorescence of NAMPT and MITF in WM9 cells. (D) Western blot analysis of NAMPT and ZEB1 NAMPT in WM9 melanoma cells transfected with siRNA to NAMPT or infected with NAMPT adenovirus. HSP90 was used as a loading control.
Discussion
Here, our findings reveal that the BRAF/MEK/ERK signaling cascade impacts cellular metabolism beyond its well-known effect on glucose metabolism. Indeed, we showed that metabolites from the glycolytic pathway, such as 3-phosphoglycerate, phosphoenolpyruvate, pyruvate, and lactate were down-regulated in PLX4032-treated melanoma cells, while upstream metabolites (fructose 6-P, fructose 1-6-P2, and glyceraldehyde 3-P) were unaffected. Of note, the glucose 6-P level was decreased (log fold change = −1.9) but did not reach the statistical threshold (false discovery rate = 0.058). This observation can be explained by the inhibition of glucose uptake (Parmenter et al. 2014) and hexokinase 2 expression (Parmenter et al. 2014; Delgado-Goni et al. 2016) caused by BRAF inhibition. In line with that, PLX4032 induced an alteration of the tricarboxylic acid (TCA) cycle, as illustrated by a decrease in α-ketoglutarate, fumarate, and malate levels.
Remarkably, melanoma cells treated with PLX4032 displayed evidence of enhanced lipid metabolism, since a global increase in several types of lipids (monoacyl-glycerol and fatty acids) was observed. These findings suggest that upon BRAF inhibition, melanoma cells shift from glucose to lipid metabolism and may use fatty acid β-oxidation as a source of energy. Further studies have been undertaken to dissect the molecular mechanisms of this metabolic rewiring and determine the role of lipid metabolism in the effects of PLX4032.
Another key metabolic alteration caused by PLX4032 is the decrease in the cellular content of NAD+. Therefore, although melanoma cells exposed to PLX4032 implement alternative energy production pathways, these pathways would be impaired by the decrease in NAD+ levels, as NAD+ is a key cofactor in glycolysis, citric acid cycle, and β-oxidation.
Our results reveal that NAMPT, the rate-limiting enzyme in the NAD+ salvage pathway, is positively controlled by the BRAF/MEK/ERK pathway. Consistent with this observation, NAMPT shows higher expression in melanoma cells that frequently harbor a constitutive activation of the ERK pathway, compared with melanocytes or nevi (Wachsman et al. 2011; Maldi et al. 2013). We provided evidence that BRAFV600E controls NAMPT expression at the transcriptional level and identified the transcription factor STAT5 as the main effector of BRAFV600E effects on NAMPT expression. In line with that, it has been shown previously that STAT5 is activated by the ERK pathway (Maki and Ikuta 2008). Furthermore, we demonstrated that the STAT5 inhibitor decreased NAMPT expression and the NAD+ cellular content in both BRAFWT and BRAF mutated melanoma cells. Accordingly, STAT5 was reported to favor melanoma cell proliferation and survival, and the constitutive activation of STAT5 is correlated with the aggressiveness of melanoma (Mirmohammadsadegh et al. 2006; Hassel et al. 2008). Together, these data suggest that STAT5 inhibition alone or in combination with BRAFis might be a valuable strategy for melanoma treatment. Of note, STAT5 is also essential for T-cell survival and immune responses toward melanoma tumors (Tripathi et al. 2010). Therefore, the benefit/risk ratio of using STAT5 inhibitors must be carefully evaluated.
Next, we showed that the inhibition of NAMPT expression by specific siRNA or activity by the pharmacological inhibitor FK866 decreased the NAD+ content and proliferation of melanoma cells. A previous study reported that among the six cell lines tested, only one cell line (HMCB) displayed a reduction of proliferation in response to NAMPT inhibition (Maldi et al. 2013). NAMPT inhibition also promoted a marginal effect on mouse B16 melanoma cell proliferation in vitro (Grolla et al. 2015)
NAMPT inhibition also affects the proliferation of BRAFi-resistant melanoma cells and at least partially restores the response to PLX4032. In vivo, FK866 efficiently inhibited the development of BRAFi-sensitive or BRAFi-resistant melanoma tumor xenografts, and low doses of FK866 (1.5 mg/kg) resensitized BRAFI-resistant tumors to PLX4032. Taken together, these observations suggest that NAMPT inhibition might represent a rational strategy to overcome resistance to targeted therapies.
Interestingly, NAMPT-overexpressing melanoma cells were more resistant to the effects of PLX4032 than the parental control cells, demonstrating the causal role of NAMPT in the resistance to BRAFis. Furthermore, transcriptomic and ChIP-seq analyses showed that NAMPT overexpression modified active (H3K27ac and H3K4me3) and repressive (H3K27me3) histone marks and gene expression profiles favoring the phenotypic switch of melanoma cells toward the invasive phenotype, characterized by an increased invasiveness and expression of genes associated with pseudo-EMT (ZEB1 and FN1) and resistance to targeted and immunotherapies (Muller et al. 2014; Riesenberg et al. 2015; Falletta et al. 2017).
Beyond its role in metabolism and energy-producing pathways (glycolysis, citric acid cycle, glutaminolysis, and β-oxidation), NAD+ serves as a cofactor for numerous other enzymes and pathways. SIRTs and PARPs require NAD+ for functioning (Bai and Canto 2012; Houtkooper et al. 2012). Both enzymes play a critical role in melanoma biology, as (1) melanoma cells overexpressing SIRT1 were more resistant to BRAFis (Ohanna et al. 2014), and (2) PARP1 inhibition altered the invasive properties of melanoma cells (Rodriguez et al. 2013). Furthermore, SIRT1 (Jing and Lin 2015) and PARP1 (Ciccarone et al. 2017) have a direct involvement in epigenetic regulation that could explain the deep changes in histone marks evoked by NAMPT.
Additionally, NAD+ might have a direct impact on transcriptional regulation through its binding to the transcriptional corepressors CtBPs (Balasubramanian et al. 2003) that has been also involved in epigenetic regulation through its interaction with histone demethylase KDM1A (LSD1) (Ray et al. 2014). Notably, CtBP2 was reported to inhibit the expression of MITF, a key driver of melanoma phenotypic switching (Liang et al. 2011).
Now, it remains to be understood why NAMPT affects only a specific subset of genes. Of note, numerous MITF target genes are regulated by NAMPT, and our analyses showed an activation of the BRG1 pathway. BRG1 interacts with MITF in chromatin remodeling complexes that also contain KDM1A (Laurette et al. 2015), indicating a link between the NAD+, CtBP, and MITF/BRG1 complexes and specific histone modifications at the regions occupied by these complexes. Of course, NAD+ may affect other chromatin remodeling complexes that are not positioned at MITF target loci.
Reflecting their high metabolic demand, malignant cells display higher NAD+ levels than their normal counterparts and are particularly sensitive to NAD+ depletion (Kennedy et al. 2016). A recent report demonstrated that IDH1 mutant cancer cells showed extreme vulnerability to NAD+ depletion (Tateishi et al. 2015). None of the melanoma cells used in the present study showed an IDH1 mutation, but we cannot rule out the likelihood that IDH1 activity is affected by nongenetic alterations. Furthermore, the sensitivity (at least in vitro) of NRAS mutated melanoma to FK866 suggests that NAMPT inhibition might be an alternative therapeutic strategy in this subset of melanomas that has a poorer outcome compared with other melanomas (Johnson et al. 2016). Several phase 1 clinical trials using NAMPT inhibitors (CHS828 or FK866) have been conducted in patients with advanced solid tumor malignancies, including melanomas (Ravaud et al. 2005; Holen et al. 2008; von Heideman et al. 2010). Toxicities are globally manageable, but no overall tumor response was described. However, in a clinical trial that enrolled two patients with melanomas, one patient showed disease stabilization (Holen et al. 2008).
Despite the huge progress in metastatic melanoma treatment using checkpoint immunotherapies or targeted therapies (Luke et al. 2017), most patients are resistant or will develop resistance to these treatments. Resistance can be driven by genetic events, but phenotypic switch, which is generated by epigenetics events and rewiring of transcriptomic and metabolic networks, is the main cause of resistance (Hugo et al. 2015). Our study indicates that NAMPT functions downstream from BRAF/ERK pathways and plays a pivotal role in the switch of melanoma cells toward the invasive and resistant phenotype. Therefore, it might be worthwhile to reassess NAMPT inhibitors in the treatment of melanomas resistant to targeted therapies but also as adjuvant therapy to prevent the acquisition of resistance in the course of the treatment.
Materials and methods
Cell cultures and reagents
Human melanoma cell lines and short-term cultures derived from different patients with metastatic malignant melanoma cells were grown in DMEM supplemented with 7% FBS at 37°C in a humidified atmosphere containing 5% CO2. PLX4032-sensitive and PLX4032-resistant melanoma cells were described previously (Bonet et al. 2012; Ohanna et al. 2014). Lipofectamine RNAiMAX and Opti-MEM medium were purchased from Invitrogen. FK866 was obtained from Sigma, U0126 and GSK1120212 were purchased from Euromedex, and PD98059 and SCH77294 were obtained from Selleck Chemicals. The STAT5 inhibitor (CAS 285986-31-4) was purchased from Sigma. Intracellular NAD+ was measured using the NAD/NADH quantitation kit from Sigma according to the manufacturer's instructions.
Metabolomic profiling
Briefly, samples were prepared using the automated MicroLab STAR system (Hamilton Company). Recovery standards were added prior to the first step in the extraction process for quality control purposes. Cell lysates were precipitated using methanol with vigorous shaking for 2 min followed by centrifugation. The resulting extract was divided into five fractions: two samples for analysis using two separate reverse-phase (RP)/UPLC-MS/MS methods with positive ion mode electrospray ionization (ESI), one sample for analysis through RP/UPLC-MS/MS with negative ion mode ESI, one sample for analysis through hydrophilic interaction chromatography (HILIC)/UPLC-MS/MS with negative ion mode ESI, and one sample reserved for backup. The samples were briefly placed on a TurboVap (Zymark) to remove the organic solvent. The sample extracts were stored overnight under nitrogen prior to preparation for analysis. Chromatography analyses were performed using Waters Acquity UPLC and a Thermo Scientific Q-Exactive high-resolution/accurate mass spectrometer interfaced with a heated ESI (HESI-II) source and an Orbitrap mass analyzer operated at 35,000 mass resolution. The sample extract was dried and subsequently reconstituted in solvents compatible with each method (Miller et al. 2015). The informatics system comprised four major components: the laboratory information management system (LIMS), the data extraction and peak-identification software, data processing tools for quality control and compound identification, and a collection of information interpretation and visualization tools for subsequent data analysis. The hardware and software foundations for these informatics components were the LAN backbone and a database server running Oracle 10.2.0.1 Enterprise Edition (Evans et al. 2009).
Western blot assays
Western blotting was performed as described previously (Hilmi et al. 2008; Bertolotto et al. 2011). Briefly, 30 µg of cell lysates was separated using SDS-PAGE, transferred onto a PVDF membrane, and subsequently exposed to the appropriate antibodies: anti-ERK2 (clone D-2; Santa Cruz Biotechnology, sc-1647), anti-phospho-ERK1/2 (Thr202/Tyr204) (Cell Signaling Technology, Inc., 2370), anti-BRAF (clone F-7; Santa Cruz Biotechnology, sc-5284), anti-NAMPT (Sigma, B5812), anti-phospho-STAT5 (Tyr694) (Ozyme, 9351), anti-STAT5 (Ozyme, 9363), and anti-HSP90 (Santa Cruz biotechnology, sc-13119). The proteins were visualized using the ECL system (Amersham). The Western blots shown are representative of at least three independent experiments.
Transient transfection of siRNA
Briefly, a single pulse of 50 nM siRNA was administered to the cells at 50% confluency through transfection with 5 µL of Lipofectamine RNAiMAX in Opti-MEM medium (Invitrogen). NAMPT siRNAs (On Target Plus, Dharmacon) were obtained from ThermoFisher Scientific.
Cell proliferation
The cells (10 × 103 cells) were seeded onto 12-well dishes and, at 48 h after transfection or treatment, trypsinized from days 1 to 4 and counted in triplicate using a hemocytometer. The experiments were performed at least three times.
Luciferase reporter assays
NAMPT promoter luciferase reporters were provided by Dr. J.G.N. Garcia (University of Arizona). We used three constructs containing the following regions of human NAMPT: −2682/+346, −1182/+346, and −582/+346 bp (Sun et al. 2014). A375 melanoma cells were transiently transfected as described previously using Lipofectamine reagent (Invitrogen) (Bertolotto et al. 1998). Briefly, the cells were transiently transfected with 0.3 µg of NAMPT reporter constructs and 0.05 µg of pCMVßGal to control the variability in transfection efficiency. The transfection medium was changed after 6 h, and, where indicated, the cells were transfected with an empty vector or a vector encoding BRAFV600E or treated with PLX4032 or a STAT5 inhibitor. The cells were assayed for luciferase and β-galactosidase activities after 48 h. The experiments were repeated at least three times.
Colony formation assay
Human melanoma cells were seeded onto six-well plates. The cells were subsequently placed in an incubator at 37°C and 5% CO2. Colonies of cells were grown before being stained with 0.04% crystal violet/2% ethanol in phosphate-buffered saline (PBS) for 30 min. Photographs of the stained colonies were captured. The colony formation assay was performed in duplicate.
Cell death analysis by flow cytometry
Cells were seeded at a density of 50 000 cells per well in 24-well plates and treated with FK866 for the indicated times. Cells were harvested using accutase enzyme, washed twice with ice-cold PBS, resuspended in medium with 1 µg/mL DAPI, and incubated for 15 min at room temperature (25°C) in the dark. Samples were immediately analyzed by a flow cytometer (MACS Quant) using a laser at 405-nm excitation with a band-pass filter at 425 and 475 nm for DAPI detection.
mRNA preparation and real-time qPCR
The mRNA was isolated using TRIzol (Invitrogen) according to a standard procedure. qRT–PCR was performed using SYBR Green I (Eurogentec) and Multiscribe reverse transcriptase (Applied Biosystems) and subsequently monitored using the ABI Prism 7900 sequence detection system (Applied Biosystems). The detection of the hRSP14 gene was used to normalize the results. Primer sequences for each cDNA were designed using either Primer Express software (Applied Biosystems) or qPrimer Depot (http://primerdepot.nci.nih.gov), and these sequences are available on request.
ChIP-qPCR
Cross-linked chromatin was prepared as described previously (Aparicio et al. 2005). STAT5 ChIP was performed on unstimulated and PLX4032-stimulated A375 melanoma cells (5 × 10⁷ cells per condition) using STAT5 antibody (D2O6Y, Ozyme) or an isotype-matched control immunoglobulin (Ozyme) and analyzed by real-time PCR. Data are expressed as a percentage of input DNA.
The genomic sequence of NAMPT (−3000 relative to the TSS up to the polyA) was searched for STAT5-binding sites using Genomatix software (https://www.genomatix.de). Forward and reverse real-time PCR primers used for the human genomic DNA analysis were as follows (primers specific for STAT5-binding site-containing regions are underlined, and the others are control primers): F-1946 (5′-TTCCTTCTTTGAATTGCACTCC-3′), R-2052 (5′-GATTACAGACGTGAGCCACC-3′), F-2790 (5′-TTTCTCAGGTCCTCTACATGC-3), R-2880 (5′-GCCTGTAGTCCCAGCTTCTC-3′), F-1334 (5′-ACTTCCATGATCTTTGCCCT-3′), and R-1523 (5′-GGTAGTGGAACTTGTGAATTGAG-3′).
Boyden chamber experiments
Cell migration was assessed using a modified Boyden chamber assay with 8-µm pore filter inserts for 24-well plates (BD Bioscience). Cells were seeded on the upper chamber of a transwell, and DMEM and 7% FBS were placed into the lower chamber. Cells that adhered to the underside of the filters were fixed with 4% paraformaldehyde (PFA) and stained with 0.4% crystal violet, and five random fields at 20× magnification were counted. Results represent the average of triplicate samples from three independent experiments.
Immunofluorescence studies
Cells were fixed and permeabilized as described previously (Ohanna et al. 2011) before being exposed to anti-MITF or anti-NAMPT antibodies. Cells were washed three times with PBS, incubated for 1 h with 1:1000 dilution anti-mouse Alexa fluor 594-labeled and anti-rabbit Alexa fluor 488-labeled secondary antibodies (Invitrogen), and mounted using Gel/Mount (Biomeda Corp.). Frozen sections of melanoma xenografts were fixed with 4% PFA (Sigma-Aldrich) for 15 min and subsequently blocked with 10% normal goat serum (Vector Laboratories) with or without 0.1% Triton X-100 (Bio-Rad) in PBS for 30 min at room temperature. The samples were incubated with primary antibodies overnight at +4°C followed by the appropriate secondary fluorescent-labeled antibodies (Invitrogen Molecular Probes) for 1 h at room temperature and mounted using Gel/Mount (Biomeda Corp.). The nuclei were counterstained with DAPI. Apoptosis in melanoma xenografts was detected through a TUNEL assay using an in situ cell apoptosis kit (R&D Systems). Immunofluorescence was examined and photographed using a Zeiss Axiophot microscope equipped with epifluorescence illumination.
Gene expression profiling and bioinformatics
Total RNA of three different cell lines transfected with control scrambled siRNA or siRNA to NAMPT was isolated with Trizol. The RNA integrity (RIN) was assessed by using an Agilent Bioanalyzer 2100 (Agilent Technologies) (RIN >8). RNA samples were then labeled with Cy3 dye using the low RNA input QuickAmp kit (Agilent) as recommended by the supplier. Labeled cRNA probes (825 ng) were hybridized on 8x60K high-density SurePrint G3 gene expression Human Agilent microarrays. Normalization of microarray data was performed using the Limma package available from Bioconductor (http://www.bioconductor.org). Interslide normalization was performed using the quantile method. Means of ratios from all comparisons were calculated, and t-test analysis was performed. Differentially expressed genes were selected based on Abs log fold change > 1 and adjusted P-value < 0.05. Data from expression microarrays were analyzed for enrichment in biological themes using Ingenuity Pathway Analysis software (http://www.ingenuity.com).
ChIP-seq
501Mel cells infected with empty adenovirus (EV) or NAMPT adenovirus were subjected to ChIP using antibodies for H3K27ac, H3K27me3, and H3K4me3 (Active Motif). Libraries from ChIP and input DNA were then sequenced on a NextSeq500 sequencer (Illumina) with single-end 75-bp read chemistry.
Reads from ChIP-seq were mapped to the human genome release hg19 using the BWA (Li and Durbin 2009) algorithm with default settings. Peaks were called using MACS2 (Zhang et al. 2008), comparing the immunoprecipitation samples against total chromatin input. Peaks were then annotated according to their positions on known exons with HOMER (Heinz et al. 2010). We performed a differential peaks enrichment analysis of the closest TSS-binding sites (<2 kb; NAMPT vs. EV) for each mark. Differentially expressed genes were selected based on Abs log fold change > 1.
The seqMiner (Ye et al. 2011) program was used to calculate the ChIP-seq read densities around the TSS (±2 kb) with the K-means clustering method to produce heat maps.
Animal experimentation
Animal experiments were performed in accordance with French law and approved by a local institutional ethical committee. The animals were maintained on a 12-h light/dark cycle in a temperature-controlled facility at 22°C and provided free access to food (standard laboratory chow diet from UAR). Human WM9 melanoma cells (2 × 10⁶ cells) responsive or resistant to PLX4032 were subcutaneously inoculated into 8-wk-old female immune-deficient athymic nude FOXN1nu mice (Harlan Laboratory). When the tumors became palpable (0.1–0.2 cm3), the mice received an intraperitoneal injection of 25 mg/kg PLX4032, 1.5 or 15 mg/kg FK866, or both drugs dissolved in a 90:9:1 (v/v/v) mixture of labrafil M1944 Cs, dimethylacetamide, and Tween 80 three times per week. Control mice were injected with labrafil alone. The growth tumor curves were determined after measuring the tumor volume using the equation V = (L × W2)/2. At the end of the experiment, the mice were euthanized by cervical dislocation, and the tumors were harvested for immunofluorescence.
Statistical analysis
The data are presented as the means ± SD and were analyzed using two-sided Student's t-test with Prism or Microsoft Excel software. The difference between both conditions was statistically significant at P < 0.05. For the metabolomics analysis, the P-values were adjusted using the Benjamini-Hochberg procedure (Anastats).
Supplementary Material
Acknowledgments
We thank Marina Boncompagni for assistance with mouse tumor staining, and Jérome Klusa and Philippe Marchetti (UMR-S 1172, Centre Hospitalier Universitaire Lille, Institut National de la Santé et de la Recherche Médicale [INSERM], University of Lille) for providing PLX4032-resistant A375. We thank the Centre Méditerranéen de Médecine Moléculaire imaging and animal facilities. We also thank Dr. T. Kitamura (University of Tokyo, Japan) and Dr. L.J. Martin (University of Moncton, Canada) for providing vectors encoding constitutively active forms of STAT5, and Dr. J.N. Garcia (University of Arizona) for providing NAMPT promoter reporter constructs. This work was funded by grants from the Institut National du Cancer (INCA) to R.B. (2013-1-MELA-04) and C.B. (INCA_10573), and La Ville de Nice and Cancéropôle Provence-Alpes-Côte d'Azur to N.N.
Author contributions: C.B. and R.B. designed, analyzed, and wrote the manuscript. B.M., S.R., and L.Y.-C. participated in the scientific discussions. M.O., M.C., K.B., R.D., and G.B. performed the experiments. N.N. conducted all bioinformatics analyses.
Footnotes
Supplemental material is available for this article.
Article published online ahead of print. Article and publication date are online at http://www.genesdev.org/cgi/doi/10.1101/gad.305854.117.
References
- Aparicio O, Geisberg JV, Sekinger E, Yang A, Moqtaderi Z, Struhl K. 2005. Chromatin immunoprecipitation for determining the association of proteins with specific genomic sequences in vivo. Curr Protoc Mol Biol 69: 21.3.1–21.3.33. [DOI] [PubMed] [Google Scholar]
- Baenke F, Chaneton B, Smith M, Van Den Broek N, Hogan K, Tang H, Viros A, Martin M, Galbraith L, Girotti MR, et al. 2016. Resistance to BRAF inhibitors induces glutamine dependency in melanoma cells. Mol Oncol 10: 73–84. [DOI] [PMC free article] [PubMed] [Google Scholar]
- Bai P, Canto C. 2012. The role of PARP-1 and PARP-2 enzymes in metabolic regulation and disease. Cell Metab 16: 290–295. [DOI] [PubMed] [Google Scholar]
- Balasubramanian P, Zhao LJ, Chinnadurai G. 2003. Nicotinamide adenine dinucleotide stimulates oligomerization, interaction with adenovirus E1A and an intrinsic dehydrogenase activity of CtBP. FEBS Lett 537: 157–160. [DOI] [PubMed] [Google Scholar]
- Baudy AR, Dogan T, Flores-Mercado JE, Hoeflich KP, Su F, van Bruggen N, Williams SP. 2012. FDG-PET is a good biomarker of both early response and acquired resistance in BRAFV600 mutant melanomas treated with vemurafenib and the MEK inhibitor GDC-0973. EJNMMI Res 2: 22. [DOI] [PMC free article] [PubMed] [Google Scholar]
- Bertolotto C, Abbe P, Hemesath TJ, Bille K, Fisher DE, Ortonne JP, Ballotti R. 1998. Microphthalmia gene product as a signal transducer in cAMP-induced differentiation of melanocytes. J Cell Biol 142: 827–835. [DOI] [PMC free article] [PubMed] [Google Scholar]
- Bertolotto C, Lesueur F, Giuliano S, Strub T, de Lichy M, Bille K, Dessen P, d'Hayer B, Mohamdi H, Remenieras A, et al. 2011. A SUMOylation-defective MITF germline mutation predisposes to melanoma and renal carcinoma. Nature 480: 94–98. [DOI] [PubMed] [Google Scholar]
- Bonet C, Giuliano S, Ohanna M, Bille K, Allegra M, Lacour JP, Bahadoran P, Rocchi S, Ballotti R, Bertolotto C. 2012. Aurora B is regulated by the mitogen-activated protein kinase/extracellular signal-regulated kinase (MAPK/ERK) signaling pathway and is a valuable potential target in melanoma cells. J Biol Chem 287: 29887–29898. [DOI] [PMC free article] [PubMed] [Google Scholar]
- Canto C, Menzies KJ, Auwerx J. 2015. NAD+ metabolism and the control of energy homeostasis: a balancing act between mitochondria and the nucleus. Cell Metab 22: 31–53. [DOI] [PMC free article] [PubMed] [Google Scholar]
- Caramel J, Papadogeorgakis E, Hill L, Browne GJ, Richard G, Wierinckx A, Saldanha G, Osborne J, Hutchinson P, Tse G, et al. 2013. A switch in the expression of embryonic EMT-inducers drives the development of malignant melanoma. Cancer Cell 24: 466–480. [DOI] [PubMed] [Google Scholar]
- Ciccarone F, Zampieri M, Caiafa P. 2017. PARP1 orchestrates epigenetic events setting up chromatin domains. Semin Cell Dev Biol 63: 123–134. [DOI] [PubMed] [Google Scholar]
- Corazao-Rozas P, Guerreschi P, Jendoubi M, Andre F, Jonneaux A, Scalbert C, Garcon G, Malet-Martino M, Balayssac S, Rocchi S, et al. 2013. Mitochondrial oxidative stress is the Achille's heel of melanoma cells resistant to Braf-mutant inhibitor. Oncotarget 4: 1986–1998. [DOI] [PMC free article] [PubMed] [Google Scholar]
- Delgado-Goni T, Miniotis MF, Wantuch S, Parkes HG, Marais R, Workman P, Leach MO, Beloueche-Babari M. 2016. The BRAF inhibitor vemurafenib activates mitochondrial metabolism and inhibits hyperpolarized pyruvate-lactate exchange in BRAF-mutant human melanoma cells. Mol Cancer Ther 15: 2987–2999. [DOI] [PMC free article] [PubMed] [Google Scholar]
- Evans AM, DeHaven CD, Barrett T, Mitchell M, Milgram E. 2009. Integrated, nontargeted ultrahigh performance liquid chromatography/electrospray ionization tandem mass spectrometry platform for the identification and relative quantification of the small-molecule complement of biological systems. Anal Chem 81: 6656–6667. [DOI] [PubMed] [Google Scholar]
- Falletta P, Sanchez-Del-Campo L, Chauhan J, Effern M, Kenyon A, Kershaw CJ, Siddaway R, Lisle R, Freter R, Daniels MJ, et al. 2017. Translation reprogramming is an evolutionarily conserved driver of phenotypic plasticity and therapeutic resistance in melanoma. Genes Dev 31: 18–33. [DOI] [PMC free article] [PubMed] [Google Scholar]
- Grolla AA, Torretta S, Gnemmi I, Amoruso A, Orsomando G, Gatti M, Caldarelli A, Lim D, Penengo L, Brunelleschi S, et al. 2015. Nicotinamide phosphoribosyltransferase (NAMPT/PBEF/visfatin) is a tumoural cytokine released from melanoma. Pigment Cell Melanoma Res 28: 718–729. [DOI] [PubMed] [Google Scholar]
- Haq R, Shoag J, Andreu-Perez P, Yokoyama S, Edelman H, Rowe GC, Frederick DT, Hurley AD, Nellore A, Kung AL, et al. 2013. Oncogenic BRAF regulates oxidative metabolism via PGC1α and MITF. Cancer Cell 23: 302–315. [DOI] [PMC free article] [PubMed] [Google Scholar]
- Hassel JC, Winnemoller D, Schartl M, Wellbrock C. 2008. STAT5 contributes to antiapoptosis in melanoma. Melanoma Res 18: 378–385. [DOI] [PubMed] [Google Scholar]
- Heinz S, Benner C, Spann N, Bertolino E, Lin YC, Laslo P, Cheng JX, Murre C, Singh H, Glass CK. 2010. Simple combinations of lineage-determining transcription factors prime cis-regulatory elements required for macrophage and B cell identities. Mol Cell 38: 576–589. [DOI] [PMC free article] [PubMed] [Google Scholar]
- Hilmi C, Larribere L, Giuliano S, Bille K, Ortonne JP, Ballotti R, Bertolotto C. 2008. IGF1 promotes resistance to apoptosis in melanoma cells through an increased expression of BCL2, BCL-XL, and survivin. J Invest Dermatol 128: 1499–1505. [DOI] [PubMed] [Google Scholar]
- Hoek KS, Eichhoff OM, Schlegel NC, Dobbeling U, Kobert N, Schaerer L, Hemmi S, Dummer R. 2008. In vivo switching of human melanoma cells between proliferative and invasive states. Cancer Res 68: 650–656. [DOI] [PubMed] [Google Scholar]
- Holen K, Saltz LB, Hollywood E, Burk K, Hanauske AR. 2008. The pharmacokinetics, toxicities, and biologic effects of FK866, a nicotinamide adenine dinucleotide biosynthesis inhibitor. Invest New Drugs 26: 45–51. [DOI] [PubMed] [Google Scholar]
- Houtkooper RH, Pirinen E, Auwerx J. 2012. Sirtuins as regulators of metabolism and healthspan. Nat Rev Mol Cell Biol 13: 225–238. [DOI] [PMC free article] [PubMed] [Google Scholar]
- Hugo W, Shi H, Sun L, Piva M, Song C, Kong X, Moriceau G, Hong A, Dahlman KB, Johnson DB, et al. 2015. Non-genomic and immune evolution of melanoma acquiring MAPKi resistance. Cell 162: 1271–1285. [DOI] [PMC free article] [PubMed] [Google Scholar]
- Jing H, Lin H. 2015. Sirtuins in epigenetic regulation. Chem Rev 115: 2350–2375. [DOI] [PMC free article] [PubMed] [Google Scholar]
- Johnson DB, Lovly CM, Sullivan RJ, Carvajal RD, Sosman JA. 2016. Melanoma driver mutations and immune therapy. Oncoimmunology 5: e1051299. [DOI] [PMC free article] [PubMed] [Google Scholar]
- Kennedy BE, Sharif T, Martell E, Dai C, Kim Y, Lee PW, Gujar SA. 2016. NAD+ salvage pathway in cancer metabolism and therapy. Pharmacol Res 114: 274–283. [DOI] [PubMed] [Google Scholar]
- Laurette P, Strub T, Koludrovic D, Keime C, Le Gras S, Seberg H, Van Otterloo E, Imrichova H, Siddaway R, Aerts S, et al. 2015. Transcription factor MITF and remodeller BRG1 define chromatin organisation at regulatory elements in melanoma cells. Elife 4: e06857. [DOI] [PMC free article] [PubMed] [Google Scholar]
- Li H, Durbin R. 2009. Fast and accurate short read alignment with Burrows-Wheeler transform. Bioinformatics 25: 1754–1760. [DOI] [PMC free article] [PubMed] [Google Scholar]
- Liang H, Fekete DM, Andrisani OM. 2011. CtBP2 downregulation during neural crest specification induces expression of Mitf and REST, resulting in melanocyte differentiation and sympathoadrenal lineage suppression. Mol Cell Biol 31: 955–970. [DOI] [PMC free article] [PubMed] [Google Scholar]
- Luke JJ, Flaherty KT, Ribas A, Long GV. 2017. Targeted agents and immunotherapies: optimizing outcomes in melanoma. Nat Rev Clin Oncol 14: 463–482. [DOI] [PubMed] [Google Scholar]
- Maki K, Ikuta K. 2008. MEK1/2 induces STAT5-mediated germline transcription of the TCRγ locus in response to IL-7R signaling. J Immunol 181: 494–502. [DOI] [PubMed] [Google Scholar]
- Maldi E, Travelli C, Caldarelli A, Agazzone N, Cintura S, Galli U, Scatolini M, Ostano P, Miglino B, Chiorino G, et al. 2013. Nicotinamide phosphoribosyltransferase (NAMPT) is over-expressed in melanoma lesions. Pigment Cell Melanoma Res 26: 144–146. [DOI] [PubMed] [Google Scholar]
- Miller MJ, Kennedy AD, Eckhart AD, Burrage LC, Wulff JE, Miller LA, Milburn MV, Ryals JA, Beaudet AL, Sun Q, et al. 2015. Untargeted metabolomic analysis for the clinical screening of inborn errors of metabolism. J Inherit Metab Dis 38: 1029–1039. [DOI] [PMC free article] [PubMed] [Google Scholar]
- Mirmohammadsadegh A, Hassan M, Bardenheuer W, Marini A, Gustrau A, Nambiar S, Tannapfel A, Bojar H, Ruzicka T, Hengge UR. 2006. STAT5 phosphorylation in malignant melanoma is important for survival and is mediated through SRC and JAK1 kinases. J Invest Dermatol 126: 2272–2280. [DOI] [PubMed] [Google Scholar]
- Muller J, Krijgsman O, Tsoi J, Robert L, Hugo W, Song C, Kong X, Possik PA, Cornelissen-Steijger PD, Foppen MH, et al. 2014. Low MITF/AXL ratio predicts early resistance to multiple targeted drugs in melanoma. Nat Commun 5: 5712. [DOI] [PMC free article] [PubMed] [Google Scholar]
- Ohanna M, Giuliano S, Bonet C, Imbert V, Hofman V, Zangari J, Bille K, Robert C, Bressac-de Paillerets B, Hofman P, et al. 2011. Senescent cells develop a PARP-1 and nuclear factor-κB-associated secretome (PNAS). Genes Dev 25: 1245–1261. [DOI] [PMC free article] [PubMed] [Google Scholar]
- Ohanna M, Bonet C, Bille K, Allegra M, Davidson I, Bahadoran P, Lacour JP, Ballotti R, Bertolotto C. 2014. SIRT1 promotes proliferation and inhibits the senescence-like phenotype in human melanoma cells. Oncotarget 5: 2085–2095. [DOI] [PMC free article] [PubMed] [Google Scholar]
- Onishi M, Nosaka T, Misawa K, Mui AL, Gorman D, McMahon M, Miyajima A, Kitamura T. 1998. Identification and characterization of a constitutively active STAT5 mutant that promotes cell proliferation. Mol Cell Biol 18: 3871–3879. [DOI] [PMC free article] [PubMed] [Google Scholar]
- Parmenter TJ, Kleinschmidt M, Kinross KM, Bond ST, Li J, Kaadige MR, Rao A, Sheppard KE, Hugo W, Pupo GM, et al. 2014. Response of BRAF-mutant melanoma to BRAF inhibition is mediated by a network of transcriptional regulators of glycolysis. Cancer Discov 4: 423–433. [DOI] [PMC free article] [PubMed] [Google Scholar]
- Ravaud A, Cerny T, Terret C, Wanders J, Bui BN, Hess D, Droz JP, Fumoleau P, Twelves C. 2005. Phase I study and pharmacokinetic of CHS-828, a guanidino-containing compound, administered orally as a single dose every 3 weeks in solid tumours: an ECSG/EORTC study. Eur J Cancer 41: 702–707. [DOI] [PubMed] [Google Scholar]
- Ray SK, Li HJ, Metzger E, Schule R, Leiter AB. 2014. CtBP and associated LSD1 are required for transcriptional activation by NeuroD1 in gastrointestinal endocrine cells. Mol Cell Biol 34: 2308–2317. [DOI] [PMC free article] [PubMed] [Google Scholar]
- Riesenberg S, Groetchen A, Siddaway R, Bald T, Reinhardt J, Smorra D, Kohlmeyer J, Renn M, Phung B, Aymans P, et al. 2015. MITF and c-Jun antagonism interconnects melanoma dedifferentiation with pro-inflammatory cytokine responsiveness and myeloid cell recruitment. Nat Commun 6: 8755. [DOI] [PMC free article] [PubMed] [Google Scholar]
- Rodriguez MI, Peralta-Leal A, O'Valle F, Rodriguez-Vargas JM, Gonzalez-Flores A, Majuelos-Melguizo J, Lopez L, Serrano S, de Herreros AG, Rodriguez-Manzaneque JC, et al. 2013. PARP-1 regulates metastatic melanoma through modulation of vimentin-induced malignant transformation. PLoS Genet 9: e1003531. [DOI] [PMC free article] [PubMed] [Google Scholar]
- Sun X, Elangovan VR, Mapes B, Camp SM, Sammani S, Saadat L, Ceco E, Ma SF, Flores C, MacDougall MS, et al. 2014. The NAMPT promoter is regulated by mechanical stress, signal transducer and activator of transcription 5, and acute respiratory distress syndrome-associated genetic variants. Am J Respir Cell Mol Biol 51: 660–667. [DOI] [PMC free article] [PubMed] [Google Scholar]
- Tateishi K, Wakimoto H, Iafrate AJ, Tanaka S, Loebel F, Lelic N, Wiederschain D, Bedel O, Deng G, Zhang B, et al. 2015. Extreme vulnerability of IDH1 mutant cancers to NAD+ depletion. Cancer Cell 28: 773–784. [DOI] [PMC free article] [PubMed] [Google Scholar]
- Tripathi P, Kurtulus S, Wojciechowski S, Sholl A, Hoebe K, Morris SC, Finkelman FD, Grimes HL, Hildeman DA. 2010. STAT5 is critical to maintain effector CD8+ T cell responses. J Immunol 185: 2116–2124. [DOI] [PMC free article] [PubMed] [Google Scholar]
- Verfaillie A, Imrichova H, Atak ZK, Dewaele M, Rambow F, Hulselmans G, Christiaens V, Svetlichnyy D, Luciani F, Van den Mooter L, et al. 2015. Decoding the regulatory landscape of melanoma reveals TEADS as regulators of the invasive cell state. Nat Commun 6: 6683. [DOI] [PMC free article] [PubMed] [Google Scholar]
- von Heideman A, Berglund A, Larsson R, Nygren P. 2010. Safety and efficacy of NAD depleting cancer drugs: results of a phase I clinical trial of CHS 828 and overview of published data. Cancer Chemother Pharmacol 65: 1165–1172. [DOI] [PubMed] [Google Scholar]
- Wachsman W, Morhenn V, Palmer T, Walls L, Hata T, Zalla J, Scheinberg R, Sofen H, Mraz S, Gross K, et al. 2011. Noninvasive genomic detection of melanoma. Br J Dermatol 164: 797–806. [DOI] [PMC free article] [PubMed] [Google Scholar]
- Warburg O. 1956. On the origin of cancer cells. Science 123: 309–314. [DOI] [PubMed] [Google Scholar]
- Ward PS, Thompson CB. 2012. Metabolic reprogramming: a cancer hallmark even Warburg did not anticipate. Cancer Cell 21: 297–308. [DOI] [PMC free article] [PubMed] [Google Scholar]
- Ye T, Krebs AR, Choukrallah MA, Keime C, Plewniak F, Davidson I, Tora L. 2011. seqMINER: an integrated ChIP-seq data interpretation platform. Nucleic Acids Res 39: e35. [DOI] [PMC free article] [PubMed] [Google Scholar]
- Zhang Y, Liu T, Meyer CA, Eeckhoute J, Johnson DS, Bernstein BE, Nusbaum C, Myers RM, Brown M, Li W, et al. 2008. Model-based analysis of ChIP-seq (MACS). Genome Biol 9: R137. [DOI] [PMC free article] [PubMed] [Google Scholar]
Associated Data
This section collects any data citations, data availability statements, or supplementary materials included in this article.