Abstract
Nonalcoholic fatty liver disease (NAFLD) is an increasingly prevalent liver pathology characterized by hepatic steatosis and commonly accompanied by systematic inflammation and metabolic disorder. Despite an accumulating number of studies, no pharmacological strategy is available to treat this condition in the clinic. In this study, we applied extensive gain‐ and loss‐of‐function approaches to identify the key immune factor leukocyte immunoglobulin‐like receptor B4 (LILRB4) as a negative regulator of NAFLD. The hepatocyte‐specific knockout of LILRB4 (LILRB4‐HKO) exacerbated high‐fat diet–induced insulin resistance, glucose metabolic imbalance, hepatic lipid accumulation, and systematic inflammation in mice, whereas LILRB4 overexpression in hepatocytes showed a completely opposite phenotype relative to that of LILRB4‐HKO mice when compared with their corresponding controls. Further investigations of molecular mechanisms demonstrated that LILRB4 recruits SHP1 to inhibit TRAF6 ubiquitination and subsequent inactivation of nuclear factor kappa B and mitogen‐activated protein kinase cascades. From a therapeutic perspective, the overexpression of LILRB4 in a genetic model of NAFLD, ob/ob mice, largely reversed the inherent hepatic steatosis, inflammation, and metabolic disorder. Conclusion: Targeting hepatic LILRB4 to improve its expression or activation represents a promising strategy for the treatment of NAFLD as well as related liver and metabolic diseases. (Hepatology 2018;67:1303‐1319)
Abbreviations
- ALT
alanine aminotransferase
- AST
aspartate aminotransferase
- cDNA
complementary DNA
- ELISA
enzyme‐linked immunosorbent assay
- GTT
glucose tolerance test
- H&E
hematoxylin and eosin
- HFD
high‐fat diet
- IL
interleukin
- HOMA‐IR
homeostasis model assessment of insulin resistance
- NTG
non‐specific transgenic
- IP
immunoprecipitation
- ITT
insulin tolerance test
- LILRB4
leukocyte immunoglobulin‐like receptor B4
- LILRB4‐HKO
hepatocyte‐specific knockout of LILRB4
- LILRB4‐HTG
hepatocyte‐specific transgenic LILRB4
- MAPK
mitogen‐activated protein kinase
- mRNA
messenger RNA
- NAFLD
nonalcoholic fatty liver disease
- NASH
nonalcoholic steatohepatitis
- NC
normal chow
- NEFA
nonesterified fatty acid
- NF‐κB
nuclear factor kappa B
- PCR
polymerase chain reaction
- TC
total cholesterol
- TG
triglyceride
- TNF‐α
tumor necrosis factor α
Nonalcoholic fatty liver disease (NAFLD), characterized by lipid accumulation in the liver, is a global epidemic with a morbidity of up to 20%‐40% worldwide.1 The occurrence of NAFLD predisposes patients to severe liver diseases, including nonalcoholic steatohepatitis (NASH), liver cirrhosis, and hepatocellular carcinoma, and it is commonly accompanied by metabolic disorders such as obesity, insulin resistance, and hyperglycemia.2, 3 However, no evidence‐based pharmacological approach is clinically available to treat NAFLD.4 Therefore, the identification of effective targets and the development of corresponding small molecules to treat this disease are urgent. As a critical pathogenesis of NAFLD, inflammation is a key driver within the process from NAFLD to NASH and other severe liver damage.5, 6 Furthermore, inflammation is a link between hepatic lipid accumulation and insulin resistance, two other common features of NAFLD, and promotes a vicious cycle between these pathologies.7 Thus, determining the inflammatory regulators that control NAFLD progression might be a promising strategy to treat this disease.
Leukocyte immunoglobulin‐like receptor B4 (LILRB4) is an immunoreceptor primarily expressed on the membrane of immune cells, where it transduces a negative signal upon an immune response.8 Since the discovery of LILRB4, most studies have focused on its regulation in the immune system and, in particular, its inhibitory effect on the activation of mast cells, neutrophils, and macrophages in vitro.9 The anti‐inflammatory role that LILRB4 plays in vivo was established in Lilrb4 knockout mice, which show high sensitivity to proinflammatory/immune stimuli, such as immunoglobulin E, histamine, serotonin, cysteinyl leukotrienes, or prostaglandin D2.10 Our data demonstrated that LILRB4 expression increased dramatically in hepatocytes during NAFLD progression. Given the critical role that inflammation plays in NAFLD progression, it is reasonable to hypothesize that LILRB4 plays a functional role in NAFLD development; however, this role remains unclear.
Here, using hepatocyte‐specific Lilrb4 knockout (LILRB4‐HKO) and transgenic (LILRB4‐HTG) mice, we observed that hepatocellular LILRB4 significantly suppresses high‐fat diet (HFD)‐induced insulin resistance, glucose metabolic disorder, hepatic lipid accumulation, and inflammatory responses. In‐depth investigations demonstrated that LILRB4 recruits SHP1 and SHP1 directly interacts with TRAF6 to block the activation of the downstream nuclear factor kappa B (NF‐κB) and mitogen‐activated protein kinase (MAPK) signaling pathways, leading to the attenuation of NAFLD development and its metabolic complications.
Materials and Methods
ANIMALS AND TREATMENTS
LILRB4‐HKO mice were generated using the CRISPR/Cas9 system.11 Mice with a conditional Lilrb4 knockout allele were obtained by injecting zygotes with Cas9, sgRNAs and a donor vector containing exon1 and exon2 flanked by 2 loxP sites and 2 homology arms into pseudopregnant female mice. Two founders (nos. 18 and 35) of 85 neonate mice were identified as containing floxed exons on the same allele. To further confirm that the floxed allele was functional, we used genomic DNA for in vitro Cre/loxP‐mediated recombination. Primer pairs Lilrb4‐P1 and Lilrb4‐P2, Lilrb4‐P3, and Lilrb4‐P4 were used for detecting the deletion products and the circle product, respectively (http://onlinelibrary.wiley.com/doi/10.1002/hep.29633/suppinfo). All the products were confirmed via sequencing. The no. 18 mouse was crossed with C57BL/6J female mice to generate the Lilrb4 flox/flox (LILRB4‐Flox) mice, which were further mated with albumin‐creatinine mice to obtain LILRB4‐HKO mice.
LILRB4‐HTG mice were generated by crossing the albumin‐creatinine mice with conditional Lilrb4 transgenic mice that were obtained by microinjecting the CAG‐loxP‐CAT‐loxP‐Lilrb4 cassette into fertilized C57BL/6J embryos of female mice.
The ob/ob mice were obtained from the Model Animal Research Center of Nanjing University (Nanjing, China). To overexpress or knockdown protein in mice, Adenovirus (5 × 10⁹ pfu) was injected into mice. For overexpression, AdGFP was used as controls, whereas AdshRNA was used as a control for short hairpin RNA of each genes. Mice were maintained in a standard environment with a 12‐hour light/dark cycle at 22 °C ± 3 °C, and the humidity was kept at 50%‐60%. All animal protocols were approved by the Animal Care and Use Committee of the Third Xiangya Hospital of Central South University.
ESTABLISHMENT OF MOUSE NAFLD MODEL
The NAFLD model was established in 8‐ to 10‐week‐old male mice (weight, 25‐27 g) fed an HFD (protein, 18.1%; fat, 61.6%; carbohydrates, 20.3% [D12492, Research Diets, New Brunswick, NJ]) for 12 continuous weeks. Mice fed with normal chow (NC; protein, 18.3%; fat, 10.2%; carbohydrates, 71.5% [D12450B, Research Diets]) were served as controls.
GLUCOSE TOLERANCE TEST AND INSULIN TOLERANCE TEST
Glucose tolerance tests (GTTs) and insulin tolerance tests (ITTs) were performed in mice at 10 and 11 weeks of the HFD or NC feeding, respectively. Briefly, mice fasted overnight and then were intraperitoneally injected with glucose at a dose of 1 g · kg−1 for the GTT assay or with insulin at a dose of 0.75 U · kg−1. Blood glucose levels were examined 15, 30, 60, and 120 min after injection.
SERUM OR BLOOD METABOLIC AND INFLAMMATORY PARAMETER ANALYSIS
The fasting blood glucose levels of the mice were examined using a glucometer (One Touch Ultra Easy, Life Scan, Wayne, PA) after 6 hours of fasting, and the fasting serum insulin levels were detected by way of enzyme‐linked immunosorbent assay (ELISA) (Millipore, Billerica, MA) according to the manufacturer's instructions. The triglyceride (TG), total cholesterol (TC), and nonesterified fatty acid (NEFA) levels in serum were examined using commercial kits (290‐63701 for TG, 294‐65801 for TC, 294‐63601 for NEFA; Wako, Tokyo, Japan). The concentrations of serum cytokines and chemokines were measured by way of ELISA (for interleukin [IL]‐1β: ELM‐IL1beta‐001, RayBio (Guangzhou, China); for IL‐6: KMC0061, Invitrogen (Carlsbad, CA, USA); for tumor necrosis factor α [TNF‐α]: ADI‐900‐047, Peprotech (Rocky Hill, NJ, USA); for Mcp‐1: MJE00, R&D Systems (Minneapolis, MN, USA); for IL‐10: M1000B, R&D Systems) according to the manufacturer's instructions.
LIVER LIPID AND ENZYME ACTIVITY ASSAYS
The TG, TC, and NEFA contents in the livers of mice were detected using commercial kits as described above. The alanine aminotransferase (ALT) and aspartate aminotransferase (AST) levels in the serum were examined using an ADVIA 2400 Chemistry System analyzer (Siemens, Tarrytown, NY) to evaluate liver function.
CELL CULTURE
HEK293T, L02 and primary‐cultured hepatocytes were grown in Dulbecco's modified Eagle's medium (Gibco/Thermo) containing 10% fetal bovine serum, penicillin (100 U/mL), and streptomycin (100 μg/mL) in a 5% CO2/water‐saturated incubator at 37 °C.
PRIMARY HEPATOCYTE ISOLATION, CULTURE, AND TREATMENT
Primary hepatocytes were isolated from 6‐ to 8‐week‐old male mice as described previously.12 Briefly, mice were anesthetized and subjected to laparotomies along the midline to expose the portal vein. A liver perfusion medium (17701‐038, Life Technologies, Carlsbad, CA, USA) and liver digest medium (17703‐034, Life Technologies) were successively perfused through the portal vein, and the liver was then excised, minced, filtered, and centrifuged to obtain primary hepatocytes. Percoll solution (17‐0891‐01, GE Healthcare Life Sciences, Buckinghamshire, UK) was applied at a concentration of 50% to purify hepatocytes. Cell viability was assayed using the Trypan Blue exclusion method; the viability of the obtained hepatocytes was more than 95%.
To establish the in vitro NASH model, primary hepatocytes were treated using palmitate (0.4 mM) for 24 hours. Cells were infected with AdLilrb4 or AdshLilrb4 at 24 hours before the palmitate challenge to investigate the role of LILRB4 in NASH‐related pathologies of hepatocytes.
HISTOLOGICAL AND IMMUNOFLUORESCENCE ANALYSES
To visualize lipid accumulation in the liver, hematoxylin and eosin (H&E) and Oil Red O staining were performed as reported previously,12 and periodic acid‐Schiff staining was applied to detect glycogen levels in liver sections. Images of the histological staining were observed and recorded using a light microscope (Olympus, Tokyo, Japan). The infiltration of inflammatory cells into the liver section was tested by immunofluorescence staining applying primary antibodies of anti‐CD11b (ab75476, Abcam, Cambridge Science Park, UK), anti‐F4/80 (MCA497, AbD Serotec, Kidlington, UK), anti‐Anti‐Myeloperoxidase (ab45977, Abcam), anti‐HNF4 (ab41898, Abcam), and anti‐LILRB4 (S3726, Proteintech, Rosemont, IL, USA). After incubating with primary antibody overnight at 4 °C, liver sections were incubated with secondary antibody (Thermo Fisher Scientific, Waltham, MA) for 1 hour; liver slices were washed and then mounted by DAPI‐Fluoromount‐G (Thermo Fisher Scientific). Immunofluorescence images were captured and recorded by a fluorescence microscope (Olympus) with DP2‐BSW software (version 2.2).
QUANTITATIVE REAL‐TIME POLYMERASE CHAIN REACTION AND WESTERN BLOT ANALYSES
Real‐time polymerase chain reaction (PCR) and western blot analyses were conducted as described previously, with minor modifications.13 For the real‐time PCR assay, total messenger RNA (mRNA) was extracted from the livers using TRIzol reagent (15596‐026, Invitrogen) and then reverse‐transcribed into complementary DNA (cDNA) using a Transcriptor First Strand cDNA Synthesis Kit (04896866001, Roche, Basel, Switzerland). PCR amplification was performed with SYBR Green PCR Master Mix (04887352001, Roche), and the mRNA expression of the genes of interest was normalized to that of β‐actin. The primer pairs used in this study are listed in http://onlinelibrary.wiley.com/doi/10.1002/hep.29633/suppinfo.
For western blot analysis, total protein samples were isolated from livers and hepatocytes using RIPA lysis buffer (880 µL RIPA, 20 µL Complete [Roche], 100 µL PhosStop [Roche]). Protein concentrations were examined using a Pierce BCA Protein Assay Kit (23225, Thermo Fisher Scientific). The obtained protein (50 μg) was separated on a 10% sodium dodecyl sulfate–polyacrylamide gel electrophoresis gel, transferred to a polyvinylidene fluoride membrane, followed by blocking with 5% milk, incubation with primary antibody overnight at 4 °C and a secondary antibody at room temperature for 1 hour. The signal was detected by applying a ChemiDoc XRS + System with Image Lab Software. β‐actin served as a loading control. The antibodies used in the experiments are listed in the http://onlinelibrary.wiley.com/doi/10.1002/hep.29633/suppinfo.
PLASMID CONSTRUCTS
The full‐length human LILRB4 cDNA was cloned into pcDNA3.1 vector which has a flag‐tag inserted behind signal peptide (1‐21 amino acid). LILRB4 mutation: 3Y‐F, which turned the tyrosine in each 3 ITIM (immunoreceptor tyrosine‐based inhibition motif) into phenylalanine, was obtained by three rounds of point mutant PCR of which LILRB4‐pcDNA3.1 was the DNA template. SHP1 was cloned into pcDNA 3.1 vector and combined with a HA‐tag in C‐terminal. TRAF6 cDNA was inserted into psi vector and tagged with HA, Flag and Myc label respectively. Ubiquitin coding sequence was inserted into pcDNA5 vector. SHP1 short hairpin RNA was designed and cloned into pLKO.1 plasmid.
IMMUNOPRECIPITATION ASSAY
To examine the interaction of LILRB4 with regard to the factors of interest, the corresponding plasmids were transfected into L02 cells for 24 hours. Cells were then collected and lysed in an ice‐cold immunoprecipitation (IP) buffer containing 150 mmol/L NaCl, 50 mmol/L Tris‐HCl, 5 mmol/L ethylene diamine tetraacetic acid, 5% glycerol, 1% Triton X‐100, and a protease inhibitor cocktail (Roche). The obtained lysates were incubated with beads conjugating the corresponding antibody (Anti‐FLAG M2 Magnetic Beads, M8823, Sigma, Santa Clara, CA, USA; Pierce Anti‐HA Magnetic Beads, 88836, Thermo Fisher Scientific) at 4 °C for 3 hours. The interactions between the proteins of interest were measured by way of immunoblotting with the indicated primary and secondary antibodies.
IN VIVO UBIQUITINATION ASSAY
The regulation by SHP1 on TRAF6 ubiquitination was performed as previously described.14 Briefly, after transfection with the indicated plasmids for 24 h, cells were lysed in an SDS lysis buffer followed by heating for 5 min. The supernatants were collected and diluted 10‐fold with the lysis buffer. The ubiquitination of TRAF6 was detected via an IP assay and a western blot analysis.
STATISTICAL ANALYSIS
All data were analyzed using SPSS (version 19.0) and are presented as the mean ± standard error. To examine the significant differences between groups, the data were compared using a Student t test, whereas data comparisons across more than two groups were performed using a one‐way analysis of variance followed by Bonferroni's post hoc tests (assuming equal variances) or Tamhane's T2 post hoc tests (assuming unequal variances). P < 0.05 was considered statistically significant.
Results
LILRB4 DEFICIENCY IN HEPATOCYTES EXACERBATES INSULIN RESISTANCE
The expression of LILRB4 in hepatic steatosis was tested in fatty livers. LILRB4 was significantly up‐regulated in the livers from patients with steatosis and steatohepatitis compared with nonsteatotic donors. Hepatic steatosis mouse model was established by feeding with an HFD for 12 weeks. LILRB4 expression was examined in hepatic tissue from mice fed on HFD or normal chow. Consistent with our results in human samples, the hepatic LILRB4 in HFD‐fed mice was significantly increased compared with NC‐fed group. (Fig. 1A,B and http://onlinelibrary.wiley.com/doi/10.1002/hep.29633/suppinfo). Based on these results, we hypothesized that LILRB4 is involved in the development of this disease. To prove our hypothesis, we first established a LILRB4‐HKO mouse strain (Fig. 1C). A continuous HFD for 12 weeks led to a significant increase in body weight, fasting blood glucose, and serum insulin levels and a calculated homeostasis model assessment of insulin resistance (HOMA‐IR) value, which were further enhanced by LILRB4 deficiency in the liver (Fig. 1D‐G). GTTs and ITTs revealed impaired insulin sensitivity in LILRB4 knockout mice (Fig. 1H,I). Consistently, the activity of the insulin signaling that was reflected by the expression levels of total and phosphorylated IRSTy605, AKTSer473, and GSK3β were significantly blocked in the livers of LILRB4‐HKO mice compared with those of LILRB4‐Flox controls after 12 weeks of HFD feeding (Fig. 1J). In line with the exacerbated insulin resistance, LILRB4 deletion induced a marked decrease in the glycogen contents in liver sections (Fig. 1K) but an increase in mRNA and protein expression of gluconeogenesis‐related factors PEPCK and G6Pase (Fig. 1L,M). These data collectively indicate that deficiency of LILRB4 in the liver aggravated HFD‐induced obesity and insulin resistance.
Figure 1.
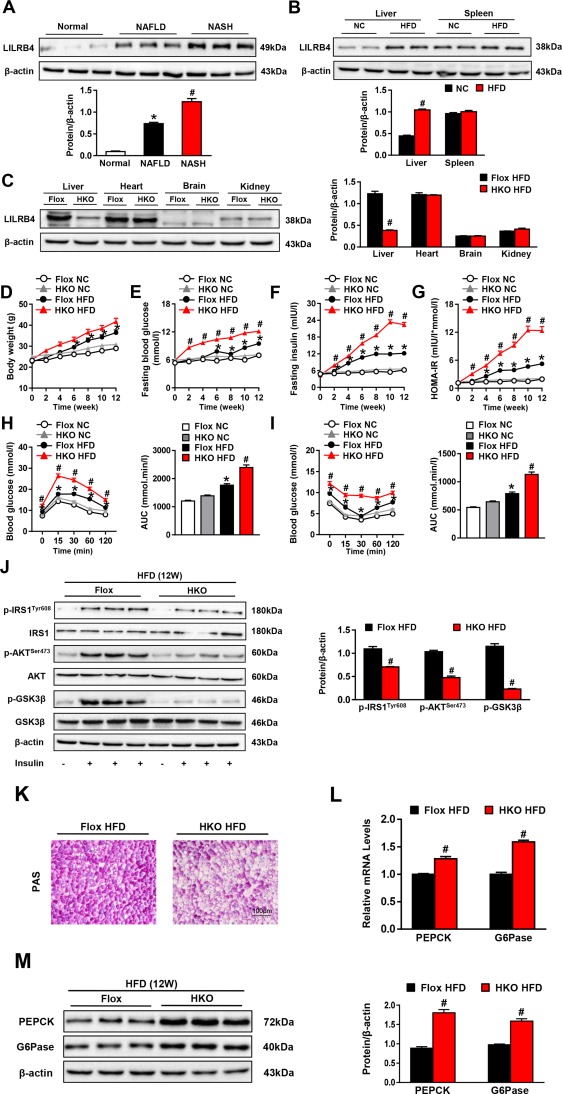
Hepatocyte LILRB4 deficiency exacerbates HFD‐induced insulin resistance and glucose metabolic disorder. (A) Expression of LILRB4 in livers of normal and NAFLD patients (nonsteatotic donors, n = 5; simple steatosis patients, n = 9; steatohepatitis subjects, n = 8). *&#P < 0.05 versus nonsteatotic controls. (B) Liver and spleen expression of LILRB4 in NC and HFD mice (n = 4 in each group). (C) Expression of LILRB4 in the liver, heart, brain, and kidney of LILRB4‐Flox and LILRB4‐HKO mice (n = 4 mice in each group). (D‐G) Body weight (D), fasting blood glucose (E), fasting insulin (F), and HOMA‐IR (G) values of LILRB4‐HKO mice and their littermate controls at 0‐12 weeks after NC or HFD feeding. Values were examined every 2 weeks (n = 18 and 23 mice in each group). (H, I) Blood glucose levels of LILRB4‐Flox and LILRB4‐HKO mice subjected to the glucose tolerance test (GTT; H) and insulin tolerance test (ITT; I) (n = 18 and 23 mice for each group). (J) Protein expression of total and phosphorylated IRS1, AKT, and GSK3β in livers of mice with LILRB4 deficiency or their Flox controls after 12 weeks of HFD feeding. β‐actin served as a loading control (n = 4 mice in each group). (K) Representative images of periodic acid‐Schiff–stained liver sections of LILRB4‐Flox and LILRB4‐HKO mice after 12 weeks of HFD treatment (n = 4 mice for each group). Scale bar: 100 μm. (L, M) mRNA (L; n = 4 for each group) and protein (M; n = 6 mice for each group) expression levels of PEPCK and G6Pase in the livers of mice in the Flox and HKO groups. The expression levels of tested genes were normalized to that of β‐actin. *P < 0.05 versus Flox/NC; # P < 0.05 versus Flox/HFD.
HEPATOCYTE LILRB4 DEFICIENCY PROMOTES HEPATIC STEATOSIS
We next tested the functional role that LILRB4 plays in hepatic steatosis, the most prominent characteristic of NAFLD development. We found that the HFD‐induced increase in liver weight and the ratio of liver weight to body weight were more significant in LILRB4‐HKO mice than their LILRB4‐Flox littermates (Fig. 2A‐C). The H&E and Oil Red O staining analyses revealed an exacerbation in hepatic lipid accumulation caused by LILRB4 deficiency (Fig. 2D), which was further confirmed by the higher TG, TC, and NEFA contents in the livers of LILRB4‐HKO mice compared with those in the Flox controls (Fig. 2E). Along with hepatic steatosis, an obvious liver dysfunction was elicited by HFD feeding as evidenced by the increased ALT, AST, and ALP levels in the serum compared with those in the NC‐fed mice; this increase was enlarged by hepatocyte LILRB4 ablation (Fig. 2F). Studies of fatty acid metabolism‐related genes showed that LILRB4 deficiency significantly increases cholesterol synthesis, fatty acid uptake, and fatty acid synthesis while blocking cholesterol efflux and fatty acid oxidation (Fig. 2G). Together, these observations demonstrate that hepatocyte LILRB4 deficiency promotes diet‐induced hepatic steatosis.
Figure 2.
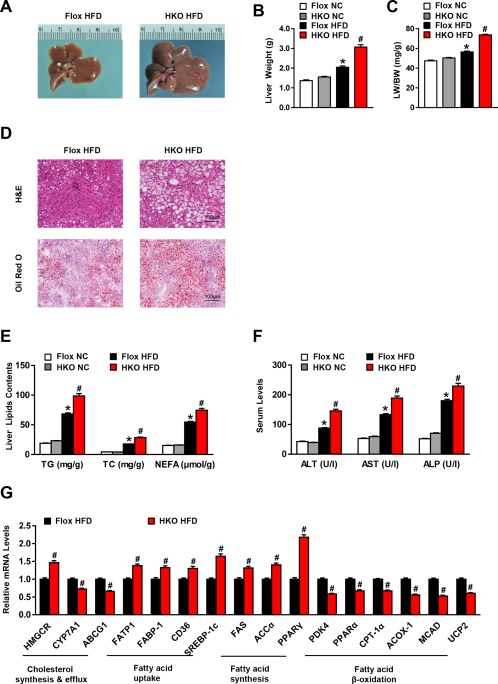
LILRB4 ablation in hepatocytes aggravates hepatic steatosis. (A) Representative images of the livers from LILRB4‐Flox and LILRB4‐HKO mice after 12 weeks of HFD treatment (n = 4 mice in each group). (B, C) Liver weight (B) and ratio of liver weight to body weight (LW/BW) (C) of LILRB4‐HKO mice and their littermate Flox controls after 12 weeks of NC or HFD feeding (n = 18 and 23 for each group). (D) Representative H&E (upper) and Oil Red O (bottom) staining of liver sections of LILRB4‐Flox and LILRB4‐HKO mice subjected to HFD feeding for 12 weeks (n = 4 mice for each group). Scale bar: 100 μm. (E) Content of TG, TC, and NEFA in the livers of LILRB4‐Flox and LILRB4‐HKO mice after 12 weeks of NC or HFD treatment (n = 18 and 23 mice in each group). (F) Levels of ALT, AST, and ALP in the sera of HFD‐ or NC‐fed mice with LILRB4 deficiency and control mice (n = 18 and 23 mice in each group). (G) mRNA expression levels of lipid metabolism‐related genes in the livers of LILRB4‐Flox and LILRB4‐HKO mice after 12 weeks of HFD feeding (n = 4 mice for each group). The expression of tested genes was normalized to that of β‐actin. *P < 0.05 versus Flox/NC; # P < 0.05 versus Flox/HFD.
HEPATOCYTE LILRB4 INHIBITS HFD‐INDUCED INSULIN RESISTANCE AND HEPATIC STEATOSIS
To further evaluate the LILRB4 regulation of NAFLD progression, we generated LILRB4‐HTG mice (http://onlinelibrary.wiley.com/doi/10.1002/hep.29633/suppinfo) and fed them an HFD for 12 weeks. In contrast to the exacerbated effect of LILRB4 deficiency on insulin resistance, LILRB4 overexpression in hepatocytes inhibited the HFD‐induced increases in fasting blood glucose, fasting insulin level, and the corresponding HOMA‐IR value, without a significant influence on body weight (Fig. 3A‐D). The glucose levels of LILRB4‐HTG mice were also lower than those of non‐specific transgenic (NTG) controls in the GTT and AUC assays (Fig. 3E‐F). We also found that the glycogen content was increased by LILRB4 up‐regulation, whereas the expression of PEPCK and G6Pase was lowered in the livers of LILRB4‐HTG mice compared with that of the NTG group (http://onlinelibrary.wiley.com/doi/10.1002/hep.29633/suppinfo). Consistently, the activation of insulin signaling was significantly elevated by LILRB4 overexpression compared with that of the littermate NTG controls (Fig. 3G). Regarding liver pathologies, LILRB4 up‐regulation markedly inhibited liver weight, ratio of liver weight to body weight, and lipid accumulation; decreased serum levels of ALT, AST and ALP; and maintained homeostasis of fatty acid metabolic profile in LILRB4‐HTG mice compared with NTG controls (Fig. 3H‐K and http://onlinelibrary.wiley.com/doi/10.1002/hep.29633/suppinfo). Collectively, the data from the LILRB4‐HTG and LILRB4‐HKO mice demonstrated a potent inhibitory effect of hepatocyte LILRB4 on HFD‐induced insulin resistance and hepatic steatosis.
Figure 3.
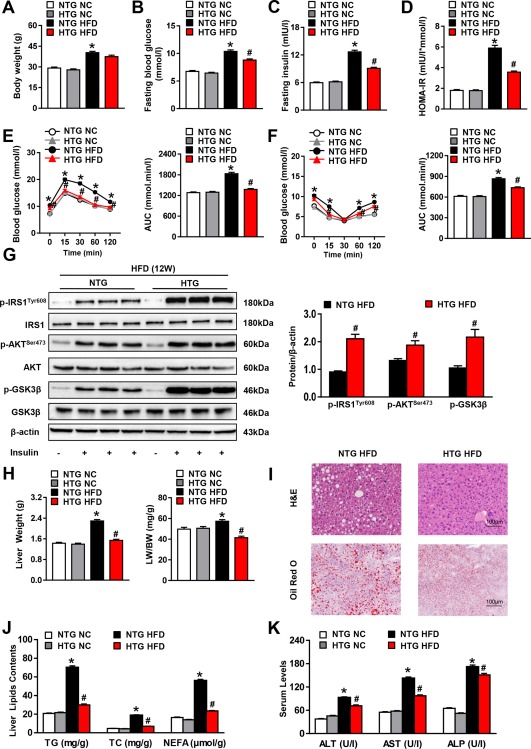
Hepatocyte LILRB4 overexpression ameliorates insulin resistance and hepatic steatosis induced by HFD. (A‐D) Body weight (A), fasting blood glucose (B), fasting serum insulin (C) and HOMA‐IR (D) values of mice with the hepatocyte‐specific overexpression of LILRB4 and their NTG controls after HFD or NC treatment for 12 weeks (n = 14 and 20 for each group). (E, F) Blood glucose levels of NTG and LILRB4‐HTG mice according to GTT (E) and ITT (F) at 11 weeks after HFD treatment (n = 14 and 20 mice in each group for each test). (G) The protein expression of total and phosphorylated IRS1, AKT, and GSK3β in the livers of NTG and LILRB4‐HTG mice at 12 weeks after HFD treatment (n = 4 mice for each group). (H) Liver weight and ratio of liver weight to body weight (LW/BW) of mice in the NTG and LILRB4‐HTG groups after 12 weeks of NC or HFD feeding (n = 14 and 20 mice in each group). (I) Representative images of H&E and Oil Red O–stained liver sections of NTG and LILRB4‐HTG mice after HFD feeding for 12 weeks (n = 4 mice for each group). Scale bar: 100 μm. (J) Hepatic contents of TG, TC, and NEFA of mice in the indicated groups (n = 14 and 20 mice in each group). (K) Serum levels of ALT, AST, and ALP of mice in the NTG and LILRB4‐HTG groups after NC or HFD treatment for 12 weeks (n = 14 and 20 mice for each group). *P < 0.05 versus NTG/NC; # P < 0.05 versus NTG/HFD.
HEPATOCYTE LILRB4 AMELIORATES HFD‐INDUCED INFLAMMATION
Inflammation has been recognized as a pivotal driver of NAFLD development, and it possesses a critical capacity to promote insulin resistance and hepatic lipid accumulation. Here, we found that LILRB4 deficiency in hepatocytes significantly increased the expression levels of proinflammatory mediators (i.e., IL‐1β, IL‐6, TNF‐αα and MCP‐1) but decreased the anti‐inflammatory factor IL‐10 in both the serum and the liver; the opposite phenotype was observed in LILRB4‐HTG mice compared with their corresponding controls (Fig. 4A‐D). Correspondingly, the ratio of infiltrated CD11b, F4/80 and MPO‐positive cells into the liver sections were greatly exacerbated by LILRB4 ablation in hepatocytes, whereas LILRB4 overexpression inhibited inflammatory cell recruitment in the liver compared to their control mice (Fig. 4E and http://onlinelibrary.wiley.com/doi/10.1002/hep.29633/suppinfo). In line with these results, the activity of NF‐κB signaling was greatly affected by hepatocyte LILRB4. After being fed an HFD for 12 weeks, phosphorylated IKKβ and IκBα in liver tissue in LILRB4‐HKO mice were significantly higher than in control groups. In addition, LILRB4‐HTG mice presented an opposite phenotype (Fig. 4F). The inhibitory effect of LILRB4 on NF‐κB signaling activity was further confirmed in palmitate‐stimulated primary hepatocytes (Fig. 4G). These data indicate that LILRB4 blocks inflammatory responses during HFD‐induced NAFLD development.
Figure 4.
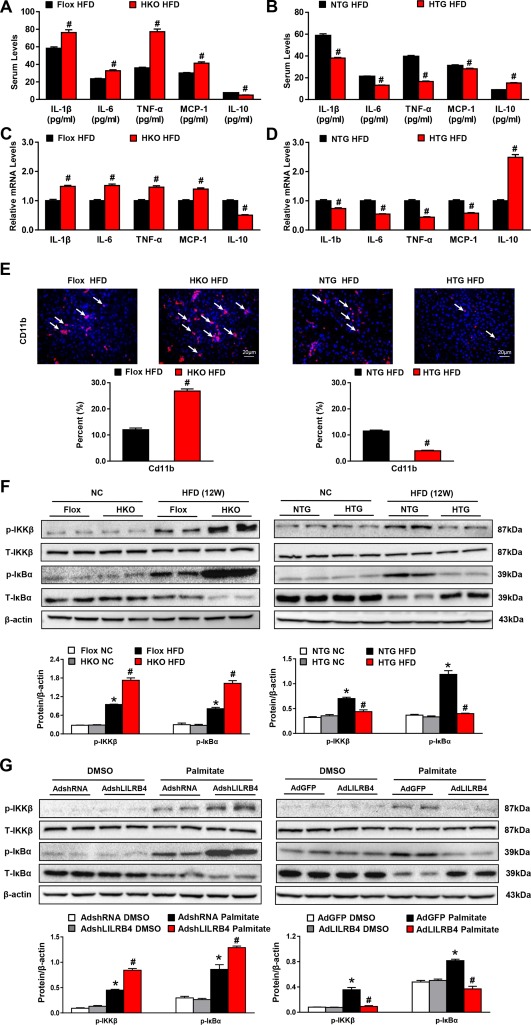
Hepatocyte LILRB4 attenuates inflammation during NAFLD development. (A, B) Concentrations of IL‐1β, IL‐6, TNF‐α, MCP‐1, and IL‐10 in the serum of mice with hepatocyte LILRB4 deficiency (A), LILRB4 overexpression (B), and their corresponding control mice after HFD treatment for 12 weeks (n = 14 and 21 mice for each group). (C, D) mRNA expression of the inflammatory cytokines and chemokines in livers of mice in the indicated groups after 12 weeks of HFD feeding (n = 4 mice for each group). (E) Representative images for CD11b‐positive cells in liver sections of mice in LILRB4‐Flox, LILRB4‐HKO, NTG, and LILRB4‐HTG groups after 12 weeks of HFD treatment (n = 4 for each group). Scale bar: 20 μm. (F) Protein expressions of total and phosphorylated IKKβ and IκBα in livers of LILRB4‐Flox, LILRB4‐HKO, NTG, and LILRB4‐HTG mice after 12 weeks of NC or HFD feeding (n = 4 for each group). Protein levels were normalized to that of β‐actin. (G) Western blots showing expression of p‐IKKβ, IKKβ, p‐IκBα and IκBα in primary hepatocytes transfected with AdshRNA, AdshLILRB4, AdGFP, and AdLILRB4 and challenged via palmitate for 12 hours (n = 3 independent experiments). Protein levels were normalized to that of β‐actin. *P < 0.05 versus Flox/NC or NTG/NC; # P < 0.05 versus Flox/HFD or NTG/HFD.
SHP1 MEDIATES THE INHIBITORY EFFECT OF LILRB4 ON TRAF6 UBIQUITINATION
The robust effect of LILRB4 to attenuate NAFLD development encouraged us to further investigate the underlying mechanisms of LILRB4 function. Consistent with previous reports,15 we observed a direct interaction between LILRB4 and SHP1, a tyrosine phosphatase that negatively regulates inflammatory responses (Fig. 5A). When the three tyrosine (Y) sites in the ITIM domain of LILRB4 were mutated to phenylalanine (F), the interaction between LILRB4 and SHP1 was abolished (Fig. 5B), suggesting that the phosphorylation of LILRB4 is required for its binding to SHP1. To further examine the downstream factors of LILRB4‐SHP1, we screened potential candidates at the levels of the receptors, adaptors, and kinases that are closely involved in NAFLD progression by regulating inflammation and insulin resistance. Among these tested factors, only TRAF6 strongly bound to SHP1 (Fig. 5C); this finding was further validated in an IP analysis (Fig. 5D). In response to palmitate challenge, the binding of TRAF6 to SHP1 significantly increased; the SHP1–TRAF6 interaction was enhanced by the LILRB4 dependent on its phosphorylation (Fig. 5E).
Figure 5.
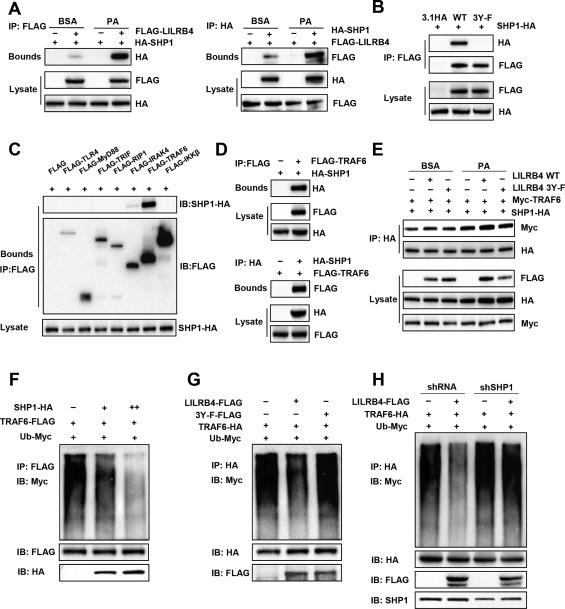
LILRB4 interacts with SHP1 and blocks TRAF6 ubiquitination. (A) Interaction between LILRB4 and SHP1 examined using co‐IP assay followed by western blot analysis in L02 cells transfected with FLAG‐LILRB4 and HA‐SHP1. (B) Interaction of SHP1 with LILRB4 and its mutant with its tyrosine phosphorylation sites mutated to alanine (3Y‐F). (C) Co‐IP assay showing the interaction of SHP1 with key upstream factors of IκBα in L02 cells transfected with SHP1 and indicated plasmids. (D) Binding of SHP1 to TRAF6 examined using co‐IP followed by western blotting. (E) Effect of LILRB4 and its 3Y‐F mutant on the SHP1‐TRAF6 interaction in the presence or absence of palmitate stimulation. (F) Effect of SHP1 on TRAF6 ubiquitination examined via co‐IP in L02 cells transfected with Ub‐Myc, TRAF6‐FLAG and SHP1‐HA at different dosages. (G) Effect of LILRB4 and its 3Y‐F mutant on TRAF6 ubiquitination examined in L02 cells transfected with indicated plasmids. (H) TRAF6 ubiquitination level in the presence or absence of LILRB4 in L02 cells transfected with AdshRNA or AdshSHP1 (n = 3 independent experiments for each panel).
Because ubiquitination of TRAF6 is required for its activation, we next determined whether LILRB4 and SHP1 influence TRAF6 ubiquitination. The results showed that SHP1 overexpression greatly diminished the ubiquitination level of TRAF6 in a dose‐dependent manner in L02 cells (Fig. 5F). LILRB4 also markedly inhibited the ubiquitination of TRAF6; however, this effect was only exerted when the phosphorylation sites of LILRB4 were reserved in the presence of SHP1 (Fig. 5G,H).
Consistent with the reduced ubiquitination of TRAF6 caused by LILRB4, the phosphorylated expression of TRAF6 downstream factors including TAK1, JNK1/2, IKKβ, and IκBα were significantly decreased by LILRB4 overexpression (Fig. 6A). By down‐regulating SHP1 in LILRB4‐overexpressed hepatocytes, we found that SHP1 knockdown reversed the inhibitory effect of LILRB4 on the activation of TRAF6 downstream signaling in palmitate‐challenged cells (Fig. 6A). To illustrate the upstream and downstream relations between LILRB4 and SHP1/TRAF6, adenovirus containing short hairpin sequence of SHP1 or short hairpin RNA control was injected into NTG and HTG mice, and AdshTRAF6 was injected into Flox and HKO mice. After feeding with an HFD for 12 weeks, the downstream signal pathways of TRAF6 were examined using western blot analysis. The results showed that LILRB4 deficiency cannot promote an NF‐κB and MAPK signal while lacking Shp1. Meanwhile, when TRAF6 was knocked down, LILRB4 overexpression did not exhibit an inhibitory role in NF‐κB and MAPK pathway regulation. These results suggest that LILRB4 exerts its function in an SHP1‐ and TRAF6‐dependent manner (Fig. 6B). Oil Red O staining revealed that reducing SHP1 disrupted the amelioration of lipid accumulation by way of LILRB4 in hepatocytes (Fig. 6C). Furthermore, quantitative PCR assay demonstrated that LILRB4 exerted its effect on the fatty acid metabolic homeostasis and inflammation dependent on SHP1 (Fig. 6D,E). Thus, LILRB4 interacts directly with SHP1 to inhibit TRAF6 ubiquitination and activation in which the phosphorylation of LILBR4 is required.
Figure 6.
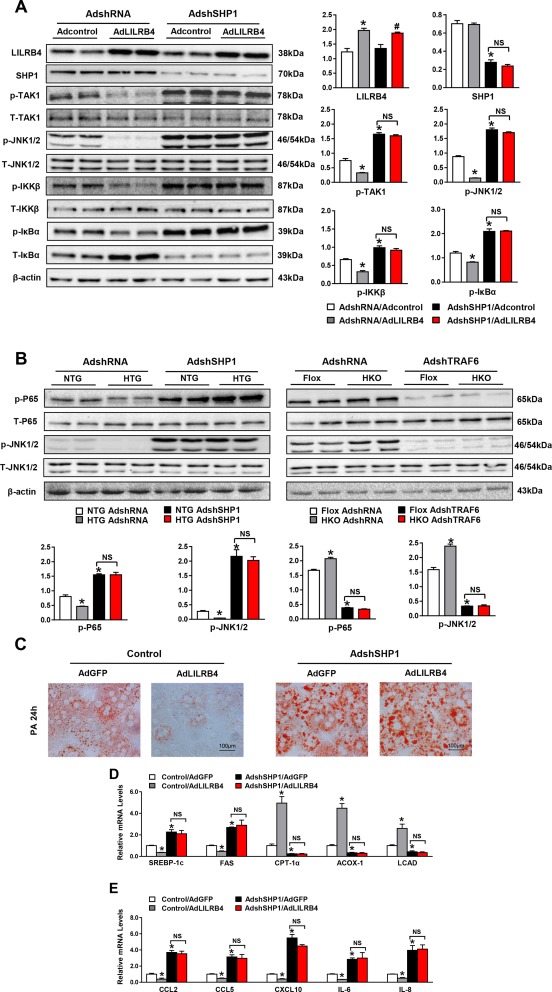
LILRB4 ameliorates the hepatocyte lipid accumulation dependent on SHP1. (A) Protein expression of phosphorylated and total TAK1, JNK1/2, IKKβ and IκBα in hepatocyte cell lines transfected with LILRB4 or control plasmid with SHP1 down‐regulation upon palmitate treatment (6 hours). (B) Phosphorylation of P65 and JNK were detected in NTG, HTG, Flox, and HKO mice liver tissue by western blotting. (C) Representative images of Oil Red O staining on primary hepatocytes infected with indicated adenovirus after palmitate treatment for 12 hours. Scale bar: 100 μm. (D, E) mRNA expression of genes related to the lipid metabolism (D) and inflammation (E) of primary hepatocytes in the indicated groups (n = 3 independent experiments for each panel). *P < 0.05 versus HA/control; # P < 0.05 versus HA/shSHP1.
LILRB4 ATTENUATES NAFLD DEVELOPMENT IN ob/ob MICE
Based on the potent inhibitory effect of LILRB4 on NAFLD development, we explored the therapeutic potential of LILRB4 on this disease within ob/ob mice, a genetically induced NAFLD model. LILRB4 was overexpressed in the livers of ob/ob mice by injecting AdLILRB4, whereas mice injected with AdGFP served as controls (Fig. 7A). After 4 weeks of AdLILRB4 injection, the levels of fasting blood glucose, fasting insulin, and HOMA‐IR were significantly decreased compared with the levels in the AdGFP control group, whereas LILRB4 did not significantly change body weight (Fig. 7B‐E). Furthermore, LILRB4 improved the insulin sensitivity and glucose metabolic homeostasis of ob/ob mice (Fig. 7F,G). Regarding liver pathologies, hepatic steatosis and inflammation were both greatly inhibited by LILRB4 overexpression (Fig. 7H‐L). The relief of hepatic steatosis and related metabolic disorders by way of AdLILRB4 suggests the potential application of LILRB4 for NAFLD treatment.
Figure 7.
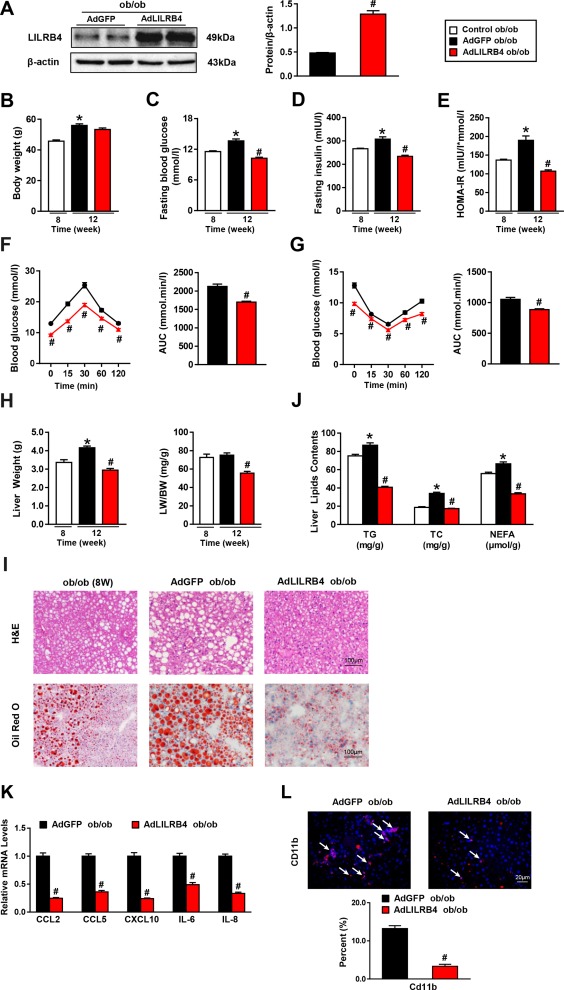
LILRB4 attenuates NAFLD in ob/ob mice. (A) Expression of LILRB4 in livers of AdGFP or AdLILRB4‐infected mice (n = 4 mice for each group). The expression of LILRB4 was normalized to that of β‐actin. (B‐E) Body weight (B), fasting blood glucose (C), fasting serum insulin (D), and HOMA‐IR (E) values of ob/ob mice after 4 weeks of AdLILRB4 or AdGFP injection (n = 20 mice in each group). (F, G) Blood glucose levels of ob/ob mice in control, AdGFP, and AdLILRB4 groups according to GTT (F) and ITT (G) after 4 weeks of adenovirus injection (n = 20 mice in each group). (H) Liver weight and ratio of liver weight to body weight (LW/BW) of ob/ob mice in the indicated groups (n = 20 mice for each group). (I) Representative images of H&E and Oil Red O staining on liver sections of AdGFP‐ or AdLILRB4‐injected mice and control mice at 8 weeks old (n = 3 and 4 mice for each group). Scale bar: 100 μm. (J) The TG, TC, and NEFA contents in the liver of mice in the indicated groups (n = 20 mice in each group). (K) The mRNA expression of genes related to the inflammation of ob/ob mice after 4 weeks of AdLILRB4 or AdGFP injection (n = 4 mice for each group). (L) Representative images for Cd11b‐positive cells in the liver sections of ob/ob mice after 4 weeks of AdLILRB4 or AdGFP injection (n = 4 mice for each group). Scale bar: 20 μm. *P < 0.05 versus control group; # P < 0.05 versus AdGFP group.
Discussion
As one of the most prevalent liver diseases worldwide, NAFLD is a progressive, pathological condition that promotes more severe liver and metabolic diseases. No therapy is available, with the exception of preventative lifestyle improvements and physical exercise.16 In the current study, LILRB4 has been found to be up‐regulated in livers from NAFLD patients as well as hepatic steatosis mouse models. NAFLD is always accompanied by inflammation,17 and LILRB4 is up‐regulated under inflammatory stress.18 This phenomenon may be due to the negative feedback regulation to make LILRB4 suppress the excessive inflammation. Here, we demonstrated that an immune regulator, LILRB4, is a key suppressor of NAFLD through its potent inhibition of insulin resistance, hepatic steatosis, and inflammatory responses dependent on the SHP1–TRAF6 cascades. Importantly, adenovirus‐mediated overexpression of LILRB4 significantly relieved NAFLD development in a murine (ob/ob mouse) model of this disease. From a clinical perspective, these data indicate that targeting LILRB4 might be a promising therapeutic strategy for treating NAFLD and its related metabolic disorders.
In the progression of NAFLD development, the aberrant regulation of inflammation is a prominent driver.19 While holding a robust capacity to induce insulin resistance through its functional inhibition of IRS‐1 and PPARγ,20, 21, 22 inflammation also exacerbates hepatic lipid accumulation by rendering an imbalance of lipid flux.23, 24 In turn, impaired insulin sensitivity and fatty acid metabolic homeostasis aggravates inflammatory responses in the liver and the whole system.5, 25 Thus, inflammation, insulin resistance, and lipid accumulation cross‐talk occur and create a vicious cycle to ultimately promote NAFLD development.26 In this article, we found hepatocellular LILRB4 is up‐regulated while fed with HFD stress. Besides, we observed that hepatocellular LILRB4 significantly ameliorates hepatic lipid accumulation, insulin resistance, and inflammation. These results further suggest that LILRB4 functions in NAFLD progression in a hepatocellular manner. Interestingly, the systematic inflammatory response and lipid metabolic disorder were also dramatically inhibited by hepatocyte LILRB4 overexpression and exacerbated by hepatocyte LILRB4 deficiency, suggesting that hepatocyte LILRB4 plays a potent functional role in extra‐hepatocyte cells. Thus, a cell‐specific improvement of LILRB4 in hepatocytes might have a comprehensive and systematic benefit on liver and metabolic dysregulation.
We discovered that TRAF6 is the exact underlying mechanism for LILRB4 suppression with regard to NAFLD development that is related to SHP1. As a pivotal adaptor orchestrating inflammation, TRAF6 has emerged as an attractive drug target for several diseases, especially cancer.27, 28 In terms of NAFLD, TRAF6 inactivation is responsible for the miR‐146b–mediated attenuation of steatohepatitis.29 TRAF6 also participates in obesity‐associated insulin resistance by transducing the CD40 signaling pathway.30 Here, we report that blocking TRAF6 ubiquitination to inactivate downstream MAPK and NF‐κB signaling largely explained the inhibitory effect of LILRB4 on NAFLD progression, thereby providing further support for developing TRAF6 and its ubiquitination activation as therapeutic targets for inflammation‐related pathologies.
In conclusion, based on extensive evidence, including both gain‐ and loss‐of‐function approaches in vivo and in vitro, we identified hepatocyte LILRB4 as a potent NAFLD suppressor and an attractive therapeutic target for hepatic steatosis and related metabolic disorders; its action largely depends on direct interactions with SHP1 and the subsequent deubiquitination of TRAF6, leading to ameliorated inflammation, insulin resistance, and hepatic lipid accumulation.
Author names in bold designate shared co‐first authorship.
Supporting information
Additional Supporting Information may be found at http://onlinelibrary.wiley.com/doi/10.1002/hep.29633/suppinfo.
Supporting Information 1
Potential conflicts of interest: Nothing to report.
Supported by grants 81470535, 81570271, and 81673520 from the National Science Foundation of China.
These authors have contributed equally to this work.
Contributor Information
Ying Li, Email: lydia0312_2000@163.com.
Jingjing Cai, Email: caijingjing83@hotmail.com.
REFERENCES
- 1. Stepanova M, Rafiq N, Makhlouf H, Agrawal R, Kaur I, Younoszai Z, et al. Predictors of all‐cause mortality and liver‐related mortality in patients with non‐alcoholic fatty liver disease (NAFLD). Dig Dis Sci 2013;58:3017‐3023. [DOI] [PubMed] [Google Scholar]
- 2. Tilg H, Moschen AR. Insulin resistance, inflammation, and non‐alcoholic fatty liver disease. Trends Endocrinol Metab 2008;19:371‐379. [DOI] [PubMed] [Google Scholar]
- 3. Birkenfeld AL, Shulman GI. Nonalcoholic fatty liver disease, hepatic insulin resistance, and type 2 diabetes. Hepatology 2014;59:713‐723. [DOI] [PMC free article] [PubMed] [Google Scholar]
- 4. Dixon RA, Diehl RE, Opas E, Rands E, Vickers PJ, Evans JF, Gillard JW, et al. Requirement of a 5‐lipoxygenase‐activating protein for leukotriene synthesis. Nature 1990;343:282‐284. [DOI] [PubMed] [Google Scholar]
- 5. Olefsky JM, Glass CK. Macrophages, inflammation, and insulin resistance. Annu Rev Physiol 2010;72:219‐246. [DOI] [PubMed] [Google Scholar]
- 6. Baker RG, Hayden MS, Ghosh S. NF‐kappaB, inflammation, and metabolic disease. Cell Metab 2011;13:11‐22. [DOI] [PMC free article] [PubMed] [Google Scholar]
- 7. Wang PX, Zhang XJ, Luo P, Jiang X, Zhang P, Guo J, et al. Hepatocyte TRAF3 promotes liver steatosis and systemic insulin resistance through targeting TAK1‐dependent signalling. Nat Commun 2016;7:10592. [DOI] [PMC free article] [PubMed] [Google Scholar]
- 8. Cheng H, Mohammed F, Nam G, Chen Y, Qi J, Garner LI, et al. Crystal structure of leukocyte Ig‐like receptor LILRB4 (ILT3/LIR‐5/CD85k): a myeloid inhibitory receptor involved in immune tolerance. J Biol Chem 2011;286:18013‐18025. [DOI] [PMC free article] [PubMed] [Google Scholar]
- 9. Katz HR. Inhibition of pathologic inflammation by leukocyte Ig‐like receptor B4 and related inhibitory receptors. Immunol Rev 2007;217:222‐230. [DOI] [PubMed] [Google Scholar]
- 10. Hudson LE, Allen RL. Leukocyte Ig‐like receptors—a model for MHC class I disease associations. Front Immunol 2016;7:281. [DOI] [PMC free article] [PubMed] [Google Scholar]
- 11. Hilton IB, Gersbach CA. Enabling functional genomics with genome engineering. Genome Res 2015;25:1442‐1455. [DOI] [PMC free article] [PubMed] [Google Scholar]
- 12. Gan LT, Van Rooyen DM, Koina M, McCuskey RS, Teoh NC, Farrell GC. Hepatocyte free cholesterol lipotoxicity results from JNK1‐mediated mitochondrial injury and is HMGB1 and TLR4‐dependent. J Hepatol 2014;61:1376‐1384. [DOI] [PubMed] [Google Scholar]
- 13. Xiang M, Wang PX, Wang AB, Zhang XJ, Zhang Y, Zhang P, et al. Targeting hepatic TRAF1‐ASK1 signaling to improve inflammation, insulin resistance, and hepatic steatosis. J Hepatol 2016;64:1365‐1377. [DOI] [PubMed] [Google Scholar]
- 14. Ji YX, Zhang P, Zhang XJ, Zhao YC, Deng KQ, Jiang X, et al. The ubiquitin E3 ligase TRAF6 exacerbates pathological cardiac hypertrophy via TAK1‐dependent signalling. Nat Commun 2016;7:11267. [DOI] [PMC free article] [PubMed] [Google Scholar]
- 15. Kuroiwa A, Yamashita Y, Inui M, Yuasa T, Ono M, Nagabukuro A, et al. Association of tyrosine phosphatases SHP‐1 and SHP‐2, inositol 5‐phosphatase SHIP with gp49B1, and chromosomal assignment of the gene. J Biol Chem 1998;273:1070‐1074. [DOI] [PubMed] [Google Scholar]
- 16. Wang PX, Ji YX, Zhang XJ, Zhao LP, Yan ZZ, Zhang P, et al. Targeting CASP8 and FADD‐like apoptosis regulator ameliorates nonalcoholic steatohepatitis in mice and nonhuman primates. Nat Med 2017;23:439‐449. [DOI] [PubMed] [Google Scholar]
- 17. Wree A, Broderick L, Canbay A, Hoffman HM, Feldstein AE. From NAFLD to NASH to cirrhosis‐new insights into disease mechanisms. Nat Rev Gastroenterol Hepatol 2013;10:627‐636. [DOI] [PubMed] [Google Scholar]
- 18. Wang LL, Chu DT, Dokun AO, Yokoyama WM. Inducible expression of the gp49B inhibitory receptor on NK cells. J Immunol 2000;164:5215‐5220. [DOI] [PubMed] [Google Scholar]
- 19. Smith BW, Adams LA. Non‐alcoholic fatty liver disease. Crit Rev Clin Lab Sci 2011;48:97‐113. [DOI] [PubMed] [Google Scholar]
- 20. Oh KJ, Han HS, Kim MJ, Koo SH. CREB and FoxO1: two transcription factors for the regulation of hepatic gluconeogenesis. BMB Rep 2013;46:567‐574. [DOI] [PMC free article] [PubMed] [Google Scholar]
- 21. Liu W, Cao H, Ye C, Chang C, Lu M, Jing Y, et al. Hepatic miR‐378 targets p110alpha and controls glucose and lipid homeostasis by modulating hepatic insulin signalling. Nat Commun 2014;5:5684. [DOI] [PubMed] [Google Scholar]
- 22. Gross B, Pawlak M, Lefebvre P, Staels B. PPARs in obesity‐induced T2DM, dyslipidaemia and NAFLD. Nat Rev Endocrinol 2017;13:36‐49. [DOI] [PubMed] [Google Scholar]
- 23. Jin C, Flavell RA. Innate sensors of pathogen and stress: linking inflammation to obesity. J Allergy Clin Immunol 2013;132:287‐294. [DOI] [PubMed] [Google Scholar]
- 24. Samuel VT, Shulman GI. The pathogenesis of insulin resistance: integrating signaling pathways and substrate flux. J Clin Invest 2016;126:12‐22. [DOI] [PMC free article] [PubMed] [Google Scholar]
- 25. Lumeng CN, Saltiel AR. Inflammatory links between obesity and metabolic disease. J Clin Invest 2011;121:2111‐2117. [DOI] [PMC free article] [PubMed] [Google Scholar]
- 26. Samuel VT, Shulman GI. Mechanisms for insulin resistance: common threads and missing links. Cell 2012;148:852‐871. [DOI] [PMC free article] [PubMed] [Google Scholar]
- 27. Liu H, Tamashiro S, Baritaki S, Penichet M, Yu Y, Chen H, et al. TRAF6 activation in multiple myeloma: a potential therapeutic target. Clin Lymphoma Myeloma Leuk 2012;12:155‐163. [DOI] [PMC free article] [PubMed] [Google Scholar]
- 28. Landstrom M. The TAK1‐TRAF6 signalling pathway. Int J Biochem Cell Biol 2010;42:585‐589. [DOI] [PubMed] [Google Scholar]
- 29. Jiang W, Liu J, Dai Y, Zhou N, Ji C, Li X. MiR‐146b attenuates high‐fat diet‐induced non‐alcoholic steatohepatitis in mice. J Gastroenterol Hepatol 2015;30:933‐943. [DOI] [PubMed] [Google Scholar]
- 30. Chatzigeorgiou A, Seijkens T, Zarzycka B, Engel D, Poggi M, van den Berg S, et al. Blocking CD40‐TRAF6 signaling is a therapeutic target in obesity‐associated insulin resistance. Proc Natl Acad Sci U S A 2014;111:2686‐2691. [DOI] [PMC free article] [PubMed] [Google Scholar]
Associated Data
This section collects any data citations, data availability statements, or supplementary materials included in this article.
Supplementary Materials
Additional Supporting Information may be found at http://onlinelibrary.wiley.com/doi/10.1002/hep.29633/suppinfo.
Supporting Information 1


