

Abstract
The stress sensors ATF6, IRE1, and PERK monitor deviations from homeostatic conditions in the endoplasmic reticulum (ER), a protein biogenesis compartment of eukaryotic cells. Their activation elicits unfolded protein responses (UPR) to re-establish proteostasis. UPR have been extensively investigated in cells exposed to chemicals that activate ER stress sensors by perturbing calcium, N-glycans, or redox homeostasis. Cell responses to variations in luminal load with unfolded proteins are, in contrast, poorly characterized. Here, we compared gene and protein expression profiles in HEK293 cells challenged with ER stress–inducing drugs or expressing model polypeptides. Drug titration to limit up-regulation of the endogenous ER stress reporters heat shock protein family A (Hsp70) member 5 (BiP/HSPA5) and homocysteine-inducible ER protein with ubiquitin-like domain 1 (HERP/HERPUD1) to levels comparable with luminal accumulation of unfolded proteins substantially reduced the amplitude of both transcriptional and translational responses. However, these drug-induced changes remained pleiotropic and failed to recapitulate responses to ER load with unfolded proteins. These required unfolded protein association with BiP and induced a much smaller subset of genes participating in a chaperone complex that binds unfolded peptide chains. In conclusion, UPR resulting from ER load with unfolded proteins proceed via a well-defined and fine-tuned pathway, whereas even mild chemical stresses caused by compounds often used to stimulate UPR induce cellular responses largely unrelated to the UPR or ER-mediated protein secretion.
Keywords: endoplasmic reticulum stress (ER stress), ER quality control, unfolded protein response (UPR), molecular chaperone, protein folding, protein misfolding
Introduction
In Eukarya, about 40% of the proteome is synthesized in the endoplasmic reticulum (ER)2 (1). The function of this compartment might be challenged by fluctuations in protein synthesis, accumulation of misfolded by-products of protein biogenesis, infections, aging, and stress-inducing chemicals (2–5). These pathologic conditions activate ER-membrane embedded stress sensors, IRE1, ATF6, and PERK, and signaling cascades that enhance transcription and translation of ER-resident protein folding, quality control, and degradation factors, increase the ER volume and reduce the ER load with protein cargo. If the stress cannot be resolved by these so-called unfolded protein responses (UPR), apoptotic programs are activated that eventually lead to cell death (6–8).
In the past decades, the UPR have been extensively studied by exposing cells to chemical stress inducers such as dithiothreitol (DTT), tunicamycin (TM), or thapsigargin (TG) (9), which perturb redox, N-glycans, and calcium homeostasis, respectively. These studies led to characterizing the signaling cascades regulating transcription and translation of several hundred gene products involved in protein biogenesis, function of the secretory pathway, and cell death in yeast (10) and in mammalian cells (11–17). These compounds, however, nonspecifically activate all three mammalian UPR branches and their use has pleiotropic consequences resulting in lethal multiorganelle and multicompartmental failures (18). A handful of studies analyzed responses to expression of unfolded proteins in the mammalian ER (e.g. Refs. 19–24). Strikingly however, given the meaning of the acronym UPR (i.e. responses to unfolded proteins), comparative high throughput studies at the transcriptome and proteome level aiming to distinguish chemical- versus unfolded protein–induced ER stresses of the same magnitude and to molecularly characterize these latter, remain to be performed.
Here, we compare responses of mammalian cultured cells upon perturbation of ER homeostasis on exposure to conventional ER stress–inducing chemicals or on individual expression of one folding-competent and four different folding-defective proteins. The levels of chemically or unfolded protein–induced ER stresses were eventually set to the same magnitude by adjusting drugs and unfolded protein concentrations to cause a doubling of the cellular content of BiP/HSPA5 and HERP/HERPUD1 as endogenous reporters for ER perturbations. Variations in cell transcriptome, proteome, and UPRome were determined by gene expression profiling (GEP) (25), quantitative RT-PCR (qPCR), label-free quantification shotgun mass spectrometry (LFQ-MS) (26), and Western blots. We report that UPR induction on unfolded protein load in the ER requires association of the unfolded cargo with the luminal chaperone BiP/HSPA5. Moreover, and as a crucial difference with chemical stresses of the same magnitude that modify expression of a variety of genes, compartmental load with unfolded proteins specifically induces transcription and translation of a subset of chaperones engaged in a functional complex previously reported to bind unfolded polypeptide chains.
Results
Induction of ER stress on unfolded proteins expression
To analyze cellular responses on luminal accumulation of unfolded proteins, we initially generated a panel of Flp-InTM T-RExTM-inducible HEK293 cell lines for expression of HA-tagged versions of three well characterized folding-defective polypeptides (BACE457, BACE457Δ (27), and CD3δ (28)) and one folding- and secretion-competent protein, α1ATM (29) (Fig. 1A). Transgene expression was induced on exposure of the corresponding cells to 100 ng/ml of tetracycline (Fig. 1B). Tetracycline per se was not affecting mRNA levels of ER stress reporter genes as determined by qPCR (Fig. S1A). BACE457 and BACE457Δ induction with 100 ng/ml of tetracycline (Fig. 1B, triplicates, lanes 1–6) elicited an ER stress response as revealed by the 2.45, respectively, 1.8-fold increase of BiP/HSPA5 transcripts (Fig. 1C), increase of HERP/HERPUD1 mRNA as determined by qPCR (Fig. 1D) and BiP and HERP proteins as monitored in Western blot (Fig. 1, E–G, Fig. S1B). The expression of the folding-competent α1ATM (Fig. 1B, lanes 13–15), which is rapidly secreted from the ER (29), did not change the level of the endogenous ER stress reporter's transcripts and proteins (Fig. 1, C, E, and F). Interestingly, CD3δ even if retained in the ER at higher levels compared with BACE457 and BACE457Δ (Fig. 1B, lanes 1–6 versus 7–9) did not result in significant variations of ER stress reporters expression (Fig. 1, C–F and H).
Figure 1.

ER retention and BiP binding are requisite for UPR induction. A, panel of model proteins expressed by inducible HEK293 cells used in this study. B, Western blot (WB) showing the expression level of model proteins on induction with 100 ng/ml of tetracycline. Loadings were normalized based total protein concentration. C, BiP mRNA up-regulation upon 17 h induction of the different model proteins with 100 ng/ml of tetracycline. Mean ± S.E., n = 3, ***, p < 0.001, nonspecific (ns), p > 0.5, one-way ANOVA with Dunnett's test for multiple comparisons. D, same as C for HERP mRNA. E, BiP protein up-regulation upon 17 h induction of the different model proteins with 100 ng/ml of tetracycline quantified by Western blot. Mean ± S.E., n = 3, ***, p < 0.001, ns, p > 0.5, one-way ANOVA with Dunnett's test for multiple comparisons. F, same as D for HERP. G, Western blot showing tunable expression of BACE457-HA and progressive induction of UPR markers GRP94, BiP, and HERP. * indicates unspecific, cross-reactive band. In the quantification the blue line is calculated as the average fold-change of the three UPR markers ± S.E. H same as F for CD3δ, which does not induce UPR. I, BiP co-precipitation with unfolded proteins. * indicates anti-HA heavy chain. J, quantification of H. Mean ± S.E., n = 3, *, p < 0.05, BootsRatio (68). K, same as C for drug treatments. ****, p < 0.0001. BACE457 as reference. L, same as E for drug treatments. **, p < 0.01. BACE457 as reference. M same as F for drug treatments. **, p < 0.01. BACE457 as reference.
Next, we compared consequences of the inducible expression of BACE457 (Fig. 1G), BACE457Δ (Fig. S1B), and CD3δ (Fig. 1H) as obtained with a stepwise increase of tetracycline from 0 to 100 ng/ml. The intracellular concentration of the transgenes was determined by comparing protein standards and ranged from a not detectable level in non-induced cells up to 1.34 fmol/cell for BACE457 (Fig. 1G) and up to 2.71 fmol/cell for CD3δ (Fig. 1H). Western blot analyses of total cell extracts separated in polyacrylamide gel electrophoresis revealed that the expression of BACE457 gradually elevated the intraluminal levels of BiP/HSPA5, GRP94/HSP90B1, and HERP/HERPUD1 as an indication of a dose-dependent UPR induction (Fig. 1G). The same dose-dependent UPR induction was observed on increasing expression of BACE457Δ (Fig. S1B). Remarkably, and confirming the qPCR and Western blot data quantified in Fig. 1, C–F, the expression of CD3δ did not induce UPR as shown by the unchanged levels of the endogenous UPR reporter proteins even on maximal luminal accumulation of the transgene (Fig. 1H).
ER retention and BiP binding are required for ER stress induction by unfolded proteins
Lack of BiP/HSPA5, GRP94/HSP90B1, and HERP/HERPUD1 induction on intraluminal accumulation of CD3δ, which is 2-fold higher than BACE457 and BACE457Δ (Fig. 1B), was somewhat surprising because like BACE457, CD3δ is retained in the ER as an unfolded, orphan subunit of the T cell receptor complex (28). To date, two models of UPR activation do exist. In a first model, UPR are induced on direct binding of misfolded polypeptides to the ER stress sensor IRE1 (30–33). This model is based on the crystal structure of yeast IRE1 showing a putative peptide-binding groove similar to that of the class I major histocompatibility complex (31, 32), which is also present in human IRE1 and predicted in the luminal domain of PERK (31, 34). Recently such an activation mechanism for mammalian IRE1α was confirmed, showing that the luminal domain of IRE1α binds unfolded proteins with a characteristic amino acid bias (30). A second model suggests that the stress sensors IRE1, ATF6, and PERK are activated when BiP, which is bound to the luminal domains of the stress sensors at steady state, is sequestered by unfolded polypeptides (35–41).
We noticed that, in contrast to the ER stress inducers BACE457 and BACE457Δ, CD3δ is a poor BiP-binder. In fact, co-immunoprecipitation experiments revealed a 3-fold lower association of BiP with CD3δ (Fig. 1, I, lanes 1–3 versus 4–6, and J). In an attempt to increase BiP-binding and to verify whether BiP sequestration by the unfolded protein, rather than the retention of the unfolded polypeptide in the ER is required for UPR activation, we deleted the CD3δ oligosaccharides by introducing an asparagine to glutamine mutation in the three CD3δ's glycosylation sequons. N-Linked oligosaccharides are in fact bulky, hydrophilic moieties that interfere with BiP-binding (42). We generated an inducible cell line expressing the non-glycosylated CD3δQQQ polypeptide (Fig. 1B, lanes 10–12) to confirm that BiP association was increased about 3-fold compared with the glycosylated form of the protein (Fig. 1, I, lane 7 versus 9, and J). Consistent with the second hypothesis that BiP binding determines UPR induction, CD3δQQQ accumulated in the ER at a 2-fold lower level than CD3δ (Fig. 1B), but its expression activated an ER stress response characterized by a 1.89-fold up-regulation of BiP/HSPA5 and HERP/HERPUD1 transcripts (Fig. 1, C and D) and an elevated level of BiP and HERP protein expressions (Fig. 1, E and F). All in all, to induce an ER stress response, ER-retained unfolded proteins must sequester a sufficient amount of BiP from the ER lumen.
Chemical induction of ER stress
The bacterial product TM inhibits the transfer of N-acetylglucosamine-1-phosphate from UDP-N-acetylglucosamine to dolichol phosphate thus preventing N-glycosylation of newly synthesized secretory proteins (43). The plant product TG inactivates the sarco/ER Ca2+-ATPase thereby perturbing calcium homeostasis (44). The reducing agent DTT compromises the cellular redox homeostasis (45). In a preliminary set of experiments, we verified by qPCR and Western blot the variations in BiP/HSPA5 and HERP/HERPUD1 levels on conventional treatments with the ER stress–inducing drug TM (i.e. 5 μg/ml, 17 h) (9, 46). Drug treatment was performed on the inducible cell line expressing BACE457 grown in the absence of tetracycline (i.e. not expressing the transgene as shown in Fig. 1G, lane 1). qPCR analyses revealed a 9.76-fold up-regulation of BiP/HSPA5 mRNA (Fig. 1K, TMhigh) and Western blot analyses confirmed the abundant rise in the intraluminal level of BiP and HERP proteins (Fig. 1, L and M, TMhigh). Thus, TMhigh induction of BiP/HSPA5 and HERP/HERPUD1 expression was up to 5 times higher than the up-regulation observed on luminal accumulation of BACE457 in the same cell line (Figs. 1, K–M) or of BACE457Δ or CD3δQQQ in two independent cell lines (Fig. 1, C–F).
To evaluate the specificity of gene expression induction by drug versus unfolded protein load, we titrated the working concentration of drugs to doses that induced similar levels of BiP/HSPA5 and HERP/HERPUD1 as the expression of the unfolded polypeptides (BACE457 as standard in Fig. 1, K–M). The established concentrations were 40 ng/ml of TM (TMlow, the literature reports use of doses ranging between 5 and 10 μg/ml) and 25 nm TG (TGlow, the literature reports use of doses ranging between 200 and 300 nm) (9, 46) (Fig. 1, K–M, and Fig. S1C). DTT proved highly toxic at the lowest concentration elevating the levels of endogenous ER stress reporters and was therefore not used in our experiments. Thus, RNA for GEP and proteins for LFQ-MS (Fig. 2A) were prepared from inducible HEK293 cells treated with the given drug concentrations for 17 h or expressing the model polypeptides for 17 h.
Figure 2.

Transcriptional responses to ER stress–inducing chemicals and unfolded proteins. A, schematic representation of the workflow for GEP (left) and LFQ-MS (right). B, distribution of fold-changes from GEP data. Numbers on top and bottom show the number of significantly up- and down-regulated transcripts (p < 0.05, fold-change >20%) in each condition, dashed line shows the ±20% fold-change. Shown are only values outside the 1–99 percentile range. C, histogram showing the number of significantly up-regulated UPR target genes. UPRome (red) are all UPR target genes as defined based on literature (see text). D, hierarchical clustering based on the 97 UPRome genes up-regulated by TMhigh and shown as a heat map. Genes are ordered based on their dependence from the different UPR branches (colored lines on the right).
Transcriptional responses to drug challenges
Cellular responses to ER perturbations by drugs or ER load with unfolded proteins were first monitored by GEP to characterize transcriptional responses. TM as used in the literature (TMhigh, 5 μg/ml for 17 h) enhanced the levels of 508 and reduced the level of 261 transcripts (Fig. 2B, Table S1 and see “Discussion” for down-regulated gene products). Filtering the gene products induced by TMhigh for 278 ATF6-, IRE1- and PERK-responding genes (Fig. 2C, UPRome, Table S2) selected from the literature (11–17) revealed that only 20% (i.e. 97) of the 508 up-regulated mRNAs are bona fide UPR target genes (Fig. 2, C and D, TMhigh). Titration of drug doses to obtain unfolded protein load-like magnitude of BiP/HSPA5 and HERP/HERPUD1 induction (Fig. 1, K–M) limited the drug-induced transcriptional up-regulation from 508 to 131 genes (Fig. 2B, TMlow), 30% of which (i.e. 41) belong to the UPRome (Fig. 2, C and D, TMlow). Under the same experimental set up, TG enhanced transcription of 242 genes (Fig. 2B, TGlow), 47 of which (20%) belong to the UPRome (Fig. 2, C and D, TGlow). The identity of the up-regulated genes shown in Venn diagrams revealed highly divergent responses with only 25% of the chemical-induced genes (i.e. 75 of 298, Fig. 3A, Table S3) enhanced on both TMlow and TGlow treatments. Responses at the level of the UPRome were, in contrast, largely overlapping with 60% of the ATF6-/IRE1-/PERK-responding genes (33 of 55, Fig. 3B, color-code as in Fig. 2D), whose expression was enhanced by both TMlow and TGlow. All in all, drug exposure enhanced the intracellular level of several hundreds of transcripts. Reduction of the drugs from the concentrations normally used in the literature, to doses that enhance BiP/HSPA5 and HERP/HERPUD1 to values measured in cells, whose ER has been loaded with unfolded polypeptides, substantially reduced the response's magnitude. However, responses remained pleiotropic and poorly overlapping among drugs. Moreover, between 70 (TMlow) and 80% of the induced genes (TMhigh and TGlow) did not belong to the UPRome.
Figure 3.

Unfolded proteins induce a subset of chemically induced UPR genes. A, Venn diagrams showing the overlap of significantly up-regulated genes by TGlow and TMlow. B, same as A but considering UPRome genes only. Gene names are color-coded based on their dependence on the different UPR branches. C, overlap between UPRome genes induced by TGlow, TMlow, and unfolded proteins.
Transcriptional responses to intraluminal load of unfolded polypeptides
Next, we evaluated transcriptional cell responses to the luminal load of unfolded proteins obtained by growing the inducible HEK293 cell lines in the presence of 100 ng/ml of tetracycline to induce the expression of the transgene. As previously written, tetracycline did not modify, per se, gene expression (Fig. S1A). GEP analyses were performed in triplicates (Figs. 1B and 2) and confirmed the qPCR and Western blot analyses (Fig. 1, C–F, and Fig. S2) in showing that induction of CD3δ and α1ATM, a poor BiP-binder and a folding-competent polypeptide rapidly secreted from the ER, failed to induce a significant transcriptional response and did not affect expression of ER stress genes (Fig. 2, B–D). In contrast, the ER load with BACE457, BACE457Δ, and CD3δQQQ induces a dose-dependent response that was monitored by qPCR (Fig. 1, C and E), Western blot (Fig. 1, D, F, and G, and Fig. S1B), and GEP (Fig. 2, B–D). GEP revealed that the ER load with the three unfolded proteins led to the induction of 15, 12, and 52 genes, respectively (Fig. 2B). Notably, even though the magnitude of the ER stress induced by non-glycosylated CD3δQQQ was similar or slightly lower compared with the stress induced by the glycosylated BACE457 and BACE457Δ (Fig. 1, C–F), the ER load with this protein induced a larger set of genes. This difference remained when only UPR genes were considered. In fact, BACE457 and BACE457Δ induced 9 and 8 ER stress genes, whereas CD3δQQQ induced 16 (Fig. 2, C and D).
Hierarchical clustering of the UPRome genes induced by drugs or by ER load with unfolded proteins highlights the relevant differences (Fig. 2D). TMhigh induced 97 UPR gene products responding to ATF6, IRE1, and PERK activation. Reduction of the stress magnitude on drug titration (TMlow and TGlow) decreased the number of induced genes to 41 and 47, respectively, but it did not change the fact that all three UPR branches were activated on drug exposure. In contrast, at ER stress magnitudes comparable with those elicited by low drug concentrations, cell responses to ER load with BACE457, BACE457Δ, and CD3δQQQ were not only characterized by the induction of a more restricted number of UPR gene products, but also by the fact that no activation of the PERK pathway was measurable in GEP and qPCR (Figs. 2D and 4A). Consistently, in a functional assay that should probe the activation of the cell death pathway downstream of PERK (47), the ER load with unfolded polypeptides did not affect cell viability (Fig. 4B), nor cell proliferation over a time span of 4 days (Fig. 4, C and D). In contrast, chemical treatment caused cell death (Fig. 4B) and/or inhibited (TMlow), or fully blocked (TMhigh and TGlow) cell proliferation (Fig. 4C). The identity of the UPR gene products up-regulated in cells expressing the three unfolded polypeptides shown in the Venn diagrams reveals the overlapping and more focused cellular response to the ER load with unfolded cargo (Fig. 3C).
Figure 4.
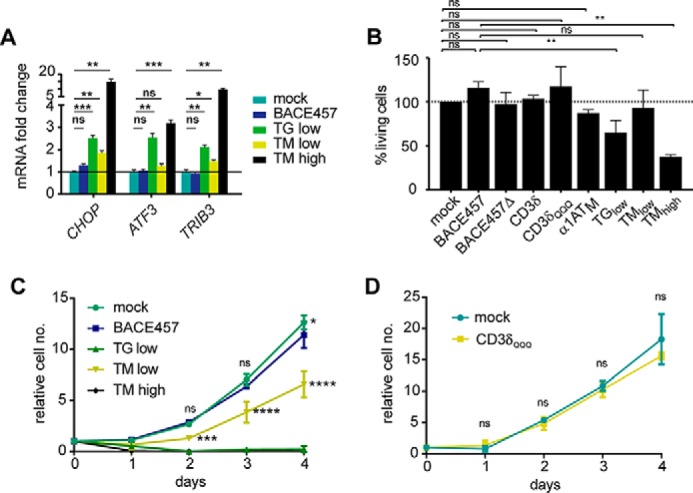
Unfolded proteins do not affect cellular viability, in contrast to drugs. A, qPCR data for transcription PERK genes linked to apoptosis. Mean ± S.E., n = 3, nonspecific (ns), p > 0.05; *, p < 0.05; **, p < 0.01; ***, p < 0.001, unpaired two-tailed t tests. B, percentage of living cells after 17 h induction of model proteins and drug treatments relative to mock, ns, p > 0.05, **, p < 0.01, one-way ANOVA with Dunnett's test for multiple comparisons. C, cell growth of BACE457-inducible cells, expressed as relative cell number, over 4 days with the respective treatment, ns, p > 0.05, *, p < 0.05; ***, p < 0.001; ****, p < 0.0001, two-way ANOVA with Dunnett's test for multiple comparisons. N.B., TGlow and TMhigh are highly significant (****) at all time points. D, same as C for CD3δQQQ expressing cells, ns, >0.05 two-way ANOVA with Dunnett's test for multiple comparisons.
Cell responses to drug challenges: Validation of transcript changes at the protein level
GEP analyses led to the identification of a set of UPR gene transcripts, whose expression was induced by drugs, and a more restricted set that was induced by ER load with unfolded proteins (Figs. 2, C and D, and 3, and Table S4). To verify whether the transcriptional responses actually enhanced expression of the corresponding gene products, we analyzed the variations of protein levels in cells exposed to high and low doses of stress-inducing chemicals or expressing unfolded proteins. Analyses were performed by LFQ-MS, which enabled the identification and quantification of about 3300 gene products in each sample's triplicate (Figs. 1B and 2A). Despite the cross-platform differences, LFQ-MS identified 50 of the 97 UPR gene products transcriptionally induced by TMhigh and 25 of the 41, respectively, and 25 of the 47 gene products induced by TMlow and TGlow. Not all of the identified UPR targets transcriptionally up-regulated showed a significant up-regulation at the protein level (Fig. 5, A and B, Fig. S3A, Table S5).
Figure 5.

Unfolded proteins induce a subset of ER chaperones and folding enzymes. A, histograms showing UPRome coverage by MS with the respective percentage. B, correlation between mRNA log2 fold-change (y axis) and protein log2 fold-change (x axis) from GEP and LFQ-MS data, respectively, upon drug treatments for mRNA-protein pairs with a positive log2 fold-change values. C, same as B for expression of unfolded proteins. D, interaction network (string-db.org/)3 (69) of identified core UPR genes induced by the expression of unfolded proteins. Color-code defines the dependence of different UPR branches and in italic their role and function.
Cell responses to intraluminal load of unfolded polypeptides: Validation of transcript changes at the protein level reveals enhanced expression of individual components of a functional complex binding unfolded polypeptides
Significantly, LFQ-MS analyses of cell responses to ER load with BACE457, BACE457Δ, and CD3δQQQ almost perfectly covered the UPR genes identified by the GEP analyses. In fact, 7 of the 9 UPR genes transcriptionally induced by the ER load with BACE457 were identified at the protein level (Fig. 5, A and C, and Fig. S3B). Likewise, all genes transcriptionally induced by BACE457Δ and 13 of the 16 induced by CD3δQQQ were identified at the protein level (Fig. 5, A and C, Fig. S3B, and Table S5). More precisely, genes found to be transcriptionally (by GEP and/or qPCR) and translationally (by LFQ-MS and/or Western blot) induced by two or all three unfolded polypeptides were BiP/HSPA5, GRP94/HSP90B1, ERp72/PDIA4, SDF2L1/SDF2L1, GRP170/HYOU1, ERdj3/DNAJB11, and MANF/ARMET (Fig. 5, C and D, Figs. S3B and S4). Interestingly, all these proteins, and CRELD2, participate in a supramolecular functional complex reported to associate with unfolded proteins in the ER lumen (48, 49). CRELD2/CRELD2, whose transcriptional induction emerged, on the ER load with all three model proteins by GEP and qPCR analyses (Fig. 4C, Fig. S4) was not among the 3,300 proteins identified by LFQ-MS for BACE457 induction and its induction was not assessed by Western blot. To the “UPR core genes” induced on the ER load with unfolded proteins, HERP/HERPUD1 must also be added. HERP/HERPUD1 induction was detected by qPCR and GEP. Even though HERP was not among the 3,300 proteins identified by LFQ-MS, its up-regulation was confirmed by Western blot (Fig. 1, F–H and M, Fig. S1B). In contrast, for a handful of other gene products (e.g. calreticulin, calnexin, and WARS), the induction on the ER load was dismissed because it was observed for a single unfolded polypeptide by GEP (at the threshold limit) and it was not confirmed by qPCR (Fig. S4).
Discussion
Activation of the UPR is a hallmark of the general perturbation of cellular homeostasis (chemicals and environmental changes) or organelle-specific challenges such as accumulation of unfolded proteins in the ER lumen (6). UPR activation enhances or reduces the level of gene transcripts and proteins. In this work, we restricted our analyses to gene products, whose transcription and translation were enhanced by chemical challenges or on ER load with unfolded proteins. We did not analyze the gene products that were down-regulated on perturbation of ER homeostasis (Fig. 2A). However, reduction of transcript levels followed the same trend as gene induction. A large number of gene products was suppressed and/or degraded (e.g. by regulated IRE1-dependent decay of mRNA (RIDD) (50)) at conventional ER stress–inducing drug doses (TMhigh). Low doses of drugs reduced the transcript level of much less genes and this reduction was virtually absent on the ER load with unfolded proteins (Fig. 2A).
From our analyses, the UPR resulting from the ER load with unfolded proteins emerge as a fine-tuned pathway, whose magnitude of activation matches the sequestration of the luminal chaperone BiP by unfolded proteins. As such, ER load with up to 3 fmol/cell of the poor BiP-binder CD3δ or expression of α1ATM, a folding-competent protein rapidly secreted from the ER, does not elicit a detectable transcriptional response. In contrast, less than 1 fmol/cell of unfolded proteins with a high capacity to engage BiP, like the non-glycosylated CD3δQQQ polypeptide or the glycosylated BACE proteins analyzed in this study, is sufficient to induce transcription and translation of ER stress markers. We did not focus on direct unfolded protein binding to the luminal domain of IRE1 (or PERK), but it would be interesting to characterize if our model-unfolded proteins differ also in this respect (30).
It is generally accepted that cell exposure to chemical compounds, the commonly used experimental set-up to investigate UPR, has pleiotropic consequences that only partially recapitulate, or may even overshadow, the series of events triggered by the intraluminal accumulation of unfolded proteins (18, 51). This is especially true at drug concentrations as commonly used in experiments reported in the available literature (and recapitulated here by the TMhigh experiments), where hundreds of genes are induced or repressed, the vast majority of which have no direct connection with ER and secretory pathway functions (51, 52). Perturbation of calcium, N-glycosylation, and redox homeostasis impacts on all intracellular organelles and compartments, whereas unfolded secretory proteins are confined in the ER lumen. Our results show that even mild chemical stresses obtained by titration of drugs to match responses to unfolded protein load (as set by the level of BiP/HSPA5 and HERP/HERPUD1 induction, which was 2-fold in our experiments, Fig. 1) fail to report with fidelity the responses observed on luminal load with unfolded polypeptides. The response to the unfolded proteins load in the ER is certainly contained in the cellular response to chemical challenges but must be, and actually is, more specific. Interestingly, although needing deeper investigation, transcriptional responses to UPR-inducing compounds are not faithfully mirrored at the translational level, whereas during the response to unfolded proteins transcription and translation seem to go hand in hand. These findings underlie the importance of studying the UPR in a context-dependent manner and, possibly, to avoid the use of pharmacological UPR inducers to recapitulate consequences of protein misfolding in the ER.
Responses to ER load with three different glycosylated or non-glycosylated membrane-tethered or soluble polypeptides were strikingly limited to the up-regulation at the transcript and at the protein level, of a handful of gene products (Fig. 5D). BiP/HSPA5, its co-factors GRP170/HYOU1, ERj3/DNAJB11, and SDF2L1, the molecular chaperone GRP94/HSP90B1, and the oxidoreductase ERp72/PDIA4 are functionally linked (Fig. 5D). In fact, they are part of a functional complex that binds unfolded polypeptide chains in the mammalian ER shielding their interaction with CNX/CRT (48) and play well established roles in secretory proteins quality control (53–55). HERP is an unconventionally short-living ERAD factor that acts as a scaffold for assembly of supramolecular membrane-embedded complexes regulating dislocation of misfolded polypeptides from the ER lumen into the cytosol for proteasomal degradation (56). It has been proposed that elevation of HERP levels both by inducing its expression or by slowing-down its turnover might be part of the first line of cellular defense to accumulation of unfolded proteins in processes that have been collectively defined as ERAD tuning (57). The case of MANF/ARMET and CRELD2/CRELD2 is also of interest. They are both stress-inducible ER proteins displaying a KDEL-like retention motif. MANF has been described to regulate cell proliferation and protect against ER stress–induced cell death (58). CRELD2 has PDI-like activity (49). Intriguingly enough, both proteins have been shown to participate in the supramolecular complex containing all proteins identified in our study as UPR core genes (i.e. BiP/HSPA5, GRP170/HYOU1, ERj3/DNAJB11, SDF2L1, GRP94/HSP90B1, and ERp72/PDIA4) (49). All in all, this complex might serve two functions. First, being chaperones and folding enzymes engaged in the same complex it could facilitate efficient folding of nascent polypeptides. Second, this complex might sequester unfolded proteins facilitating their degradation via ERAD through interaction with HERP, thus preserving function of the CNX/CRT cycle. How cells respond to the load of biosynthetic compartments with unfolded polypeptides is a crucial question in cell biology and medicine because defective or exaggerated responses might cause organ and tissue failures as observed in gain-of-function diseases related to expression of mutant gene products (5, 52, 59). The essential UPR components and mechanisms have been identified by the pioneering work of several groups that took advantage of chemical compounds that elicit cellular stresses (9). The fine work of understanding the molecular details of specific responses to ER-confined perturbations awaits in-depth investigation of consequences of the intraluminal load of proteins with different chemical-physical features such as aggregation proneness, glycosylation state, topology, and membrane association. Also, substantially obscure remains the relevance of post-translational cellular responses to intra-compartmental load with misfolded proteins. These poorly characterized events consist of regulated covalent modifications that modulate chaperone activities (e.g. ampylation of BiP (60, 61) or calnexin palmitoylation (62)), regulated formation/disassembly of functional complexes, or regulated turnover of specific ER-resident factors that control, for example, degradation of misfolded proteins (ERAD tuning) (57, 63, 64). As a final note on this subject, although comparison of transcriptomics and proteomics nicely revealed the transcriptional nature of the UPR, our LFQ-MS analyses additionally identified a number of proteins, whose level is enhanced on the ER load with unfolded BACE457, BACE457Δ, and CD3δQQQ in the absence of transcriptional induction of the corresponding genes. Most notably, ER load with CD3δ, which does not induce a transcriptional UPR because the unfolded protein is a poor BiP-binder, elevates the level of a number of proteins. Although difficult to classify, these transcriptionally-independent up-regulated proteins are enriched for mitochondrial proteins, components and regulators of the cytoskeleton, and proteins involved in the regulation of transcription (transcription factors and other RNA-binding proteins).
Experimental procedures
Cell lines, plasmids, and inhibitors
Parental HEK293 Flp-InTM T-RExTM (Invitrogen) cells were grown in DMEM containing 10% FCS, 15 μg/ml of blasticidin, and 100 μg/ml of zeocin. Inducible HEK293 Flp-InTM T-RExTM cells (Invitrogen) were grown in DMEM containing 10% FCS, 15 μg/ml of blasticidin, and 150 μg/ml of hygromycin at 37 °C and 5% CO2. Expression of the construct of interest was induced using 10–100 ng/ml of tetracycline (Sigma) in DMEM containing 10% FCS. HEK293 cells were grown in DMEM containing 10% FCS at 37 °C and 5% CO2.
Generation of inducible HEK293 Flp-InTM T-RExTM cells was performed following the manufacturer's protocol. Shortly after genes of interest were cloned into the pcDNA5/FRT/TO multiple cloning site with a 3′ HA tag sequence. pcDNA5/FRT/TO constructs were co-transfected with a pOG44 plasmid encoding the Flp recombinase using Lipofectamine® 2000 (Invitrogen) following the manufacturer's instruction. Selection in DMEM containing 10% FCS, 15 μg/ml of blasticidin, and 150 μg/ml of hygromycin resulted in a mixed clonal population that was used for the experiments. ER stress was induced using 25 nm thapsigargin (Sigma) and 40 ng/ml or 5 μg/ml of tunicamycin (Sigma) in DMEM containing 10% FCS.
Cell lysis, immunoprecipitation, and Western blot
After the respective treatment cells were washed with ice-cold PBS containing 20 mm N-ethylmaleimide and lysed in 2% CHAPS (Anatrace) in HEPES-buffered saline, pH 6.8, RIPA buffer, or 8 m urea in 0.1 m NH4HCO3, containing 20 mm N-ethylmaleimide. Protease inhibitors (200 mm PMSF, chymostatin, leupeptin, antipain, and pepstatin, 5 mm each) and 11 units/ml of apyrase (when performing BiP co-precipitations) (Sigma) were used for 20 min on ice. Postnuclear supernatants were collected after centrifugation at 10,000 × g for 10 min.
For immunoprecipitations, postnuclear supernatant in the respective lysis buffer was incubated with Protein A or G beads (Sigma, 1:10, w/v, swollen in PBS) and the antibody against the protein of interest at 4 °C. Beads were washed three times with 0.5% CHAPS or 0.5% Triton X-100, resuspended in sample buffer containing DTT (Roche Applied Science), denatured for 5 min at 95 °C, and samples were subjected to SDS-PAGE. Proteins were transferred to PVDF membranes using the Trans-Blot Turbo Transfer System (Bio-Rad). Membranes were blocked with 10% (w/v) nonfat dry milk (Bio-Rad) in TBS-T and stained with primary antibodies diluted in TBS-T followed by HRP-conjugated secondary antibodies or Protein A diluted in TBS-T. Membranes were developed using Luminata Forte ECL detection system (Millipore) and signals were captured on an ImageQuant LAS 4000 system (GE Healthcare Life Sciences). Images were quantified with the Multi Gauge Analysis software (Fujifilm). Membrane stripping for probing additional antigens was done using Re-Blot Plus Strong Solution (Millipore) following the manufacturer's instructions or in 2% SDS, 62.5 mm Tris, 100 mm β-mercaptoethanol, pH 6.7, at 55 °C for 20 min.
RNA extraction and RT-qPCR
Cells were plated at 70–80% confluence. Once attached they were induced for the expression of the model protein using media containing 100 ng/ml of tetracycline (tet), treated with UPR-inducing drugs or mock (ethanol and DMSO, respectively). After 17 h total RNA was extracted using a GenEluteTM Mammalian Total RNA Miniprep Kit (Sigma) following the manufacturer's instructions.
cDNA was synthesized using SuperScript II RT (Invitrogen) and oligo(dT) (Invitrogen) following the manufacturer's instructions starting with 4 μg of total RNA. qPCRs on these samples was done using BioToolTM 2× SYBR Green qPCR master mix (BioTool) following the manufacturer's instructions. Briefly, 5 μl of cDNA were mixed with 10 μl of SYBR Green master mix, 3.6 μl of H2O, and 0.4 μl of reference ROX dye. This mixture was added to the plate and 1 μl of primer mixture (10 μm each, see Table 1 for sequences) was pipetted. qPCRs were run on a 7900HT Fast Real-Time PCR System (Applied Biosystems) or a QuantStudio3 (Applied Biosystems). Data analysis was performed with SDS 2.4 software (Applied Biosystems) or the QuantStudio Design and Analysis Software (Applied Biosystems). Statistical significance was assessed using the Prism (GraphPad Software) statistical test as described in the figure legends.
Table 1.
Antibodies used for Western blots and immunoprecipitations in this study
| Antibody | Species of origin | Used dilution | Supplier | Catalog number |
|---|---|---|---|---|
| Anti-HA | Rabbit | 1:3,000 | Sigma | H6908 |
| Anti-KDEL (10C3) | Mouse | 1:600 | Stressgen | ADI-SPA-827 |
| Anti-HERP | Rabbit | 1:1,000 | K. Kokame | NAa |
| Anti-rabbit HRP | Goat | 1:20,000 | BioRad | 170-6515 |
| Anti-mouse HRP | Goat | 1:20,000 | SouthernBiotech | 1050-05 |
a NA, not applicable.
Cell viability assays
For counting living cells, after the respective treatments cells were washed in PBS and detached with trypsin/EDTA. Cells were resuspended in media and living cells were counted with trypan blue on a TC20TM Cell Counter (Bio-Rad).
For monitoring cell growth over more days, 300,000/well cells were plated in a 12-well plate or 100,000 in a 24-well plate and induced, mock or drug treated. Living cells were counted as described above after 17, 41, and 65 h.
Gene expression profiling
Total RNA was extracted as described above. Gene expression profile analysis was performed using Illumina HumanHT-12 v4 Expression BeadChip, as previously described (65). The data were analyzed with Genomic Suite (Partek). Statistical significance was assessed by t tests (p < 0.05) and with fold-change greater than 1.2 or smaller than 0.8. Heat maps and hierarchical clustering were computed with MORPHEUS software (software.broadinstitute.org/morpheus/).3
Cell lysis, tryptic digestion, C-18 clean-up, and LFQ-MS
Cells were plated on 3.5-cm dishes at 70–80% confluence. Once attached they were induced for the expression of the model protein using media, 100 ng/ml of tetracycline (tet), treated with UPR-inducing drugs or mock (ethanol and DMSO, respectively). After 17 h cells were lysed in 8 m urea in 0.1 m NH4HCO3, followed by sonication to shear genomic DNA. Total protein content was measured using a PierceTM BCA protein Assay Kit (Thermo Scientific) following the manufacturer's instructions.
A total of 50 μg of proteins were reduced with 10 mm DTT and alkylated with 40 nm iodoacetamide. A first digestion was performed with Lys-C (WAKO), then samples were diluted to 2 m urea and digested with sequencing grade trypsin (Promega). Peptide samples were cleaned by MacroSpin C18 silica columns (The Nest Group), evaporated to dryness, and resolubilized in 0.1% formic acid for HPLC-MS analysis on a Q Exactive Plus with a 2-h gradient. Data were analyzed with MaxQuant (66) and Perseus (67) (Computational Systems Biochemistry). Statistical significance was assessed by t test (p < 0.05) and with the fold-change greater than 1.2 or smaller than 0.8 based on LFQ values. Protein interactions were analyzed using STRING (https://string-db.org) (69).3
Antibodies
Rabbit α-HA tag antibody was purchased from Sigma and used at 1:3000, mouse α-KDEL (SPA827) was purchased from Stressgen and used at 1:600, rabbit α-HERP was a kind gift of K. Kokame and used at 1:1000. HRP-conjugated secondary antibodies against rabbit and mouse were purchased from Bio-Rad and SouthernBiotech, respectively, and used at 1:20,000 (Table 1).
qPCR primers
Primers were ordered from Microsynth AG and used at a final concentration of 10 μm (Table 2).
Table 2.
Primer sequences used for RT-qPCR
| Target | Forward primer (5′-3′) | Reverse primer (5′-3′) |
|---|---|---|
| ACTIN | CTTCCTGGGCATGGAGTCCT | GGAGCAATGATCTTGATC |
| ARMET | ATCGGTTGTGCTACTATA | CTCGGAGCTTCTCAGGT |
| ATF3 | TCGGACAAGCTGGAAAGT | TCTGGAGTCCTCCCATTCTG |
| CALR | CCTGGCACCAAGAAGGTT | CCATCTCTTCATCCCAGTCCT |
| CANX | CCAAGCATCATGCCATCTCT | TTGGTCTTTCATCCCAATCC |
| CHOP | CTCTCCAGATTCGACTCAGAGC | CTCGATTTCCTGCTTGAGCC |
| CREDL2 | ACAGCCTGTGACGAGTCCTGC | CTCGTCCACATCCACACAGGCG |
| DNAJB11 | GGTGATTGCCGGACGAGATT | GGATCATCAGGGTTCCGGTC |
| EDEM1 | AAGATTCCACCGTCCAAGTC | GTATCATTGCTCCGGAGGTT |
| HERPUD1 | CCGGTTACACACCCTATGGG | TGAGGAGCAGCATTCTGATTG |
| HSP90B1 | CTGGGACTGGGAACTTATGAATG | TCCATATTCGTCAAACAGACCAC |
| HSPA5 | GAGTTCTTCAATGGCAAGGA | CCAGTCAGATCAAATGTACCC |
| HYOU1 | GCAGACCTGTTGGCACTG | TCACGATCACCGGTGTTT |
| PDIA4 | ATCGGGGTCTTTAAGGGGGA | CTCTCAGGTTGTTAGCGGCA |
| PDIA6 | TCCTGCCCACTCCCTATCAA | CACCAGACCGGGTGCATTAG |
| SDF2L1 | GTCCAACAACCAGGAGGTGAG | GGATGGGGCTTCCATACTGC |
| TRIB3 | AAGCGGTTGGAGTTGGATGAC | CACGATCTGGAGCAGTAGGTG |
| WARS | AGCACCTACCAGTAATCA | TCCAAACCGAACAATGAG |
| XBP1s | CTGAGTCCGCAGCAGGTG | TGGCTGGATGAAAGCAGATT |
Statistical analysis
Statistical analysis was performed using Prism (GraphPad software). The tests used for determining statistical significance are elucidated in the figure legends. For GEP data analysis the Genomic Suite® (Partek) was used (see above). For MS data, Perseus (Computational Systems Biochemistry) was used for statistical analysis (see above).
Author contributions
T. J. B., I. F., A. R., F. B., and P. J. B. data curation; T. J. B., I. F., F. F., A. R., and P. J. B. formal analysis; T. J. B., A. R., F. B., P. J. B., P. P., and M. M. methodology; T. J. B. and M. M. writing-original draft; A. R., F. B., P. J. B., and P. P. resources; A. R. validation; M. M. conceptualization; M. M. supervision; M. M. funding acquisition; M. M. project administration.
Supplementary Material
Acknowledgments
We thank K. Kokame for sharing reagents. For insightful discussions we thank Paolo Paganetti, Fulvio Reggiori, Eelco van Anken, Randy Kaufman, and Jeff Brodsky.
This work was supported in part by grants from Signora Alessandra, AlphaONE Foundation, Foundation for Research on Neurodegenerative Diseases, the Novartis Foundation, Swiss National Science Foundation (SNF), and Comel and Gelu Foundations (to M. M.). The authors declare that they have no conflicts of interest with the contents of this article.
This article contains Figs. S1–S4 and Tables S1–S5.
Gene expression data have been deposited to the GEO genomics data repository with the accession number GSE108346.
The mass spectrometry proteomics data have been deposited to the ProteomeXchange Consortium via the PRIDE partner repository with the dataset identifier PXD008529.
Please note that the JBC is not responsible for the long-term archiving and maintenance of this site or any other third party hosted site.
- ER
- endoplasmic reticulum
- UPR
- unfolded protein response
- TM
- tunicamycin
- TG
- thapsigargin
- GEP
- gene expression profiling
- qRT
- quantitative RT-PCR
- LFQ
- label-free quantification shotgun
- HRP
- horseradish peroxidase
- HA
- hemagglutinin
- ERAD
- endoplasmic reticulum-associated degradation
- PDI
- protein disulfide isomerase
- DMEM
- Dulbecco's modified Eagle's medium
- ANOVA
- analysis of variance.
References
- 1. Uhlén M., Fagerberg L., Hallström B. M., Lindskog C., Oksvold P., Mardinoglu A., Sivertsson Å., Kampf C., Sjöstedt E., Asplund A., Olsson I., Edlund K., Lundberg E., Navani S., Szigyarto C. A., et al. (2015) Proteomics: tissue-based map of the human proteome. Science 347, 1260419 10.1126/science.1260419 [DOI] [PubMed] [Google Scholar]
- 2. Martinon F., and Aksentijevich I. (2015) New players driving inflammation in monogenic autoinflammatory diseases. Nat. Rev. Rheumatology 11, 11–20 10.1038/nrrheum.2014.158 [DOI] [PubMed] [Google Scholar]
- 3. Taylor R. C., Berendzen K. M., and Dillin A. (2014) Systemic stress signalling: understanding the cell non-autonomous control of proteostasis. Nat. Rev. Mol. Cell Biol. 15, 211–217 10.1038/nrm3752 [DOI] [PMC free article] [PubMed] [Google Scholar]
- 4. Rao R. V., and Bredesen D. E. (2004) Misfolded proteins, endoplasmic reticulum stress and neurodegeneration. Curr. Opin. Cell Biol. 16, 653–662 10.1016/j.ceb.2004.09.012 [DOI] [PMC free article] [PubMed] [Google Scholar]
- 5. Hetz C., Chevet E., and Oakes S. A. (2015) Proteostasis control by the unfolded protein response. Nat. Cell Biol. 17, 829–838 10.1038/ncb3184 [DOI] [PMC free article] [PubMed] [Google Scholar]
- 6. Walter P., and Ron D. (2011) The unfolded protein response: from stress pathway to homeostatic regulation. Science 334, 1081–1086 10.1126/science.1209038 [DOI] [PubMed] [Google Scholar]
- 7. Wang M., and Kaufman R. J. (2016) Protein misfolding in the endoplasmic reticulum as a conduit to human disease. Nature 529, 326–335 10.1038/nature17041 [DOI] [PubMed] [Google Scholar]
- 8. Tabas I., and Ron D. (2011) Integrating the mechanisms of apoptosis induced by endoplasmic reticulum stress. Nat. Cell Biol. 13, 184–190 10.1038/ncb0311-184 [DOI] [PMC free article] [PubMed] [Google Scholar]
- 9. Oslowski C. M., and Urano F. (2011) Measuring ER stress and the unfolded protein response using mammalian tissue culture system. Methods Enzymol. 490, 71–92 10.1016/B978-0-12-385114-7.00004-0 [DOI] [PMC free article] [PubMed] [Google Scholar]
- 10. Travers K. J., Patil C. K., Wodicka L., Lockhart D. J., Weissman J. S., and Walter P. (2000) Functional and genomic analyses reveal an essential coordination between the unfolded protein response and ER-associated degradation. Cell 101, 249–258 10.1016/S0092-8674(00)80835-1 [DOI] [PubMed] [Google Scholar]
- 11. Adachi Y., Yamamoto K., Okada T., Yoshida H., Harada A., and Mori K. (2008) ATF6 is a transcription factor specializing in the regulation of quality control proteins in the endoplasmic reticulum. Cell Struct. Funct. 33, 75–89 10.1247/csf.07044 [DOI] [PubMed] [Google Scholar]
- 12. Adamson B., Norman T. M., Jost M., Cho M. Y., Nuñez J. K., Chen Y., Villalta J. E., Gilbert L. A., Horlbeck M. A., Hein M. Y., Pak R. A., Gray A. N., Gross C. A., Dixit A., Parnas O., Regev A., and Weissman J. S. (2016) A multiplexed single-cell CRISPR screening platform enables systematic dissection of the unfolded protein response. Cell 167, 1867–1882.e21 10.1016/j.cell.2016.11.048 [DOI] [PMC free article] [PubMed] [Google Scholar]
- 13. B'Chir W., Maurin A. C., Carraro V., Averous J., Jousse C., Muranishi Y., Parry L., Stepien G., Fafournoux P., and Bruhat A. (2013) The eIF2α/ATF4 pathway is essential for stress-induced autophagy gene expression. Nucleic Acids Res. 41, 7683–7699 10.1093/nar/gkt563 [DOI] [PMC free article] [PubMed] [Google Scholar]
- 14. Han J., Back S. H., Hur J., Lin Y. H., Gildersleeve R., Shan J., Yuan C. L., Krokowski D., Wang S., Hatzoglou M., Kilberg M. S., Sartor M. A., and Kaufman R. J. (2013) ER-stress-induced transcriptional regulation increases protein synthesis leading to cell death. Nat. Cell Biol. 15, 481–490 10.1038/ncb2738 [DOI] [PMC free article] [PubMed] [Google Scholar]
- 15. Lee A. H., Iwakoshi N. N., and Glimcher L. H. (2003) XBP-1 regulates a subset of endoplasmic reticulum resident chaperone genes in the unfolded protein response. Mol. Cell. Biol. 23, 7448–7459 10.1128/MCB.23.21.7448-7459.2003 [DOI] [PMC free article] [PubMed] [Google Scholar]
- 16. Oikawa T., Unno Y., Matsuno K., Sawada J., Ogo N., Tanaka K., and Asai A. (2010) Identification of a small-molecule inhibitor of the interaction between Survivin and Smac/DIABLO. Biochem. Biophys. Res. Commun. 393, 253–258 10.1016/j.bbrc.2010.01.113 [DOI] [PubMed] [Google Scholar]
- 17. Shoulders M. D., Ryno L. M., Genereux J. C., Moresco J. J., Tu P. G., Wu C., Yates J. R. 3rd, Su A. I., Kelly J. W., and Wiseman R. L. (2013) Stress-independent activation of XBP1s and/or ATF6 reveals three functionally diverse ER proteostasis environments. Cell Rep. 3, 1279–1292 10.1016/j.celrep.2013.03.024 [DOI] [PMC free article] [PubMed] [Google Scholar]
- 18. Fribley A., Zhang K., and Kaufman R. J. (2009) Regulation of apoptosis by the unfolded protein response. Methods Mol. Biol. 559, 191–204 10.1007/978-1-60327-017-5_14 [DOI] [PMC free article] [PubMed] [Google Scholar]
- 19. Brown H. C., Gangadharan B., and Doering C. B. (2011) Enhanced biosynthesis of coagulation factor VIII through diminished engagement of the unfolded protein response. J. Biol. Chem. 286, 24451–24457 10.1074/jbc.M111.238758 [DOI] [PMC free article] [PubMed] [Google Scholar]
- 20. Raina K., Noblin D. J., Serebrenik Y. V., Adams A., Zhao C., and Crews C. M. (2014) Targeted protein destabilization reveals an estrogen-mediated ER stress response. Nat. Chem. Biol. 10, 957–962 10.1038/nchembio.1638 [DOI] [PMC free article] [PubMed] [Google Scholar]
- 21. Lawless M. W., Greene C. M., Mulgrew A., Taggart C. C., O'Neill S. J., and McElvaney N. G. (2004) Activation of endoplasmic reticulum-specific stress responses associated with the conformational disease Z α1-antitrypsin deficiency. J. Immunol. 172, 5722–5726 10.4049/jimmunol.172.9.5722 [DOI] [PubMed] [Google Scholar]
- 22. Hidvegi T., Schmidt B. Z., Hale P., and Perlmutter D. H. (2005) Accumulation of mutant α1-antitrypsin Z in the endoplasmic reticulum activates caspases-4 and -12, NFκB, and BAP31 but not the unfolded protein response. J. Biol. Chem. 280, 39002–39015 10.1074/jbc.M508652200 [DOI] [PubMed] [Google Scholar]
- 23. Oh Y. K., Shin K. S., Yuan J., and Kang S. J. (2008) Superoxide dismutase 1 mutants related to amyotrophic lateral sclerosis induce endoplasmic stress in neuro2a cells. J. Neurochem. 104, 993–1005 10.1111/j.1471-4159.2007.05053.x [DOI] [PubMed] [Google Scholar]
- 24. Mori A., Yamashita S., Uchino K., Suga T., Ikeda T., Takamatsu K., Ishizaki M., Koide T., Kimura E., Mita S., Maeda Y., Hirano T., and Uchino M. (2011) Derlin-1 overexpression ameliorates mutant SOD1-induced endoplasmic reticulum stress by reducing mutant SOD1 accumulation. Neurochem. Int. 58, 344–353 10.1016/j.neuint.2010.12.010 [DOI] [PubMed] [Google Scholar]
- 25. Koritzinsky M., Levitin F., van den Beucken T., Rumantir R. A., Harding N. J., Chu K. C., Boutros P. C., Braakman I., and Wouters B. G. (2013) Two phases of disulfide bond formation have differing requirements for oxygen. J. Cell Biol. 203, 615–627 10.1083/jcb.201307185 [DOI] [PMC free article] [PubMed] [Google Scholar]
- 26. Cox J., Hein M. Y., Luber C. A., Paron I., Nagaraj N., and Mann M. (2014) Accurate proteome-wide label-free quantification by delayed normalization and maximal peptide ratio extraction, termed MaxLFQ. Mol. Cell. Proteomics 13, 2513–2526 [DOI] [PMC free article] [PubMed] [Google Scholar]
- 27. Molinari M., Galli C., Piccaluga V., Pieren M., and Paganetti P. (2002) Sequential assistance of molecular chaperones and transient formation of covalent complexes during protein degradation from the ER. J. Cell Biol. 158, 247–257 10.1083/jcb.200204122 [DOI] [PMC free article] [PubMed] [Google Scholar]
- 28. Yang M., Omura S., Bonifacino J. S., and Weissman A. M. (1998) Novel aspects of degradation of T cell receptor subunits from the endoplasmic reticulum (ER) in T cells: importance of oligosaccharide processing, ubiquitination, and proteasome-dependent removal from ER membranes. J. Exp. Med. 187, 835–846 10.1084/jem.187.6.835 [DOI] [PMC free article] [PubMed] [Google Scholar]
- 29. Merulla J., Soldà T., and Molinari M. (2015) A novel UGGT1 and p97-dependent checkpoint for native ectodomains with ionizable intramembrane residue. Mol. Biol. Cell 26, 1532–1542 10.1091/mbc.E14-12-1615 [DOI] [PMC free article] [PubMed] [Google Scholar]
- 30. Karagöz G. E., Acosta-Alvear D., Nguyen H. T., Lee C. P., Chu F., and Walter P. (2017) An unfolded protein-induced conformational switch activates mammalian IRE1. eLife 6, e30700 [DOI] [PMC free article] [PubMed] [Google Scholar]
- 31. Credle J. J., Finer-Moore J. S., Papa F. R., Stroud R. M., and Walter P. (2005) On the mechanism of sensing unfolded protein in the endoplasmic reticulum. Proc. Natl. Acad. Sci. U.S.A. 102, 18773–18784 10.1073/pnas.0509487102 [DOI] [PMC free article] [PubMed] [Google Scholar]
- 32. Gardner B. M., and Walter P. (2011) Unfolded proteins are Ire1-activating ligands that directly induce the unfolded protein response. Science 333, 1891–1894 10.1126/science.1209126 [DOI] [PMC free article] [PubMed] [Google Scholar]
- 33. Promlek T., Ishiwata-Kimata Y., Shido M., Sakuramoto M., Kohno K., and Kimata Y. (2011) Membrane aberrancy and unfolded proteins activate the endoplasmic reticulum stress sensor Ire1 in different ways. Mol. Biol. Cell 22, 3520–3532 10.1091/mbc.E11-04-0295 [DOI] [PMC free article] [PubMed] [Google Scholar]
- 34. Liu C. Y., Schröder M., and Kaufman R. J. (2000) Ligand-independent dimerization activates the stress response kinases IRE1 and PERK in the lumen of the endoplasmic reticulum. J. Biol. Chem. 275, 24881–24885 10.1074/jbc.M004454200 [DOI] [PubMed] [Google Scholar]
- 35. Carrara M., Prischi F., Nowak P. R., Kopp M. C., and Ali M. M. (2015) Noncanonical binding of BiP ATPase domain to Ire1 and Perk is dissociated by unfolded protein CH1 to initiate ER stress signaling. eLife 4, e03522 [DOI] [PMC free article] [PubMed] [Google Scholar]
- 36. Bertolotti A., Zhang Y., Hendershot L. M., Harding H. P., and Ron D. (2000) Dynamic interaction of BiP and ER stress transducers in the unfolded-protein response. Nat. Cell Biol. 2, 326–332 10.1038/35014014 [DOI] [PubMed] [Google Scholar]
- 37. Pincus D., Chevalier M. W., Aragón T., van Anken E., Vidal S. E., El-Samad H., and Walter P. (2010) BiP binding to the ER-stress sensor Ire1 tunes the homeostatic behavior of the unfolded protein response. PLoS Biol. 8, e1000415 10.1371/journal.pbio.1000415 [DOI] [PMC free article] [PubMed] [Google Scholar]
- 38. Sou S. N., Ilieva K. M., and Polizzi K. M. (2012) Binding of human BiP to the ER stress transducers IRE1 and PERK requires ATP. Biochem. Biophys. Res. Commun. 420, 473–478 10.1016/j.bbrc.2012.03.030 [DOI] [PubMed] [Google Scholar]
- 39. Shen J., Chen X., Hendershot L., and Prywes R. (2002) ER stress regulation of ATF6 localization by dissociation of BiP/GRP78 binding and unmasking of Golgi localization signals. Dev. Cell 3, 99–111 10.1016/S1534-5807(02)00203-4 [DOI] [PubMed] [Google Scholar]
- 40. Okamura K., Kimata Y., Higashio H., Tsuru A., and Kohno K. (2000) Dissociation of Kar2p/BiP from an ER sensory molecule, Ire1p, triggers the unfolded protein response in yeast. Biochem. Biophys. Res. Commun. 279, 445–450 10.1006/bbrc.2000.3987 [DOI] [PubMed] [Google Scholar]
- 41. Kopp M. C., Nowak P. R., Larburu N., Adams C. J., and Ali M. M. (2018) In vitro FRET analysis of IRE1 and BiP association and dissociation upon endoplasmic reticulum stress. eLife 7, e30257 [DOI] [PMC free article] [PubMed] [Google Scholar]
- 42. Molinari M., and Helenius A. (2000) Chaperone selection during glycoprotein translocation into the endoplasmic reticulum. Science 288, 331–333 10.1126/science.288.5464.331 [DOI] [PubMed] [Google Scholar]
- 43. Tkacz J. S., and Lampen O. (1975) Tunicamycin inhibition of polyisoprenyl N-acetylglucosaminyl pyrophosphate formation in calf-liver microsomes. Biochem. Biophys. Res. Commun. 65, 248–257 10.1016/S0006-291X(75)80086-6 [DOI] [PubMed] [Google Scholar]
- 44. Canová N. K., Kmonicková E., Martínek J., Zídek Z., and Farghali H. (2007) Thapsigargin, a selective inhibitor of sarco-endoplasmic reticulum Ca2+-ATPases, modulates nitric oxide production and cell death of primary rat hepatocytes in culture. Cell Biol. Toxicol. 23, 337–354 10.1007/s10565-007-0185-6 [DOI] [PubMed] [Google Scholar]
- 45. Tatu U., Braakman I., and Helenius A. (1993) Membrane glycoprotein folding, oligomerization and intracellular transport: effects of dithiothreitol in living cells. EMBO J. 12, 2151–2157 [DOI] [PMC free article] [PubMed] [Google Scholar]
- 46. Lee K., Tirasophon W., Shen X., Michalak M., Prywes R., Okada T., Yoshida H., Mori K., and Kaufman R. J. (2002) IRE1-mediated unconventional mRNA splicing and S2P-mediated ATF6 cleavage merge to regulate XBP1 in signaling the unfolded protein response. Genes Dev. 16, 452–466 10.1101/gad.964702 [DOI] [PMC free article] [PubMed] [Google Scholar]
- 47. Lin J. H., Li H., Zhang Y., Ron D., and Walter P. (2009) Divergent effects of PERK and IRE1 signaling on cell viability. PloS One 4, e4170 10.1371/journal.pone.0004170 [DOI] [PMC free article] [PubMed] [Google Scholar]
- 48. Meunier L., Usherwood Y. K., Chung K. T., and Hendershot L. M. (2002) A subset of chaperones and folding enzymes form multiprotein complexes in endoplasmic reticulum to bind nascent proteins. Mol. Biol. Cell 13, 4456–4469 10.1091/mbc.E02-05-0311 [DOI] [PMC free article] [PubMed] [Google Scholar]
- 49. Hartley C. L., Edwards S., Mullan L., Bell P. A., Fresquet M., Boot-Handford R. P., and Briggs M. D. (2013) Armet/Manf and Creld2 are components of a specialized ER stress response provoked by inappropriate formation of disulphide bonds: implications for genetic skeletal diseases. Hum. Mol. Genet. 22, 5262–5275 10.1093/hmg/ddt383 [DOI] [PMC free article] [PubMed] [Google Scholar]
- 50. Maurel M., Chevet E., Tavernier J., and Gerlo S. (2014) Getting RIDD of RNA: IRE1 in cell fate regulation. Trends Biochem. Sci. 10.1016/j.tibs.2014.02.008 [DOI] [PubMed] [Google Scholar]
- 51. Thibault G., Ismail N., and Ng D. T. (2011) The unfolded protein response supports cellular robustness as a broad-spectrum compensatory pathway. Proc. Natl. Acad. Sci. U.S.A. 108, 20597–20602 10.1073/pnas.1117184109 [DOI] [PMC free article] [PubMed] [Google Scholar]
- 52. Schröder M., and Kaufman R. J. (2005) The mammalian unfolded protein response. Annu. Rev. Biochem. 74, 739–789 10.1146/annurev.biochem.73.011303.074134 [DOI] [PubMed] [Google Scholar]
- 53. Ni M., and Lee A. S. (2007) ER chaperones in mammalian development and human diseases. FEBS Lett. 581, 3641–3651 10.1016/j.febslet.2007.04.045 [DOI] [PMC free article] [PubMed] [Google Scholar]
- 54. Fujimori T., Suno R., Iemura S. I., Natsume T., Wada I., and Hosokawa N. (2017) Endoplasmic reticulum proteins SDF2 and SDF2L1 act as components of the BiP chaperone cycle to prevent protein aggregation. Genes Cells 22, 684–698 10.1111/gtc.12506 [DOI] [PubMed] [Google Scholar]
- 55. Chen K. C., Qu S., Chowdhury S., Noxon I. C., Schonhoft J. D., Plate L., Powers E. T., Kelly J. W., Lander G. C., and Wiseman R. L. (2017) The endoplasmic reticulum HSP40 co-chaperone ERdj3/DNAJB11 assembles and functions as a tetramer. EMBO J. 36, 2296–2309 10.15252/embj.201695616 [DOI] [PMC free article] [PubMed] [Google Scholar]
- 56. Leitman J., Shenkman M., Gofman Y., Shtern N. O., Ben-Tal N., Hendershot L. M., and Lederkremer G. Z. (2014) Herp coordinates compartmentalization and recruitment of HRD1 and misfolded proteins for ERAD. Mol. Biol. Cell 25, 1050–1060 10.1091/mbc.E13-06-0350 [DOI] [PMC free article] [PubMed] [Google Scholar]
- 57. Pisoni G. B., and Molinari M. (2016) Five questions (with their answers) on ER-associated degradation. Traffic 17, 341–350 10.1111/tra.12373 [DOI] [PubMed] [Google Scholar]
- 58. Apostolou A., Shen Y., Liang Y., Luo J., and Fang S. (2008) Armet, a UPR-upregulated protein, inhibits cell proliferation and ER stress-induced cell death. Exp. Cell Res. 314, 2454–2467 10.1016/j.yexcr.2008.05.001 [DOI] [PMC free article] [PubMed] [Google Scholar]
- 59. Wang S., and Kaufman R. J. (2012) The impact of the unfolded protein response on human disease. J. Cell Biol. 197, 857–867 10.1083/jcb.201110131 [DOI] [PMC free article] [PubMed] [Google Scholar]
- 60. Preissler S., Rato C., Chen R., Antrobus R., Ding S., Fearnley I. M., and Ron D. (2015) AMPylation matches BiP activity to client protein load in the endoplasmic reticulum. eLife 4, e12621 [DOI] [PMC free article] [PubMed] [Google Scholar]
- 61. Preissler S., Rohland L., Yan Y., Chen R., Read R. J., and Ron D. (2017) AMPylation targets the rate-limiting step of BiP's ATPase cycle for its functional inactivation. eLife 6, e29428 [DOI] [PMC free article] [PubMed] [Google Scholar]
- 62. Lynes E. M., Raturi A., Shenkman M., Ortiz Sandoval C., Yap M. C., Wu J., Janowicz A., Myhill N., Benson M. D., Campbell R. E., Berthiaume L. G., Lederkremer G. Z., and Simmen T. (2013) Palmitoylation is the switch that assigns calnexin to quality control or ER Ca2+ signaling. J. Cell Sci. 126, 3893–3903 10.1242/jcs.125856 [DOI] [PubMed] [Google Scholar]
- 63. Hagiwara M., Ling J., Koenig P. A., and Ploegh H. L. (2016) Posttranscriptional regulation of glycoprotein quality control in the endoplasmic reticulum is controlled by the E2 Ub-conjugating enzyme UBC6e. Mol. cell 63, 753–767 10.1016/j.molcel.2016.07.014 [DOI] [PMC free article] [PubMed] [Google Scholar]
- 64. Bernasconi R., and Molinari M. (2011) ERAD and ERAD tuning: disposal of cargo and of ERAD regulators from the mammalian ER. Curr. Opin. Cell Biol. 23, 176–183 10.1016/j.ceb.2010.10.002 [DOI] [PMC free article] [PubMed] [Google Scholar]
- 65. Bonetti P., Testoni M., Scandurra M., Ponzoni M., Piva R., Mensah A. A., Rinaldi A., Kwee I., Tibiletti M. G., Iqbal J., Greiner T. C., Chan W. C., Gaidano G., Piris M. A., Cavalli F., et al. (2013) Deregulation of ETS1 and FLI1 contributes to the pathogenesis of diffuse large B-cell lymphoma. Blood 122, 2233–2241 10.1182/blood-2013-01-475772 [DOI] [PubMed] [Google Scholar]
- 66. Tyanova S., Temu T., and Cox J. (2016) The MaxQuant computational platform for mass spectrometry-based shotgun proteomics. Nat. Protocols 11, 2301–2319 10.1038/nprot.2016.136 [DOI] [PubMed] [Google Scholar]
- 67. Tyanova S., Temu T., Sinitcyn P., Carlson A., Hein M. Y., Geiger T., Mann M., and Cox J. (2016) The Perseus computational platform for comprehensive analysis of (prote)omics data. Nat. Methods 13, 731–740 10.1038/nmeth.3901 [DOI] [PubMed] [Google Scholar]
- 68. Clèries R., Galvez J., Espino M., Ribes J., Nunes V., and de Heredia M. L. (2012) BootstRatio: a web-based statistical analysis of fold-change in qPCR and RT-qPCR data using resampling methods. Comp. Biol. Med. 42, 438–445 10.1016/j.compbiomed.2011.12.012 [DOI] [PubMed] [Google Scholar]
- 69. Szklarczyk D., Franceschini A., Kuhn M., Simonovic M., Roth A., Minguez P., Doerks T., Stark M., Muller J., Bork P., Jensen L. J., and von Mering C. (2011) The STRING database in 2011: functional interaction networks of proteins, globally integrated and scored. Nucleic Acids Res. 39, D561–D568 10.1093/nar/gkq973 [DOI] [PMC free article] [PubMed] [Google Scholar]
Associated Data
This section collects any data citations, data availability statements, or supplementary materials included in this article.