

Abstract
Neurturin (NRTN) provides trophic support to neurons and is considered a therapeutic agent for neurodegenerative diseases, such as Parkinson's disease. It binds to its co-receptor GFRa2, and the resulting NRTN–GFRa2 complex activates the transmembrane receptors rearranged during transfection (RET) or the neural cell adhesion molecule (NCAM). We report the crystal structure of NRTN, alone and in complex with GFRa2. This is the first crystal structure of a GFRa with all three domains and shows that domain 1 does not interact directly with NRTN, but it may support an interaction with RET and/or NCAM, via a highly conserved surface. In addition, biophysical results show that the relative concentration of GFRa2 on cell surfaces can affect the functional affinity of NRTN through avidity effects. We have identified a heparan sulfate-binding site on NRTN and a putative binding site in GFRa2, suggesting that heparan sulfate has a role in the assembly of the signaling complex. We further show that mutant NRTN with reduced affinity for heparan sulfate may provide a route forward for delivery of NRTN with increased exposure in preclinical in vivo models and ultimately to Parkinson's patients.
Keywords: crystallography, heparan sulfate, heparin, surface plasmon resonance (SPR), cell signaling, avidity, GDNF, GFRa, glial cell-derived neurotrophic factor, RET
Introduction
Neurotrophic factors are proteins that mediate growth and survival of neurons both during development and in the adult organism (1). Neurturin (NRTN)3 (2) belongs to a subclass of neurotrophic factors, the GDNF family of ligands (GFL). GFLs are released by target tissues to stimulate the growth of axons and have been shown to be capable of re-growing damaged neurons both in vitro and in animal models (4, 5). For this reason, NRTN and other GFLs have been indicated as protein therapeutics for a number of neurodegenerative diseases, and NRTN has been assessed in clinical trials as a treatment for Parkinson's disease (3). There are four different GFLs known: glial cell-derived neurotrophic factor (GDNF) (6); NRTN; artemin (ARTN) (7); and persephin (8), each binding to a preferred membrane-anchored GDNF family receptor α (GFRa) (1, 9). GDNF signals through GFRa1, NRTN through GFRa2, ARTN through GFRa3 (7), and persephin through GFRa4 (10), even though a certain cross-activity has been described (11, 12). In addition, very recently several groups identified GFRa-like (GFRAL), a distant member of the receptor family, as the co-receptor for GDF15 (growth and differentiation factor 15), and the complex was shown to signal through RET analogously to conventional GFRas (13–16). Other GFLs, however, do not compete for GFRAL binding, and GDF15 does not bind to GFRa1–4.
The NRTN–GFRa2 protein complex (17) activates the signal-transducing transmembrane receptors rearranged during transfection (RET) (9, 18–20) or neural cell adhesion molecule (NCAM), thereby trigger cellular responses leading to improved cell survival, differentiation, and growth (21).
Besides their ability to bind to GFRa receptors, GDNF, NRTN, and ARTN have been shown to bind the sulfated polysaccharide heparin (22–24) and the related molecule heparan sulfate (HS) (25–27). Unbranched HS are presented by glycoproteins expressed on cell surfaces and in the extracellular matrix (ECM) where they increase the local concentration of various HS-binding molecules by tethering. NRTN and GDNF have been tested as treatments in phase 1 and 2 clinical trials for Parkinson's disease but failed to show efficacy in the phase 2 clinical trials (Ref. 3 and recently reviewed in Kirik et al. (28) and Bartus and Johnson (29)). There are, however, indications that this may be due to limited exposure caused by the binding of NRTN and GDNF to HS displayed by proteoglycans in the ECM and on cell surfaces (30, 31).
NRTN-induced signaling has been shown to provide trophic support to neurons (5) and is especially important in guiding the development and distribution of parasympathetic, sensory, and enteric innervations (32). The effects on cell survival have also indicated the potential of NRTN in the treatment of asthma (33) and, recently, in diabetes, as it has been shown to prevent the development of hyperglycemia and increase β-cell mass in diabetic rats (34).
Despite the therapeutic relevance of NRTN and other members of the GDNF protein family, it is still not clear how the receptor complexes are formed, how selectivity between the co-receptors is achieved, and how RET is activated. A better understanding of the signaling receptor complex(es) would aid our biological understanding and potentially open up new opportunities for large or small molecule treatments within a broad range of human diseases.
To gain insight into the receptor complex formation, we determined the first crystal structures of full-length GFRa2 with its domains 1–3 in complex with NRTN and NRTN alone at high resolution. This is the first GFRa–GFL crystal structure containing GFRa domain 1, providing structural evidence that domain 1 is not involved in GFL binding. Sequence and structure comparisons showed that the interaction surfaces between the different domains of GFRa receptors and between GFRa and GFLs are conserved. We also identified the HS-binding site in NRTN and found four arginine/glutamine residues involved in specific HS binding by site-directed mutagenesis. Another putative HS-binding site was identified on GFRa2. Furthermore, biophysical characterization of the interaction between NRTN and GFRa2 showed receptor avidity effects, suggesting that the GFRa2 receptor concentration on the cell surface will affect the functional affinity of the interaction.
We demonstrate in vivo that mutation of HS-coordinating residues leads to improved pharmacokinetic (PK) properties of NRTN, in terms of increased exposure, decreased clearance, and decreased volume of distribution. These alterations could enable the use of NRTN as a protein therapeutic in neurodegenerative diseases.
Results
Structure of NRTN alone and in complex with full-length GFRa2
The structure of mature human NRTN (residues 97–197) was determined to a resolution of 1.6 Å and showed an elongated homodimer with a bundle of disulfide bridges at the center forming a cysteine knot (Fig. 1A). Two NRTN monomers were arranged head-to-tail, with a large buried inter-subunit surface of 2100 Å2 (Fig. 1A), and were also connected by a disulfide bridge between Cys-164 from each subunit. NRTN contains a large number of arginine residues, which make up almost a fifth of the mature protein. All of these were observed to be surface-exposed, with the exception of Arg-166 that is buried in the center of the protein and forms a bi-dentate binding to the C terminus of the other subunit, thereby further locking the two subunits together (Fig. 1A). Interestingly, the structure revealed a striking electrostatic polarity of the NRTN homodimer with a highly positively charged patch at the concave surface and a negatively charged region at the convex side of the molecule (Fig. 1B and Fig. S1). Although ARTN displays a similar positively charged patch in the same region (24), it lacks the negative charge on the opposite side. This irregularly distributed surface charge is unique to NRTN among the GFLs and could be the reason for the low solubility observed for NRTN in vitro. The overall fold of NRTN was similar to those of the published GDNF and ARTN structures (24, 35), but it differed with respect to the angle between the subunits resulting in root mean square deviations (r.m.s.d.) of more than 3 Å between the structures of the GFLs (Fig. S1B).
Figure 1.

Crystal structures of NRTN. A, crystal structure of the NRTN homodimer in cartoon colored by subunit (left). Side chains of cysteines and Arg-166 as well as the main chain of the C terminus are shown as sticks. The hydrogen bonds (2.8–3.2 Å) between the C termini and Arg-166 are shown as dashed lines. B, surface representation of the crystal structure with display of electrostatic surface charge (+5 to −5 mV) shows that the NRTN homodimer bears a positively charged cleft on the concave side (left), whereas the other side is slightly acidic (right). The left panel is in the same orientation as in A, and the right panel is rotated 180°.
We further determined the crystal structure of NRTN in complex with GFRa2 using a full-length GFRa2 protein, except the membrane-embedded glycosylphosphatidylinositol (GPI) anchor (GFRa2D1-D3(22–441)), to 2.4 Å resolution (Fig. 2). The crystallized complex/final model contained residues 36–131 and 158–359 from GFRa2 and residues 100–197 from NRTN. This is the first atomic resolution crystal structure of any GFRa receptor that comprises all three domains, confirming that domain 1 is not directly involved in GFL binding (36). The NRTN–GFRa2 structure shows that one GFRa2 molecule binds one subunit of the NRTN homodimer and that all interactions are mediated by the “finger domains” of NRTN and D2 of GFRa2 (Table S1, Fig. 2A, and Fig. S2). A comparison of both crystal structures, NRTN alone and NRTN–GFRa2, showed that the overall structure of NRTN does not change upon binding to the receptor. The differences observed were limited to side-chain movements, and the overall Cα root mean square deviation was less than 1 Å. The complex structure further shows that the three GFRa2 domains share a similar fold, consisting of four helices. This is likely the result of gene duplication during evolution. D2 and D3 form a globular unit, and all interactions with NRTN are mediated via GFRa2 D2, whereas D1 is pointing away from the NRTN molecule and is not involved in NRTN binding (Fig. 2). GFRa2 D3 is positioned between D1 and D2 with extensive interactions to both (interface areas, 800 and 1100 Å2, respectively), whereas the interaction between D1 and D2 is limited to a single hydrogen bond (Fig. 2B). Interactions between D1 and the rest of GFRa2 are mainly mediated via its fourth helix (residues 103–110) and a single strand (residues 121–128) close to its C terminus. At the center of the D1/D3 interface is a conserved RSR motif (Arg-265–Ser-266–Arg-267, GFRa2 numbering). These three residues form five hydrogen bonds to residues in D1 (Fig. 2B). All residues that make up the domain and protein interfaces are listed in Table S1. The loop connecting D1 with D2 (residues 132–157) is not visible in the crystal structure. The N-terminal sequencing of dissolved protein crystals confirmed that it was proteolytically cleaved during crystal growth.
Figure 2.

Crystal structure of the NRTN–GFRa2D1-D3 complex. A, crystal structure of the NRTN–GFRa2D1-D3 complex. The NRTN homodimer is colored by subunit (orange, purple), and the two copies of GFRa2D1-D3 are colored by domain: D1 (yellow), D2 (green), and D3 (gray). The N and C termini are labeled. The linker between Val-131 and Ser-158, connecting D1 and D2, is missing in the structure. B, detailed view of the boxed region in A highlighting some of the interactions in the GFRa2 D1/D3 interface. GFRa2 is colored by domain, D1 (yellow), D2 (green), and D3 (gray). Residues that are strictly conserved between GFRa1–3 are marked with an asterisk; these include Arg-265–Ser-266–Arg-267 that make up a conserved RSR motif. Glu-102 and Glu-124 are conserved between GFRa2 and GFRa1. Arg-97, Trp-110, Tyr-128, Arg-265, and Arg-267 are also strictly conserved in GFRa4 sequences in species that has retained D1. Arg-267 forms hydrogen bonds to Glu-102 and Tyr-128 from D1 and has a stacking interaction with Arg-97. Arg-265 forms a hydrogen bond to Glu-124 and stacks against the side chain of Trp-110 from D1. In addition, Trp-110 forms a hydrogen bond to Ser-266. Arg-259 is within hydrogen bonding distance to the main chain of Glu-121. The only direct interaction observed between D1 and D2 is a hydrogen bond between Arg-97 and Asp-209. Distances equivalent to hydrogen bonds (2.8–3.2 Å) are shown as dashed lines. C, comparison between the GFRa2 and GFRa1 GFL-binding surfaces. The crystal structure of the NRTN–GFRa2D2-D3 complex (NRTN is colored orange and purple; GFRa2 D2 is colored green, and D3 is colored gray) overlaid with the GDNF–GFRa1 crystal structure (PDB code 2v5e, GDNF is colored yellow and GFRa1 is colored dark gray). The figure shows a section of the boxed region from A with 2v5e superimposed. The displayed section is representative of the entire interface. 17 of the 19 residues that interact directly with GDNF or NRTN are conserved between GFRa1 and GFRa2 (GFRa2 Ser-183 corresponds to GFRa1 Thr-176 and Asn-186 corresponds to Thr-179, not shown in the figure). Only residues from D2 are involved in NRTN/GDNF binding. Distances equivalent to hydrogen bonds (2.8–3.2 Å) are shown as dashed lines.
Domain 1 of GFRa2 is not involved in NRTN binding
D1 of the GFRa family of receptors has been implicated to have several functions, and until now, there has been no high-resolution structural data available showing the position of D1. The domain has been suggested to be important for the binding to GFLs (37), even though most studies indicate that it is not required for ligand binding (36, 38–40). Previous studies have also shown that D1 from GFRa1 modulates interactions with transmembrane receptors (40) and that isolated D1 can bind NCAM with affinities similar to full-length GFRa1 (41).
In the NRTN–GFRa2D1-D3 structure presented here, D1 points away from NRTN, which unambiguously shows that it is not involved in NRTN binding. To further study the function of D1, we expressed a truncated version of GFRa2 (GFRa2D2-D3, residues 147–362), consisting of domains 2 (D2) and 3 (D3) but lacking domain 1 (D1) and the C-terminal linker bearing the GPI anchor. The affinities between NRTN and GFRa2D2-D3 and GFRa2D1-D3, as determined using ITC, were 60 nm (pKd 7.1 ± 0.1) and 220 nm (pKd 6.7 ± 0.1), respectively (Fig. 3). Although the affinities of NRTN are significantly different, they are of similar magnitude. Furthermore, the affinity is actually slightly weaker for the full-length receptor compared with the truncated protein.
Figure 3.
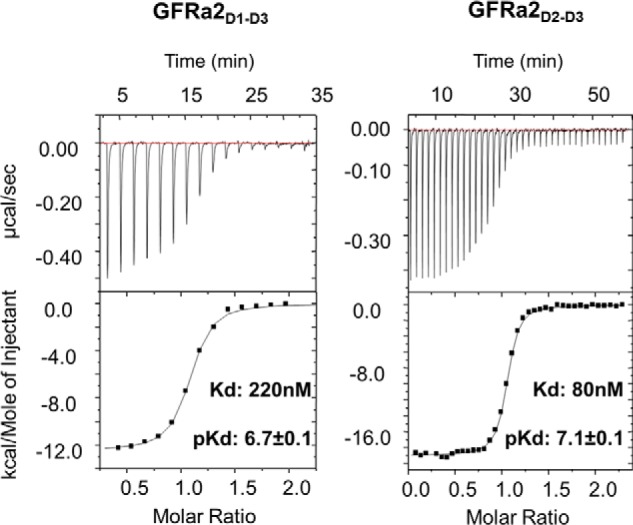
Affinity between GFRa2 and NRTN determined by ITC. Shown are ITC titrations of GFRa2D1-D3 or GFRa2D2-D3 to NRTN. Example data were from triplicate measurements. Molar ratios are close to 1, showing that one NRTN homodimer binds two GFRa2 molecules. The equilibrium dissociation constants for GFRa2D1-D3 and GFRa2D2-D3 binding to NRTN are significantly different but of similar magnitude. GFRa2D1-D3 has a worse affinity to NRTN indicating that presence of D1 of GFRa2 does not improve its affinity to NRTN.
We further determined the crystal structure of NRTN in complex with the truncated GFRa2D2-D3 to 2.0 Å. We compared the crystal structures of the NRTN–GFRa2D2-D3 and NRTN–GFRa2D1-D3 complexes, and the overall topology of the structures was similar, but there was a shift in angle between the NRTN subunits that resulted in an r.m.s.d. for all Cα of 2.6 Å (Fig. S2B). This shift could be caused by crystal packing, based on the observed intermolecular interactions in the structure, but we cannot rule out that the shift is induced by the presence of D1. The NRTN/GFRa2 interface is, however, unchanged. Taken together, the structural and biophysical data shows that D1 has no effect on either the binding affinity between NRTN and GFRa2 or on the GFL–GFR interaction of the complex.
Comparison between interaction surfaces in GFRa1 and GFRa2
We compared the NRTN–GFRa2 crystal structure and the published homologous GFL–GFRa complex structures available (38, 39). As the structures of GFRa2D2-D3 and GFRa2D1-D3 do not differ in the NRTN interaction surface, we assume that we can compare our full-length structure to the truncated receptor structures. The structural overlay showed that the binding interface between GFRa2 and NRTN (Fig. 2C) shares great similarities with that of GFRa1 and GDNF (39). In fact, all GFRa2 residues that are directly involved in NRTN binding are conserved in position and sequence between GFRa1 and GFRa2 (Fig. 2C and Table S1), with the exception of a serine to threonine replacement (Ser-183 corresponds to Thr-176 in GFRa1) and an asparagine to threonine (Asn-186 corresponds to Thr-179 in GFRa1). The sequence difference in the interaction surface, and potential second layer effects, could account for the selectivity between the receptors. However, the high degree of conservation between the two receptor proteins in this area also suggests that selectivity might be controlled by other factors such as tissue distribution of receptors or molecular components that drive localization on the cell surface.
Interaction surfaces in GFRa are evolutionary conserved
To better understand the role and importance of GFRa2 D1, we aligned a diverse set of GFRa1–3 sequences from several species with sequence identity ranging from 33 to 99%. The residues that were strictly conserved were mapped onto the crystal structure. From this analysis, three highly conserved regions of GFRas emerged: the GFL-binding site, the D2/D3 interface, and the D1/D3 interface (Fig. 4 and Fig. S3). The high degree of conservation in the D1/D3 and D2/D3 interfaces highlights the biological importance of all three domains in the GFRa1–3 receptors. We further observed that the conserved patch on D1 was slightly larger than the interacting region in D3, resulting in an excess unpaired area of conserved residues (D1:E, Fig. 4, Table S1). At present, the precise function of these conserved residues is unknown, but as conservation often aligns to functional importance, it is tempting to speculate that they may be involved in binding to RET or NCAM. The persephin-specific GFRa4 was excluded from this alignment because this receptor in humans is lacking D1 (42), and instead, we performed a separate alignment of GFRa4 sequences. Interestingly, the alignment clearly shows that the surface area in D3 that is interacting with D1 in GFRa1–3 is not preserved in human GFRa4, which is consistent with the lack of D1. A previously reported bioinformatics analysis suggests that D1 of GFRa4 in most mammals has been lost recently (43), and our sequence alignments show that the GFRa4s that still contain D1 (from birds, fish, amphibians, and reptiles) are more similar to GFRa1–3 in these interaction points than to human GFRa4 (Fig. S3B).
Figure 4.

Conserved residues between GFRa1–3 are mapped on the NRTN–GFRa2D1-D3 crystal structure. Mapping of the conserved regions on the crystal structure of NRTN–GFRa2D1-D3 shows that all domain interfaces are conserved as well as the NRTN-binding site on D2. In addition, there is an excess conserved area on D1 (D1:E) that is not involved in interdomain interactions. GFRa2 is shown as surface with D1 (yellow), D2 (green), and D3 (gray). NRTN is shown in cartoon (orange, purple). The conserved patches (dark blue) correspond to the NRTN/D2 (D2:NT), D2/D3, and D1/D3 interfaces. The excess unpaired conserved region on D1 (D1:E) is available for interactions with RET and/or NCAM. A, same orientation is used in the three panels, whole receptor (top), D1 and D3 (middle), and D3 only (bottom). B, rotated view compared A to view the receptor from the GFL (∼90° rotation around x and y axes). The same orientation is used in the three panels, the whole receptor (top), D1 and D3 (middle), and D1 only (bottom).
Surface density of GFRa2 affects functional affinity to NRTN
We also used surface plasmon resonance (SPR) to determine the affinity between GFRa2 and NRTN. When NRTN was immobilized to the surface, the binding of GFRa2 could be described with a simple 1:1 interaction model, and the affinities obtained were very close to those observed in ITC (Fig. S4). However, when GFRa2D2-D3 was immobilized, NRTN binding was more complex. A model composed of two parallel equilibria was used and resulted in two affinities: a weaker binding of around 200 nm, very similar to the Kd value obtained both in our ITC measurements and the reversed SPR setup, and a second, up to 100-fold higher affinity (Fig. 5). The contribution of the tighter interaction to the overall binding signal was also increased at higher surface concentrations of GFRa2. We hypothesize that this is an example of polyvalent avidity (44, 45). When NRTN binds to two GFRa2 molecules, the apparent affinity and the residence time increases compared with the monovalent interaction (Fig. 5). This avidity effect, or functional affinity, could explain some of the variation in affinity reported in the literature as the relative strength of the GFL–GFRa interaction will depend on the differences in receptor density on the cell surface (46, 47).
Figure 5.

Affinity between NRTN and GFRa2D1-D3 at high- and low-surface density of GFRa2. SPR experimental traces (red) of NRTN injected over GFRa2D2-D3 immobilized at low-surface density (A, 90 response units (RU) immobilized protein) or high-surface density (B, 420 RU immobilized protein). Black lines represent the fit of a model composed of two separate equilibria resulting in two apparent Kd values and two apparent maximum responses (Rmax). This model is a simplification of which binding events actually occur on the sensor chip (see under “Discussion”), but this roughly corresponds to a weaker affinity of NRTN binding monovalency (C) and a stronger affinity for NRTN binding bivalency (D) to immobilized GFRa2. The model also provides an estimation of the contribution of the two interactions to the overall binding signal by calculating a ratio (ratio = Rmax, 1 or Rmax, 2/(Rmax, 1 + Rmax, 2)) for each surface density. The ratio suggests that the contribution of the high-affinity interaction to the overall binding signal is larger at higher surface densities. This is in line with bivalent binding avidity as the ability to form bivalent complexes increases when the GFRa2 density is higher. Average and standard deviations were obtained from duplicate measurements.
NRTN and GFRa2 bind heparan sulfate
The NRTN–GFRa2D2-D3 complex was crystallized in the presence of ammonium sulfate, and in the crystal structure three clearly defined sulfate ions were observed in the positively charged cleft of NRTN (Fig. 6 and Fig. S2). The ions were coordinated by hydrogen bonds to the side chains of Arg-149, Arg-158, Arg-160, and Gln-162. In the sulfate-free NRTN structures, the same protein side chains were either disordered and not visible in the electron density, which indicates flexibility, or they interacted with symmetry-related molecules in the crystal (crystallization artifact). NRTN has been shown to bind heparin and the related molecule HS (22, 25), and the rearrangement of the protein side chains and the distance between the sulfate ions suggested that this was a binding site that could bind a sulfated molecule like HS. To confirm this, we constructed mutant NRTN variants that were tested for binding to heparin-Sepharose. Two triple mutants, R158A/R160A/Q162A and R149A/R152A/R158A, showed a clear loss of binding to heparin-Sepharose, whereas substitution of groups of arginines in other areas on the NRTN surface had no effect (Fig. 6 and Table S2) indicating that binding is not driven by unspecific electrostatic interactions. These results support that this is indeed a specific HS-binding site in NRTN and that the affinity for HS is dependent on specific amino acid residues and can be modified by mutagenesis. Specific binding between NRTN and heparin could also be verified by NMR (Fig. S5).
Figure 6.

NRTN mutants and heparin binding. A, three sulfate ions (sticks) are bound in the NRTN charged cleft and are coordinated by side chains from both subunits (orange and purple, respectively). The initial FoFc difference density map is contoured at 3.0 σ (green). Hydrogen bonds to the protein are marked with dashed lines. B, binding of wildtype and mutant NRTN to heparin. Ionic strength in relation to the isoelectric point (conductivity/pI) is required for different variants of NRTN to be eluted from a heparin column. Removal of positively charged amino acid residues, even in the strongly basic area in the vicinity of the sulfate ions, only changed the affinity to a heparin-Sepharose matrix proportionally to the lost surface charge. For the mutations affecting the sulfate-coordinating residues, the heparin affinity is unproportionally lower, indicating that these residues are important for a specific heparin interaction. C, surface representation of NRTN from the crystal structure of the NRTN–GFRa2D2-D3–SO4 complex. The three sulfate ions in the charged cleft are shown as spheres. The electrostatic surface charge (top) is calculated in PyMOL with default settings. Residues that are replaced by alanines in the mutant NRTN variants are highlighted: R158A/R160A/Q162A (blue), R149A/R152A/R158A (cyan), R97A/R101A/R155A/R156A (magenta), and R101A/R139A/R191A (green), respectively.
Interestingly, the NMR experiments also revealed that heparin and heparin analogues bind specifically to GFRa2D1-D3 in the absence of NRTN, indicating the presence of an HS-binding site in GFRa2 as well (Fig. S5). Even though there is no direct evidence for the position of this HS site, electrostatic representation of the NRTN–GFRa2D1-D3 crystal structure revealed a positively charged patch on GFRa2 in the cleft between D2 and D1. Superposition with the published structure of GDNF–GFRa1D2-D3 in complex with sucrose octasulfate, a heparin analogue (39), showed that the binding site of the heparin analogue in GFRa1 overlapped with this cleft in GFRa2 (Figs. S5 and S6). The sucrose octasulfate coordinating residues from D2 are largely conserved in position and sequence between GFRa1 and GFRa2 D2. In addition, the positively charged residues in D1 that make up the patch are partly conserved in sequence in GFRa1 (Fig. S3, A and B). We speculate that the charged patch on GFRa2 may represent a binding site for HS, where charged residues from both D1 and D2 contribute to binding.
NRTN mutants with impaired HS binding have retained cell-signaling capacity
To address the effect of impaired HS binding on the biological activity of NRTN, the activation of mitogen-activated protein kinase (MAPK) signaling through RET kinase was measured in a human neuroblastoma cell line modified to contain a luciferase encoding gene under the control of repetitive serum-response elements (48). Signaling through RET kinase requires an intact interaction with GFRa2, and the EC50 values of wildtype NRTN compared with mutant variants required to initiate RET signaling are listed in Table 1. The signaling capacity is essentially unchanged (2-fold or less) between wildtype NRTN and the two mutants with impaired HS binding (R158A/R160A/Q162A and R149A/R152A/R158A). This suggests that the reduction in the HS binding of NRTN does not affect the binding to GFRa2 and the subsequent RET activation in vitro. In contrast, mutation of key residues located in the NRTN–GFRa2 interface, i.e. Glu-123 and Tyr-183, completely abolished MAPK signaling through RET. Glu-123 and Tyr-183 are part of the NRTN–GFRa2 interface and contribute to a network of hydrogen bonds to GFRa2. The E123A/Y183A double mutant has no detectable activity in the assay.
Table 1.
EC50 values of NRTN mutants and wildtype
The EC50 value represents the protein concentration required to obtain the half-maximal downstream signaling effect in TGW cells. The EC50 is essentially unchanged (2-fold or less) between wildtype NRTN and the two mutants with impaired HS binding. In contrast, the E123A/Y183A double mutant has less than 20% activity of wildtype NRTN even at the highest tested concentration (10,000 ng/ml). Glu-123 and Tyr-183 are part of the NT/GFRa2 interface and contribute key interactions to GFRa2. ND means not detected.
| Mutant | EC50 |
|---|---|
| ng/ml | |
| Wildtype | 5.6 |
| Arg-149/Arg-152/Arg-158 | 2.3 |
| Arg-158/Arg-160/Gln-162 | 4.2 |
| E123A/Y183A | ND |
In conclusion, reduction in the affinity to heparin does not reduce the capacity of NRTN to initiate signaling via GFRa2/RET in vitro. If anything, there seems to be a slight increase in the activity of the NRTN mutants with reduced affinity to heparin.
NRTN mutants with impaired HS binding have increased exposure in rats
To assess whether the reduction in HS binding translated to exposure of NRTN in vivo, we performed an experiment to compare the PK properties of one of the NRTN mutants with impaired HS binding (R149A/R152A/R158A) with those of wildtype NRTN in rat. The concentration versus time profiles of wildtype NRTN and the NRTN mutant, respectively, were analyzed in plasma from two rats after intravenous (i.v.) administration and in three rats after subcutaneous (s.c.) administration (Fig. S7). Improved PK properties in healthy rats were demonstrated for the NRTN mutant with reduced HS binding compared with native NRTN (Table 2). Higher exposure, in terms of maximum concentration (Cmax) and area under the curve (AUC), was demonstrated for this NRTN mutant, with a 15-fold increase of AUC after i.v. administration and a 7-fold increase of AUC after s.c. administration (Table 2). In addition, the PK properties showed a significant improvement in reduction of volume of distribution and clearance, with minor changes in the terminal half-life. These results show that a mutant NRTN protein with impaired HS binding has increased bioavailability and could therefore potentially be used at lower doses than wildtype NRTN in vivo and still reach sufficient exposure, maintaining plasma levels over EC50 for a prolonged period of time.
Table 2.
Pharmacokinetic properties of human NRTN analogues: NRTN mutant (R149A/R152A/R158A) versus NRTN wildtype (WT)
The results are based on PK data from two individual rats for i.v. administration and three individual rats for s.c. administration. Cmax indicates maximal concentration; AUC indicates area under the curve; Vc indicates volume of central compartment; Vt indicates volume of tissue compartment; F indicates bioavailability; CL indicates systemic plasma clearance; Cld indicates inter-compartment constant, t½ indicates terminal half-life.
| PK parameter | NRTN mutant (i.v.) | NRTN WT (i.v.) | NRTN mutant (s.c.) | NRTN WT (s.c.) |
|---|---|---|---|---|
| Cmax (μg/liter) | 1.3·104 | 8.2·102 | 89 | 26 |
| AUC (μg·h/liter) | 4.9·103 | 6.2·102 | 1.5·103 | 2.2·102 |
| Vc (liter/kg) | 0.07 | 5.5 | ||
| Vt (liter/kg) | 0.12 | 4.3 | ||
| F (%) | 31 | 35 | ||
| CL (liter/h/kg) | 0.20 | 1.6 | ||
| Cld (liter/h/kg) | 0.009 | 0.31 | ||
| t½ (hours) | 7.6 | 4.9 | 13 | 28 |
Discussion
Role of GFRa2 D1 in receptor complex formation
The role of domain 1 of several GFRa co-receptors has remained elusive. Although one study has suggested D1 to play a role in GFL binding (37), most studies implied that D1 was dispensable for GFL binding (Wang et al. (38); GDNF–GFRa1, Goodman et al. (36); GDNF and NRTN, Scott and Ibanez (40)). D1 has further been shown to interact with the transmembrane receptors RET (36, 49) and NCAM (41), although, at least in the case for GDNF–GFRa1–RET, this has also been the subject of debate (37). Furthermore, human GFRa4 and some isoforms of GFRa2 lack D1 but are still able to signal through RET (Airaksinen et al. (9); Scott and Ibanez (40, 43)). Last, but not least, GFRa1 D1 has been described to interact with heparan sulfates (39).
Based on the results presented in this paper, we conclude that D1 of GFRa2 does not play a role in the binding of NRTN. We base this on the following facts: (a) D1 points away from NRTN in the NRTN–GFRa2D1-D3 structure; (b) there is only a small difference in affinity when NRTN binds to GFRa2D1-D3 or GFRa2D2-D3. Instead, our crystal structure and bioinformatics analyses strengthen the evidence that D1 plays an important role in the interaction with signal-transducing receptors, as has previously been shown for NCAM (41) and RET (36). This is further supported by the fact that the location of D1 in our NRTN–GFRa2D1-D3 crystal structure is similar to the placement of D1 in a GDNF–GFRa1–RET low resolution electron microscopy (EM) model, where D1 is placed close to the cadherin-like domains 1 and 2 (CLD1–2) of RET (36).
Our data show that there is a high degree of sequence conservation in the D1/D3 and D2/D3 domain interfaces, with the exception of mammalian GFRa4 that is lacking D1. In GFRa4, D3 residues corresponding to the D1/D3 interface in GFRa1–3 are not conserved, as exemplified by the loss of the Arg-265–Ser-266–Arg-267 motif on the surface of D3. The importance of these residues has been reported previously from experiments on a GFRa1 R257A/R259A mutant (R265A/R267A in GFRa2 numbering) showing that only 30% of the GDNF-stimulated RET phosphorylation was retained (39). The crystal structure has now shown that this motif has a central position in the D1/D3 interface, forming five hydrogen bonds to residues in D1 (Fig. 2B), and the disruption of these interactions by mutation likely results in dissociation of D1 from the rest of the GFRa receptor, given that D1 and D2 are only loosely connected via a flexible loop. Taken together, this implies that even though GFRa receptors lacking D1, or where the D1/D3 interface is disrupted, are still able to signal through RET, they do so with reduced efficiency. Furthermore, human GFRa4 is lacking D1, and sequence alignment shows a large insert in the region corresponding to the D1/D3 interface. It is tempting to speculate that this insert is providing an alternative RET binding in the absence of D1.
From mapping conserved residues onto the crystal structure, we observed that the highly conserved patch on the D1 surface was slightly larger than the corresponding region in D3, resulting in an excess unpaired area of conserved residues (D1:E, Fig. 4, Table S1). Because this is the only strictly conserved area that is not accounted for by domain interfaces or the GFL-binding site, it is tempting to speculate that this area on D1 plays a role in receptor complex formation, possibly via direct binding to the receptors RET or NCAM. However, for this to be compatible with the published GDNF–GFRa1–RET EM model (36), a conformational change in GFRa2 that alters the orientation of D1 would be required. This is not unlikely, as flexibility of the D1 position relative to the rest of the molecule has been suggested on the basis of the long linker between D1 and D2 (40), a linker that has been observed to be spontaneously cleaved by us (residues 132–157) and others (38). The atomic resolution structure of the multimeric NRTN–GFRa2–RET complex would be needed to elucidate the exact location of D1.
Receptor selectivity
Each GFL is reported to signal through a specific receptor. Comparison of GFL–GFRa interaction surfaces showed that the residues involved in GFL binding are conserved, especially between GFRa1 and GFRa2. 89% of the residues on GFRa1 and GFRa2 that interact with GDNF and NRTN, respectively, are identical both in sequence and position, even though the overall identity for mature NRTN and GDNF is around 44%. The overall topology in the interface is also very similar. Hence, it is not clear from the crystal structures what would introduce selectivity. The similarities may explain the reported cross-reactivity between the different GFLs and GFRa receptors (11, 12), but it also suggests that GFL–GFRa selectivity can most likely not be mediated through these interaction surfaces alone, but additional factors are required.
GFRa2 surface density impacts the functional affinity of NRTN
The affinities between GFLs and GFRa co-receptors have been reported in the literature with values ranging from 200 nm to 60 pm (46, 47). Some variability can be attributed to the use of different GFL–GFRa pairs and differences in the assays used but also the presence/absence of RET or NCAM.
Our SPR experiments show that the relative surface concentration of monomeric GFRa2 will affect the functional affinity of its interaction with NRTN, most likely due to bivalent binding of one NRTN dimer to two immobilized GFRa2 monomers. The binding model used for the SPR data analysis, composed of two parallel equilibria, is a simplification of what actually takes place on the sensor chip. The spatial distance between GFRa2 monomers will result in a distribution of different affinities from the lowest monovalent affinity to the highest bivalent interaction with an ideal distance between the monomers. Affinities between these two extremes will correspond to bivalent binding with non-ideal distance between the GFRa2 monomers, resulting in various degrees of strain in GRFa2 or the chip dextran matrix in order for the complex to form. This strain would be extracting a thermodynamic penalty to the binding that will translate to affinities higher than the monovalent interaction but lower than the ideal bivalent interaction (45). As a consequence, the two affinities obtained from SPR corresponds approximately to the two most populated states of the interaction and should be considered to be apparent. This is the reason why one affinity increases while the other affinity is not affected as much with the higher surface density. The relative contribution of the high-affinity interaction to the overall binding signal also increases with the GFRa2 surface density, exemplified by the change in binding ratio (Fig. 5). In our hands, the bivalent binding of NRTN to two GFRa2 receptor molecules resulted in over a hundredfold increase in apparent affinity. This indicates that variations over at least 2 orders of magnitude in NRTN–GFRa2 affinities, and probably other GFL–GFRa pairs as well, is possibly simply due to GFRa2 receptor density on a surface. Interestingly, this higher affinity is similar to what has been observed in other SPR experiments when the crystallizable fragment (Fc)-fused GFRa2 was used to detect binding to immobilized NRTN (11). Because the Fc domains will dimerize, each of these dimers will present two GFRa receptors in close proximity, mimicking a bivalent high-affinity binding site for the corresponding GFL. Protein immobilized on a sensor chip has restricted lateral mobility and is not the same as protein in a cell membrane; hence, it cannot directly be used to understand cell data. A low receptor density in combination with free 2D diffusion of the receptor will greatly reduce the likelihood of bivalent binding compared with high density and restricted mobility (44). However, from our data it is clear that a high-affinity complex can be formed between NRTN and GFRa2 in the absence of RET or NCAM. In a previous study, the mechanism of ARTN signaling through GFRa3 was proposed to occur through the formation of the GFL–GFRa monovalent complex, followed by binding to one RET molecule followed by binding to the second GFRa monomer, and finally binding to the second RET molecule (46). Data presented here indicate that an alternative mechanism could be the formation of the bivalent GFL–GFRa complex first followed by binding to the RET molecules. Which mechanism that is preferred will depend on the overall surface density of GFRa and RET. However, this does imply that cells can alter their responsiveness to GFLs by changing not only the expression levels of the receptors but also the local concentration on the cell surface by partitioning into lipid rafts (1, 27, 50, 51) or by interaction with heparan-sulfated proteoglycans, like syndecan-3 (25, 52).
Role of HS binding in receptor complex formation
The electrostatic representation of the NRTN crystal structure revealed a positively charged cleft between the NRTN monomers. We propose that this is a specific HS-binding site, as defined by the bound sulfate ions in the crystal structure and further validated through site-directed mutagenesis of key residues in NRTN. We also suggest that GFRa2 bears an HS-binding site, including residues from D1 and D2. This implies that D1 could play an indirect role in facilitating receptor complex formation by forming a complete HS-binding site in GFRa2.
The role of HS in the GFL:–GFRa–RET pathway is not well-understood, and there is conflicting literature on what effect the addition of HS has on signaling (52, 53). GDNF has a predicted HS-binding site in its N terminus (22), and ARTN displays a charged trench (24, 38) similar to NRTN (Fig. S1). We report that GFRa2 binds HS and also that NCAM has been shown previously to contain an HS-binding site (54). In the published crystal structure of the CLD1–2 of RET (55), the domains dimerize and form a positively charged cleft with four sulfate ions bound in a linear manner, closely resembling the HS-binding site seen in the NRTN–GFRa2D2-D3 structure (Fig. 6 and Fig. S2). However, in the EM model of GDNF–GFRa1–RET (36), the CLD1–2 domains of RET are not dimerized, and hence the putative HS-binding site is not observed, suggesting a possible receptor rearrangement.
The fact that all components of the GFL–GFRa–RET/NCAM complexes bind HS suggest that the interaction between heparan-sulfated proteoglycans and NRTN and GFRa2 could be described as a variant of the HS interaction models summarized by Schlessinger et al. (56) for fibroblast growth factor (FGF) and the FGF receptor. The HS site on NRTN will lead to a tethering of NRTN to the cell membrane, which results in an increased concentration of NRTN close to the membrane-bound receptors GFRa2, RET, and NCAM.
There is also increased support for the requirement of clustering of several of the formed signaling complexes in lipid rafts to elicit a full biological effect (57, 58). It has been shown that this could be circumvented by artificial antibody-mediated clustering outside lipid rafts (59). Because no direct interactions between signaling complexes have been reported, a role for proteoglycans carrying several HS chains in clustering within lipid rafts is suggested. A requirement of formation of clusters of signaling complexes would explain reports where variants of the GDNF family of proteins with reduced affinity for HS induce RET phosphorylation in vitro but do not translate into more complex biological model systems as this would require a local enrichment of several GFL–GFRa–RET complexes (60).
HS binding and in vivo effects
The strong interaction of both GDNF and NRTN with heparin has been postulated to be the major reason for the low exposure in tissue of patients in clinical studies for treatment of Parkinson's disease with these proteins (30, 31). Co-administration of NRTN with heparin significantly increased its volume of distribution in animal models (61). This effect is likely caused by binding of the added heparin to the HS-binding site on NRTN, effectively competing with HS on cell surfaces and in the ECM. The same has been reported for ARTN and GDNF (61). Runeberg-Roos et al. (62) recently demonstrated improved diffusion in brain tissue from rat and monkey with an NRTN variant where they replaced the helix bearing residues Arg-146–Glu-157 with ARLQGQGALVGS derived partly from the sequence of persephin. Our results provide detailed molecular understanding of the HS-binding site that has enabled us to rationally design point-mutated NRTN variants, which should reduce the risk of structural perturbations or immunogenicity when used in vivo. These data suggest that NRTN variants with reduced affinity for HS could enable higher exposure upon injection or transgenic expression in target tissue (63). We have shown that point mutations in the HS-binding site of NRTN can modify the affinity for HS, and we have confirmed that this translates to increased exposure and improved PK profile in vivo after both i.v. and s.c. administration. Furthermore, we show that these mutants have retained signaling capabilities in vitro.
Therefore, our data show that altering the HS-binding site of NRTN may provide an alternative solution to increasing the exposure of NRTN in target tissue. However, HS binding has been shown to be important for function (57, 58). Piltonen et al. (60) showed that an HS-deficient mutant of the homologous GDNF, despite having increased MAPK signaling in vitro, had less effect than wildtype GDNF in a four-site striatal lesion rat model mimicking Parkinson's disease symptoms. In addition, Gash et al. (64) showed that there was significant correlation between distribution of GDNF in brain tissue and functional improvement in a non-human primate Parkinson's model.
Our data show that altering the HS-binding site of NRTN provides a route to increase the NRTN exposure in target tissue, but whether the increased distribution of mutant NRTN with reduced HS binding retains a full cell protective effect in vivo remains to be seen.
Mechanism of signaling complex formation
Taken together, a possible mechanism of signaling complex formation emerges. The NRTN concentration required to form a stable complex depends on the relative concentration of NRTN and GFRa2 close to the cell surface. HS binding could facilitate this by interacting with both NRTN and GFRa2 to localize the proteins close together on the membrane (Fig. 7A). The bivalent NRTN–GFRa2 complex then forms a signaling complex with RET/NCAM, which is possibly stabilized through additional interactions mediated via D1 of GFRa2. Alternatively, or in addition, the interaction with proteoglycans with multiple HS chains induces clustering of formed signaling complexes in lipid rafts to trigger a specific signaling cascade (Fig. 7B). All in all, these different interactions could be a major driver for assembly and stability of the signaling complex as well as guiding the selectivity between GFL/GFRa pairs. This has implications for our understanding of the system, but it also provides different routes for agonism or antagonism of GFL signaling in a drug discovery context.
Figure 7.

Models for NRTN-mediated signaling complexes and role of HS. A, NRTN (orange) binds to proteoglycans bearing unbranched HS chains (gray) on the cell surface, enriching the local concentration. The complete signaling complex is then formed between NRTN, membrane-anchored GFRa2 (blue), and the transmembrane receptor RET (green), leading to dimerization and phosphorylation of the intracellular kinase domain of RET and downstream signaling. B, clustering of complexes is required for cell signaling. NRTN (orange), GFRa2 (blue), and RET (green). NRTN binds to GFRa2 molecules that are anchored in lipid rafts in the membrane, with the aid of proteoglycans bearing unbranched HS chains. RET is recruited into the lipid rafts when binding to the NRTN–GFRa2 complex.
Experimental procedures
Protein expression and purification of neurturin
The genes encoding native and variants of mature human NRTN (Ala-96–Val-197, Q99748) preceded by a His6–Asn tag and a recognition site (ENLYFQ) for tobacco etch virus protease was produced by gene synthesis (Geneart, Germany) and cloned into pET24a via NdeI and HindIII. The same procedures for expression and purification were followed both for the native and the mutated NRTN. Protein expression was performed in BL21 (DE3) Star via autoinduction at 37 °C for 16 h. The resulting inclusion bodies were dissolved in 50 mm Tris-HCl, pH 8.0, 100 mm NaPO4, 8 m urea, and 10 mm tris(2-carboxyethyl)phosphine at room temperature for 3 h. The dissolved protein was refolded by rapid dilution into 50 mmTris-HCl, pH 8.2, 3 m urea, 75 mm NaPO4, 300 mm NaCl, 20 mm glycine, 4 mm cysteine, and 15% (w/v) glycerol at a final protein concentration of 0.25 mg/ml. After 48 h, the precipitated material was removed by filtration, and NRTN was purified over nickel-Sepharose (GE Healthcare) equilibrated in 50 mm Tris-HCl, pH 8.2, 300 mm NaCl, 75 mm NaPO4, and 15% (w/v) glycerol (IMAC buffer). The column was washed with 100 mm imidazole in IMAC buffer and eluted with 500 mm imidazole in IMAC buffer. The His6–Asn tag was enzymatically removed by treatment with tobacco etch virus protease at 21 °C for 16 h. As a final purification step, NRTN was purified on heparin-Sepharose FF (GE Healthcare) equilibrated in 50 mm NaPO4, 100 mm NaCl, and 15% (w/v) glycerol. The protein was eluted with a linear gradient to 2 m NaCl over 15 column volumes, and dimeric NRTN eluted at ∼1 m NaCl. For buffer exchange into formulations used for crystallization and characterization, the protein solution was extensively dialyzed against the buffers described in the respective application below. Mutant and native NRTN showed similar expression and stability. The ability of the purified NRTN variants to activate MAPK signaling through RET was measured as described earlier (48).
Measuring neurturin affinity to heparin-Sepharose
To compare the different NRTN variants affinity to heparin-Sepharose, 1 ml of heparin-Sepharose FF (GE Healthcare) was packed into a Tricorn 5/50 column (GE Healthcare). The resin was equilibrated with 50 mm NaPO4, 100 mm NaCl, and 15% (w/v) glycerol before different NRTN variants (∼100 μg) were loaded onto the column. The protein was eluted with a linear gradient to 2 m NaCl over 20 column volumes. The conductivity (millisiemens/cm) at maximum peak height was recorded.
Protein expression and purification of GFRa2
Both genes encoding full-length (Ser-22–Ser-441) and truncated (Gly-147–Asn-362) human GFRa2 (O00451) were produced through gene synthesis (Geneart, Germany) with a His6 tag on the C terminus and cloned via SacII/NheI into pDEST12.2oriP (65). Both proteins were expressed in Chinese hamster ovary (CHO) cells after transient transfection essentially as described (66). In short, CHO cells were seeded at 0.5e6 cells the day before transfection in CD-CHO (Invitrogen) media. On the day of transfection, 0.5 μg of plasmid DNA and 7 μg of polyethyleneimine “Max” (Polysciences, Inc.) was added per ml of cell culture. The cell cultures were fed after 24 h. A hypothermic shift to 30 °C was performed after 3 days, and the cultures were harvested when the viability dropped below 85% as measured by trypan blue exclusion. Both proteins were purified directly from the cell culture media on nickel-Sepharose (GE Healthcare) equilibrated in 20 mm HEPES, pH 7.0, 20 mm imidazole, and 500 mm NaCl. The GFRa2 protein was eluted by step elution (500 mm imidazole). After concentration by ultrafiltration of the fractions containing GFRa2, the proteins were further polished by gel filtration on Superdex 200 (GE Healthcare) equilibrated with 25 mm HEPES, pH 7.0, 300 mm NaCl, 5% (w/v) glycerol.
The complexes between NRTN and GFRa2 were formed by mixing and incubating the proteins for 16 h at 4 °C before performing gel filtration on the mixture over a Superdex 200 (50 mm HEPES, pH 7.5, 300 mm NaCl, and 10% glycerol) to separate monomeric proteins from the NRTN–GFRa2 complexes.
Activity assessment of neurturin mutants
Experiments utilize the human neuroblastoma cell line, TGW (TGW-SRE-Luc, clone 42, JCRB0618, originally from the Japanese Collection of Research Bioresources), stably expressing a reporter gene construct containing a luciferase gene under the control of repetitive serum-response elements as described earlier (34). The assay is carried out in collagen I-coated 96-well plates (BD Biosciences Labware) using Neolite High Sensitivity Luminescence Reporter Gene Assay System (PerkinElmer Life Sciences). One day before stimulation with NRTN mutants, cells were detached using 0.05% trypsin/EDTA, seeded at 40,000 cells/well (in 90 μl of media) on collagen I-coated 96-well plates (BD Biosciences Labware), and allowed to attach overnight in an incubator at 37 °C and 5% CO2. NRTN mutants were serially diluted in media consisting of Dulbecco's modified Eagle's medium/F-12 and 1% penicillin/streptomycin and 10 μl of each resulting diluted concentration was added per well. All doses were run in duplicate, and the stimulation period lasted for 5 h at 37 °C and 5% CO2.
Assay was performed according to the manufacturer's protocol with slight modifications. Briefly, components of the Neolite reporter kit were equilibrated to room temperature prior to use. Neolite-lyophilized substrate was dissolved in the kit's Reconstitution Buffer followed by addition of an equal volume of DPBS buffer (Life Technologies, Inc.). Upon completion of the stimulation period, medium was removed from the cells, and 200 μl of Neolite substrate mixture was add to each well of the 96-well plate. Plates were then covered with aluminum foil and were gently shaken for 5–10 min at room temperature before the plates were read using EnVision plate reader operating in luminescence mode.
Nuclear magnetic resonance (NMR) measurements
NMR experiments were performed on a Bruker 600 MHz spectrometer equipped with a cryoprobe. The pulse sequence for measuring binding was a 200-ms Carr-Purcell-Meiboom-Gill (CPMG) pulse train with 1 ms between the π-pulses, excitation sculpting for water suppression, and an inter-scan delay of 3 s. The total time for each experiment was 5.5 min. Binding was monitored by adding 4 μm NRTN or 4 μm NRTN in complex with GFRa2D2-D3 to 100 μm sucrose octasulfate (Sigma) and displacing the sucrose octasulfate by addition of 17 μm heparin I-A (porcine mucosa, Sigma, estimated monomeric concentration). The buffer was 50 mm deuterated Tris (d11, 98%), pH 7.6, and 10% D2O at 20 °C.
ITC measurements
ITC experiments were conducted on a MicroCal Auto ITC-200 system (GE Healthcare) at 25 °C in a buffer containing 50 mm MOPS, pH 7.2, 200 mm MgSO4, and 10 mm CaCl2. Complete titration of 20 μm NRTN (monomer concentration) was achieved by injecting 14·2 μl 200 μm GFRa2D1-D3 and 38·1 μl GFRa2D2-D3, respectively. The stoichiometry (molar ratio) and the equilibrium association constant (Ka) were obtained using a single-site binding model and non-linear regression (MicroCal Origin version 7.0). The affinities (Kd) were calculated according to 1/Ka = Kd. The affinity for NRTN was slightly higher for the truncated receptor (GFRa2D2-D3) than for the full-length receptor (GFRa2D1-D3), and even though this is a very small difference, it might be a true effect caused by reduced motility in solution.
Surface plasmon resonance (SPR) measurements
SPR experiments were conducted on a Biacore T200 instrument (GE Healthcare) using CMD 500l sensor chips (Xantec Bioanalytics GmbH) at 20 °C. GFRa2 or NRTN was immobilized using amine coupling (Biacore Handbook, GE Healthcare) with PBS as a continuous flow buffer. Briefly, the sensor surfaces were conditioned using 0.1 m sodium borate, 1 m NaCl, pH 9.0, before activation by injecting a mix of 1-ethyl-3-[3-(dimethylamino)propyl]carbodiimide hydrochloride and N-hydroxysuccinimide for 10 min. Approximately 1 μm GFRa2 or NRTN in 10 mm sodium acetate, pH 5.0, were injected separately over activated surfaces and immobilized to different levels. Any reactive groups still present were deactivated by injecting 1 m ethanolamine, pH 8.5, for 10 min. Surfaces subjected only to activation and deactivation were also made to be used as reference surfaces.
The interaction analyses of NRTN injected over immobilized GFRa2D1-D3 and GFRa2D2-D3 were conducted using 50 mm MOPS, pH 7.2, 200 mm MgSO4, and 10 mm CaCl2 as running buffer at 20 °C. NRTN was diluted in running buffer to 40, 160, 625, 2500, and 10,000 nm (monomer concentrations), injected in quick succession for 60 s over immobilized GFRa2 and reference surfaces along with blank samples followed by 1200–3600 s of dissociation.
The resulting sensorgrams were reference-subtracted and blank-subtracted. A model comprising two parallel binding events (“Heterogeneous Ligand” in the Biacore T200 software) was fitted to the data. The model resulted in two dissociation constants (Kd, 1 and Kd, 2) as well as the maximum binding signal from each interaction (maximum response Rmax, 1 and Rmax, 2). The contributions from the two different binding events to the overall binding signal, the ratio, was calculated from Rmax, 1/(Rmax, 1 + Rmax, 2) and Rmax, 2(Rmax, 1 + Rmax, 2), respectively. No bulk refractive index (RI) compensation was used in the data fitting procedures.
The interaction analyses of GFRa2D2-D3 injected over immobilized NRTN were conducted using PBS as running buffer at 20 °C. GFRa2 was diluted in running buffer to 40, 160, 625, 2500, and 10,000 nm, injected in quick succession for 60 s over immobilized NRTN and reference surfaces along with blank samples followed by 1200 s of dissociation. The resulting sensorgrams were reference-subtracted and blank-subtracted. A model describing one binding event (“1:1 Binding” in the Biacore T200 software) was fitted to the data, resulting in one Kd. No bulk refractive index (RI) compensation was used in the data-fitting procedures.
Crystallization, data collection, and structure determination of NRTN
The first NRTN structure was determined by molecular replacement with Phaser (51) using a truncated version (residues 15–48 and 80–113) of the ARTN crystal structure, PDB code 2ASK (12) as starting model. After rigid body refinement with Refmac5 (52), the model could be rebuilt to fit the NRTN sequence. This was done manually in Coot (53), followed by alternating cycles of refinement in Refmac5 and autoBUSTER 2.11.5 (Global Phasing Ltd., Cambridge, UK). This structure was used as a starting model for molecular replacement of the three structures presented in this study. NRTN crystals were obtained by concentrating NRTN in the presence of 5 mm sucrose octasulfate to 5.7 mg/ml. Drops containing 1.5 μl of protein, 1 μl of well solution, and 0.5 μl of microseeds were set up at 20 °C in vapor diffusion experiments. Crystals grew in 3 m sodium formate, 0.1 m BisTris, pH 6, and reached full size after 13 days. The crystals were flash-frozen in liquid nitrogen using the reservoir solution with 30% (±)-2-methyl-2,4-pentanediol added. Data were collected at ESRF, ID29 on a Pilatus 6M detector. The data were processed using XDS (67). The structure was solved with Phaser in space group P1 with four molecules in the asymmetric unit. The structure was refined using alternating cycles of autoBUSTER refinement and manual rebuilding in Coot. The final model contained an A chain and C chain (97–197), a B and D chain (100–197), and 162 water molecules. Data collection and refinement statistics are available in Table S3. Electrostatic potentials were calculated using the PDB2PQR function in PyMOL (68).
Crystallization, data collection, and structure determination of NRTN–GFRa2D2-D3–SO4 complex
NRTN–GFRa2D2-D3 in 50 mm HEPES, pH 7.5, 300 mm NaCl, and 15% glycerol at a concentration of 12 mg/ml was mixed with heparin disaccharide I-A (Sigma) to a concentration of 5 mm. The mixture was incubated at room temperature for 1 h and spun down for 10 min before setup in vapor diffusion experiments at 20 and 4 °C. Large cube-shaped crystals were found in 2.0 m ammonium sulfate and 0.1 m HEPES, pH 7.5 at 20 °C. These crystals were flash-frozen in liquid nitrogen after a quick dip in 20% glycerol, 2.0 m ammonium sulfate, and 0.1 m HEPES, pH 7.5. Data were collected in-house on a Rigaku FRE+ rotating anode equipped with a CCD-A200-CU detector.
The NRTN–GFRa2D2-D3 complex was solved with the program Phaser using the refined structure of the NRTN dimer and GFRa1D2-D3 from PDB code 2V5E (39) as search models. After running the Phaser solution through several refinement cycles with Refmac5, the electron density maps were good enough to enable the “mutated sequence” option in Coot. The structure was refined using autoBUSTER 2.11.5, Refmac5, and manual refinement in Coot. Three sulfate ions were clearly visible as difference densities in the initial maps (Fig. 6), and these sulfates were added to the model early on during refinement. Water molecules and additional sulfate ions, including a fourth sulfate ion in the charged pocket, were added in Coot during the last cycles of refinement. None of the additional sulfate ions was as clearly defined as the three in the charged cleft. Weak traces of electron density around the charged cleft suggested that the heparin disaccharide may be binding to a small proportion of the NRTN molecules. No glycosylation was visible in the electron density. The final model contained the NRTN homodimer (residues 100–197), two copies of GFRa2D2-D3 (residues 152–349), 19 sulfate ions, two glycerol molecules, and 311 water molecules. Data collection and refinement statistics are available in Table S3.
Crystallization, data collection, and structure determination of NRTN–GFRa2D1-D3 complex
NRTN–GFRa2D1-D3 in 50 mm HEPES, pH 7.5, 300 mm NaCl, and 10% glycerol was concentrated to around 8 mg/ml and set up in vapor diffusion experiments at 20 °C. Crystals appeared in one condition after 2 weeks: 5% tacsimate (Hampton Research), 10% PEG MME 5000, and 0.1 m HEPES, pH 7. These initial crystals could be optimized by grid screening and seeding. The crystal used to determine the structure was from a thin crystal flake grown in a streak-seeded drop containing 8% tacsimate, 8% PEG MME 5000, and 0.1 m HEPES, pH 7.5. The crystal was flash-frozen in liquid nitrogen after a quick dip in 20% glycerol, 8% tacsimate, 8% PEG MME 5000, and 0.1 m HEPES, pH 7.5, and data were collected at the ESRF, ID23–1 on a Pilatus detector.
The data were processed with autoPROC (69), XDS (67), and Aimless (70). The structure was solved by molecular replacement with the program Phaser, using a truncated NRTN monomer (residues 99–134 and 164–197) and a GFRa2D2-D3 monomer as starting models. After refinement with Refmac5, the parts of the NRTN model that had been excluded from the structure determination were clearly visible in the electron density and were built into it. After a few cycles of refinement using both Refmac5 and autoBUSTER 2.11.5, positive electron density was visible in connection to GFRa2, facing away from the bound NRTN molecule. We expected this to be GFRa2 D1. A couple of polyalanine helices could be fitted into this density, and several rounds of refinement were performed followed by manual building. Eventually, it was possible to identify side chains, and the model could be manually altered to accommodate the D1 sequence. Density modification was performed using Parrot, followed by averaging with NCSref, both from the CCP4 suite (71). The final model had an R and Rfree of 18.8 and 21.1%, respectively. 28 residues from the N terminus of the expressed GFRa2D1-D3 and the C-terminal linker that would anchor GFRa2 to the membrane were not visible in the electron density and were excluded from the model. The final model contained one NRTN homodimer (residues 100–197) and two GFRa2s (residues 36–66, 75–131, and 158–359). The two D1 domains were built separately and were identical with respect to overall fold, but there were some differences in backbone positions in the first and second helix 1 and 2, despite non-crystallographic symmetry restraints being imposed throughout refinement. All D1 residues close to D3 superimpose perfectly between the two D1 monomers. The D1 was positioned between two symmetry related molecules of GFRa2D2-D3, but it was clear from the number of contacts which was the true position. This was also confirmed by the analysis of conserved residues in the interaction surfaces. In the NRTN–GFRa2D1-D3 complex structure the 26-amino acid linker, which connects GFRa2 D1 and D2, was missing in the electron density. N-terminal sequencing confirmed that the linker was cleaved, even though the structural integrity of the receptor was intact. The last residue from D1 that is well-defined in electron density (Val-131) was located more than 35 Å from the first residue of D2 (Ser-158), but a 26-amino acid linker could span this distance. No glycosylation was visible in the electron density. Data collection and refinement statistics are available in Table S3.
Structure and sequence analysis and mapping of conserved residues
All residues in the GFRa2 domain and subunit interfaces are listed in Table S1. Interaction surface areas were calculated with Pisa (71), and residues in the interaction surfaces were identified with the program Contact (71). Sequences of GFRa1–3 from different species, with a sequence identity to human GFRa2 ranging from 33 to 99%, were iteratively gathered and aligned using ClustalW (72). The sequences were analyzed using the program Indonesia. Around 20% of the residues were selected because of their high-sequence conservation throughout the GFRa family (Fig. S3), and these were mapped on the NRTN–GFRa2D1-D3 crystal structure (Fig. 4) in PyMOL.
In vivo pharmacokinetic analysis in rats
Ten healthy Wistar rats (males, Charles River), non-fasted, with body weight of 250–350 g were used in the PK studies of the R149A/R152A/R158A and the wildtype NRTN protein. The study was approved by the Göteborg Preclinical Ethical Committee.
The rats received either one single (bolus) intravenous (i.v.) dose of 1 mg/kg via tail (n = 2) or one subcutaneous dose of 1 mg/kg (n = 3) of NRTN analogues (R149A/R152A/R158A or the wildtype NRTN) with a dosing volume of 10 ml/kg. Plasma samples were collected at each of the following time points: pre, 0.08, 0.33, 1, 1.75, 3.5, 7, 24, and 48 h after i.v. administration, whereas plasma samples were collected at pre, 0.17, 0.5, 1, 1.75, 3.5, 7, 24, 48, and 96 h after subcutaneous administration. The plasma samples were centrifuged at 14,000 rpm for 5 min at 4 °C and stored in plastic Eppendorf tubes placed on ice during handling and stored at −80 °C pending quantification of NRTN.
Quantification and data analysis of human neurturin analogues in rat plasma PK samples
A sandwich immunoassay method, with a biotinylated polyclonal antibody against human NRTN as capture reagent and a sulfo-tag–labeled mouse monoclonal antibody specific for human NRTN as detection reagent, was set up and used for quantification of human NRTN analogues in rat plasma samples on the Meso Scale Discovery system (Rockville, MD).
Assay buffer (1% w/v membrane blocking agent (GE Healthcare, Uppsala, Sweden) in phosphate-buffered saline containing 0.01% Tween, pH 7.4), 150 μl/well, was added to an MSD streptavidin gold plate streptavidin gold (MSD, L15SA-1/L11SA-1, Rockville, MD) and incubated for 60 min at room temperature on a shaker at 300 rpm. Then, the biotin-labeled rabbit polyclonal capturing antibody to NRTN (Abcam, ab83126, Cambridge, UK) was then diluted to a concentration of 4 μg/ml with assay buffer, and 25 μl/well was added and incubated for 1 h at room temperature on a shaker at 300 rpm. The solution was then discarded, and the wells were washed with wash buffer (0.05% Tween (v/v) in 10% PBS (v/v), pH 7.4) three times using a plate washer (3·270 μl). Standards, controls, and samples were analyzed in 50% rat plasma. The standard (R149A/R152A/R158A or wildtype NRTN protein) was diluted to 1050, 350, 117, 38.9, 13.0, 4.32, 1.44, 0.48, 0.16, 0.53, and 0.018 ng/ml, and the control was diluted to 60.7, 48.3, 2.89, and 0.093 ng/ml. Duplicates (25 μl) of diluted samples, standards, blanks, and controls were added to the plate and incubated for 120 min at room temperature on a shaker at 300 rpm. The washing step was repeated three times, whereupon the sulfo tag-labeled anti-hNRTN IgG2b mAb, (R&D Systems, clone 126422, Abingdon, UK) diluted to 0.25 μg/ml in assay buffer was added (25 μl/well). The plate was incubated for 60 min at room temperature on a shaker at 300 rpm in the dark. The washing procedure was repeated another three times, and then 150 μl of Read Buffer (MSD, Rockville, MD) was added to all wells. The plate was read on the MSD plate reader within 15 min from addition of read buffer.
Data analysis
The pharmacokinetic analysis was based on mean protein concentrations from two individual rats per time point after i.v. administration and from three individual rats per time point after s.c. administration.
PK parameters were determined based on the two-compartment pharmacokinetic analysis after i.v. administration and one-compartment pharmacokinetic analysis after s.c. administration using WinNonlin Professional version 5.2 (Pharsight Corp., Mountain View, CA). The pharmacokinetic analysis was based on mean protein concentrations from two individual rats per time point after i.v. administration and from three individual rats per time point after s.c. administration. The following PK parameters were obtained: the volume of central compartment (Vc); the volume of tissue compartment (Vt); the systemic plasma clearance (CL); the inter-compartmental constant (Cld); after s.c. administration, the volume of distribution (V_F); and the systemic plasma clearance (CL_F). The terminal half-life (t½), the maximal concentration (Cmax), area under curve (AUC), and the bioavailability of each NRTN protein were also obtained.
Author contributions
J. S., G. D., P. D., M. S.-W., G. J. R., and R. G. R. conceptualization; J. S., G. D., P. J., P. D., J. M. B., G. J. R., and R. G. R. data curation; J. S., G. D., P. J., T. A., P. D., and R. G. R. formal analysis; J. S., G. D., L. Ö., B. X., P. J., T. A., A. A., P. D., J. M. B., M. S.-W., and R. G. R. investigation; J. S., G. D., L. Ö., B. X., P. J., T. A., A. A., P. D., J. M. B., M. S.-W., G. J. R., and R. G. R. methodology; J. S., G. D., and R. G. R. writing-original draft; J. S., G. D., L. Ö., B. X., P. J., T. A., A. A., P. D., J. M. B., M. S.-W., G. J. R., and R. G. R. writing-review and editing; R. G. R. project administration.
Supplementary Material
Acknowledgments
We thank Hani Jouihan for help with activity measurements and Dr. Uwe Andag (Evotec AG, Göttingen, Germany) for the kind gift of the TGW cell line. We also thank Dr. Stephanie Monaco and Dr. Elspeth Gordon (ESRF, Grenoble, France) for support during data collection.
All authors were employed by AstraZeneca/MedImmune when producing the data presented in this manuscript.
This article contains Figs. S1–S7 and Tables S1–S3.
The atomic coordinates and structure factors (codes 5NMZ, 5MR5, and 5MR4) have been deposited in the Protein Data Bank (http://wwpdb.org/).
- NRTN
- neurturin
- GDNF
- glial cell-derived neurotrophic factor
- GFL
- GDNF family of ligands
- NCAM
- neural cell adhesion molecule
- RET
- rearranged during transfection
- MAPK
- mitogen-activated protein kinase
- ARTN
- artemin
- HS
- heparan sulfate
- ECM
- extracellular matrix
- PK
- pharmacokinetic
- PDB
- Protein Data Bank
- ITC
- isothermal titration calorimetry
- BisTris
- 2-[bis(2-hydroxyethyl)amino]-2-(hydroxymethyl)propane-1,3-diol
- SPR
- surface plasmon resonance
- AUC
- area under the curve
- GFRAL
- GFRa-like
- r.m.s.d.
- root mean square deviation
- RI
- refractive index
- GPI
- glycosylphosphatidylinositol
- FGF
- fibroblast growth factor
- MSD
- Meso Scale Discovery.
References
- 1. Airaksinen M. S., and Saarma M. (2002) The GDNF family: signaling, biological functions and therapeutic value. Nat. Rev. Neurosci. 3, 383–394 10.1038/nrn812 [DOI] [PubMed] [Google Scholar]
- 2. Kotzbauer P. T., Lampe P. A., Heuckeroth R. O., Golden J. P., Creedon D. J., Johnson E. M. Jr, and Milbrandt J. (1996) Neurturin, a relative of glial-cell-line-derived neurotrophic factor. Nature 384, 467–470 10.1038/384467a0 [DOI] [PubMed] [Google Scholar]
- 3. Marks W. J. Jr., Bartus R. T., Siffert J., Davis C. S., Lozano A., Boulis N., Vitek J., Stacy M., Turner D., Verhagen L., Bakay R., Watts R., Guthrie B., Jankovic J., Simpson R., et al. (2010) Gene delivery of AAV2-neurturin for Parkinson's disease: a double-blind, randomised, controlled trial. Lancet Neurol. 9, 1164–1172 10.1016/S1474-4422(10)70254-4 [DOI] [PubMed] [Google Scholar]
- 4. Fjord-Larsen L., Johansen J. L., Kusk P., Tornøe J., Grønborg M., Rosenblad C., and Wahlberg L. U. (2005) Efficient in vivo protection of nigral dopaminergic neurons by lentiviral gene transfer of a modified neurturin construct. Exp. Neurol. 195, 49–60 10.1016/j.expneurol.2005.03.006 [DOI] [PubMed] [Google Scholar]
- 5. Horger B. A., Nishimura M. C., Armanini M. P., Wang L. C., Poulsen K. T., Rosenblad C., Kirik D., Moffat B., Simmons L., Johnson E. Jr., Milbrandt J., Rosenthal A., Bjorklund A., Vandlen R. A., Hynes M. A., and Phillips H. S. (1998) Neurturin exerts potent actions on survival and function of midbrain dopaminergic neurons. J. Neurosci. 18, 4929–4937 [DOI] [PMC free article] [PubMed] [Google Scholar]
- 6. Lin L. F., Doherty D. H., Lile J. D., Bektesh S., and Collins F. (1993) GDNF: a glial cell line-derived neurotrophic factor for midbrain dopaminergic neurons. Science 260, 1130–1132 10.1126/science.8493557 [DOI] [PubMed] [Google Scholar]
- 7. Baloh R. H., Tansey M. G., Lampe P. A., Fahrner T. J., Enomoto H., Simburger K. S., Leitner M. L., Araki T., Johnson E. M. Jr., and Milbrandt J. (1998) Artemin, a novel member of the GDNF ligand family, supports peripheral and central neurons and signals through the GFRα3-RET receptor complex. Neuron 21, 1291–1302 10.1016/S0896-6273(00)80649-2 [DOI] [PubMed] [Google Scholar]
- 8. Milbrandt J., de Sauvage F. J., Fahrner T. J., Baloh R. H., Leitner M. L., Tansey M. G., Lampe P. A., Heuckeroth R. O., Kotzbauer P. T., Simburger K. S., Golden J. P., Davies J. A., Vejsada R., Kato A. C., Hynes M., et al. (1998) Persephin, a novel neurotrophic factor related to GDNF and neurturin. Neuron 20, 245–253 10.1016/S0896-6273(00)80453-5 [DOI] [PubMed] [Google Scholar]
- 9. Airaksinen M. S., Titievsky A., and Saarma M. (1999) GDNF family neurotrophic factor signaling: four masters, one servant? Mol. Cell. Neurosci. 13, 313–325 10.1006/mcne.1999.0754 [DOI] [PubMed] [Google Scholar]
- 10. Lindahl M., Poteryaev D., Yu L., Arumae U., Timmusk T., Bongarzone I., Aiello A., Pierotti M. A., Airaksinen M. S., and Saarma M. (2001) Human glial cell line-derived neurotrophic factor receptor α4 is the receptor for persephin and is predominantly expressed in normal and malignant thyroid medullary cells. J. Biol. Chem. 276, 9344–9351 10.1074/jbc.M008279200 [DOI] [PubMed] [Google Scholar]
- 11. Cik M., Masure S., Lesage A. S., Van Der Linden I., Van Gompel P., Pangalos M. N., Gordon R. D., and Leysen J. E. (2000) Binding of GDNF and neurturin to human GDNF family receptor α1 and α2. Influence of cRET and cooperative interactions. J. Biol. Chem. 275, 27505–27512 [DOI] [PubMed] [Google Scholar]
- 12. Sanicola M., Hession C., Worley D., Carmillo P., Ehrenfels C., Walus L., Robinson S., Jaworski G., Wei H., Tizard R., Whitty A., Pepinsky R. B., and Cate R. L. (1997) Glial cell line-derived neurotrophic factor-dependent RET activation can be mediated by two different cell-surface accessory proteins. Proc. Natl. Acad. Sci. U.S.A. 94, 6238–6243 10.1073/pnas.94.12.6238 [DOI] [PMC free article] [PubMed] [Google Scholar]
- 13. Yang L., Chang C. C., Sun Z., Madsen D., Zhu H., Padkjær S. B., Wu X., Huang T., Hultman K., Paulsen S. J., Wang J., Bugge A., Frantzen J. B., Nørgaard P., Jeppesen J. F., et al. (2017) GFRAL is the receptor for GDF15 and is required for the anti-obesity effects of the ligand. Nat. Med. 23, 1158–1166 10.1038/nm.4394 [DOI] [PubMed] [Google Scholar]
- 14. Mullican S. E., Lin-Schmidt X., Chin C. N., Chavez J. A., Furman J. L., Armstrong A. A., Beck S. C., South V. J., Dinh T. Q., Cash-Mason T. D., Cavanaugh C. R., Nelson S., Huang C., Hunter M. J., and Rangwala S. M. (2017) GFRAL is the receptor for GDF15 and the ligand promotes weight loss in mice and nonhuman primates. Nat. Med. 23, 1150–1157 10.1038/nm.4392 [DOI] [PubMed] [Google Scholar]
- 15. Hsu J. Y., Crawley S., Chen M., Ayupova D. A., Lindhout D. A., Higbee J., Kutach A., Joo W., Gao Z., Fu D., To C., Mondal K., Li B., Kekatpure A., Wang M., et al. (2017) Non-homeostatic body weight regulation through a brainstem-restricted receptor for GDF15. Nature 550, 255–259 10.1038/nature24042 [DOI] [PubMed] [Google Scholar]
- 16. Emmerson P. J., Wang F., Du Y., Liu Q., Pickard R. T., Gonciarz M. D., Coskun T., Hamang M. J., Sindelar D. K., Ballman K. K., Foltz L. A., Muppidi A., Alsina-Fernandez J., Barnard G. C., Tang J. X., et al. (2017) The metabolic effects of GDF15 are mediated by the orphan receptor GFRAL. Nat. Med. 23, 1215–1219 10.1038/nm.4393 [DOI] [PubMed] [Google Scholar]
- 17. Klein R. D., Sherman D., Ho W. H., Stone D., Bennett G. L., Moffat B., Vandlen R., Simmons L., Gu Q., Hongo J. A., Devaux B., Poulsen K., Armanini M., Nozaki C., Asai N., et al. (1997) A GPI-linked protein that interacts with Ret to form a candidate neurturin receptor. Nature 387, 717–721 10.1038/42722 [DOI] [PubMed] [Google Scholar]
- 18. Durbec P., Marcos-Gutierrez C. V., Kilkenny C., Grigoriou M., Wartiowaara K., Suvanto P., Smith D., Ponder B., Costantini F., and Saarma M. (1996) GDNF signaling through the Ret receptor tyrosine kinase. Nature 381, 789–793 10.1038/381789a0 [DOI] [PubMed] [Google Scholar]
- 19. Trupp M., Arenas E., Fainzilber M., Nilsson A. S., Sieber B. A., Grigoriou M., Kilkenny C., Salazar-Grueso E., Pachnis V., and Arumäe U. (1996) Functional receptor for GDNF encoded by the c-ret proto-oncogene. Nature 381, 785–789 10.1038/381785a0 [DOI] [PubMed] [Google Scholar]
- 20. Worby C. A., Vega Q. C., Zhao Y., Chao H. H., Seasholtz A. F., and Dixon J. E. (1996) Glial cell line-derived neurotrophic factor signals through the RET receptor and activates mitogen-activated protein kinase. J. Biol. Chem. 271, 23619–23622 10.1074/jbc.271.39.23619 [DOI] [PubMed] [Google Scholar]
- 21. Paratcha G., Ledda F., and Ibáñez C. F. (2003) The neural cell adhesion molecule NCAM is an alternative signaling receptor for GDNF family ligands. Cell 113, 867–879 10.1016/S0092-8674(03)00435-5 [DOI] [PubMed] [Google Scholar]
- 22. Alfano I., Vora P., Mummery R. S., Mulloy B., and Rider C. C. (2007) The major determinant of the heparin binding of glial cell-line-derived neurotrophic factor is near the N terminus and is dispensable for receptor binding. Biochem. J. 404, 131–140 10.1042/BJ20061747 [DOI] [PMC free article] [PubMed] [Google Scholar]
- 23. Lin L. F., Zhang T. J., Collins F., and Armes L. G. (1994) Purification and initial characterization of rat B49 glial cell line-derived neurotrophic factor. J. Neurochem. 63, 758–768 [DOI] [PubMed] [Google Scholar]
- 24. Silvian L., Jin P., Carmillo P., Boriack-Sjodin P. A., Pelletier C., Rushe M., Gong B., Sah D., Pepinsky B., and Rossomando A. (2006) Artemin crystal structure reveals insights into heparan sulfate binding. Biochemistry 45, 6801–6812 10.1021/bi060035x [DOI] [PubMed] [Google Scholar]
- 25. Bespalov M. M., Sidorova Y. A., Tumova S., Ahonen-Bishopp A., Magalhães A. C., Kulesskiy E., Paveliev M., Rivera C., Rauvala H., and Saarma M. (2011) Heparan sulfate proteoglycan syndecan-3 is a novel receptor for GDNF, neurturin, and artemin. J. Cell Biol. 192, 153–169 10.1083/jcb.201009136 [DOI] [PMC free article] [PubMed] [Google Scholar]
- 26. Rickard S. M., Mummery R. S., Mulloy B., and Rider C. C. (2003) The binding of human glial cell line-derived neurotrophic factor to heparin and heparan sulfate: importance of 2-O-sulfate groups and effect on its interaction with its receptor, GFRα1. Glycobiology 13, 419–426 10.1093/glycob/cwg046 [DOI] [PubMed] [Google Scholar]
- 27. Tansey M. G., Baloh R. H., Milbrandt J., and Johnson E. M. Jr. (2000) GFRα-mediated localization of RET to lipid rafts is required for effective downstream signaling, differentiation, and neuronal survival. Neuron 25, 611–623 10.1016/S0896-6273(00)81064-8 [DOI] [PubMed] [Google Scholar]
- 28. Kirik D., Cederfjäll E., Halliday G., and Petersén Å. (2017) Gene therapy for Parkinson's disease: disease modification by GDNF family of ligands. Neurobiol. Dis. 97, 179–188 10.1016/j.nbd.2016.09.008 [DOI] [PubMed] [Google Scholar]
- 29. Bartus R. T., and Johnson E. M. Jr. (2017) Clinical tests of neurotrophic factors for human neurodegenerative diseases, part 2: where do we stand and where must we go next? Neurobiol. Dis. 97, 169–178 10.1016/j.nbd.2016.03.026 [DOI] [PubMed] [Google Scholar]
- 30. Barker R. A., Drouin-Ouellet J., and Parmar M. (2015) Cell-based therapies for Parkinson disease-past insights and future potential. Nat. Rev. Neurol. 11, 492–503 10.1038/nrneurol.2015.123 [DOI] [PubMed] [Google Scholar]
- 31. Salvatore M. F., Ai Y., Fischer B., Zhang A. M., Grondin R. C., Zhang Z., Gerhardt G. A., and Gash D. M. (2006) Point source concentration of GDNF may explain failure of phase II clinical trial. Exp. Neurol. 202, 497–505 10.1016/j.expneurol.2006.07.015 [DOI] [PubMed] [Google Scholar]
- 32. Heuckeroth R. O., Enomoto H., Grider J. R., Golden J. P., Hanke J. A., Jackman A., Molliver D. C., Bardgett M. E., Snider W. D., Johnson E. M. Jr., and Milbrandt J. (1999) Gene targeting reveals a critical role for neurturin in the development and maintenance of enteric, sensory, and parasympathetic neurons. Neuron 22, 253–263 10.1016/S0896-6273(00)81087-9 [DOI] [PubMed] [Google Scholar]
- 33. Mauffray M., Domingues O., Hentges F., Zimmer J., Hanau D., and Michel T. (2015) Neurturin influences inflammatory responses and airway remodeling in different mouse asthma models. J. Immunol. 194, 1423–1433 10.4049/jimmunol.1402496 [DOI] [PubMed] [Google Scholar]
- 34. Trevaskis J. L., Sacramento C. B., Jouihan H., Ali S., Le Lay J., Oldham S., Bhagroo N., Boland B. B., Cann J., Chang Y., O'Day T., Howard V., Reers C., Winzell M. S., Smith D. M., et al. (2017) Neurturin and a GLP-1 analogue act synergistically to alleviate diabetes in Zucker diabetic fatty rats. Diabetes 66, 2007–2018 10.2337/db16-0916 [DOI] [PubMed] [Google Scholar]
- 35. Eigenbrot C., and Gerber N. (1997) X-ray structure of glial cell-derived neurotrophic factor at 1.9 A resolution and implications for receptor binding. Nat. Struct. Biol. 4, 435–438 10.1038/nsb0697-435 [DOI] [PubMed] [Google Scholar]
- 36. Goodman K. M., Kjær S., Beuron F., Knowles P. P., Nawrotek A., Burns E. M., Purkiss A. G., George R., Santoro M., Morris E. P., and McDonald N. Q. (2014) RET recognition of GDNF-GFRα1 ligand by a composite binding site promotes membrane-proximal self-association. Cell Rep. 8, 1894–1904 10.1016/j.celrep.2014.08.040 [DOI] [PubMed] [Google Scholar]
- 37. Virtanen H., Yang J., Bespalov M. M., Hiltunen J. O., Leppänen V. M., Kalkkinen N., Goldman A., Saarma M., and Runeberg-Roos P. (2005) The first cysteine-rich domain of the receptor GFRα1 stabilizes the binding of GDNF. Biochem. J. 387, 817–824 10.1042/BJ20041257 [DOI] [PMC free article] [PubMed] [Google Scholar]
- 38. Wang X., Baloh R. H., Milbrandt J., and Garcia K. C. (2006) Structure of artemin complexed with its receptor GFRα3: convergent recognition of glial cell line-derived neurotrophic factors. Structure 14, 1083–1092 10.1016/j.str.2006.05.010 [DOI] [PubMed] [Google Scholar]
- 39. Parkash V., Leppänen V. M., Virtanen H., Jurvansuu J. M., Bespalov M. M., Sidorova Y. A., Runeberg-Roos P., Saarma M., and Goldman A. (2008) The structure of the glial cell line-derived neurotrophic factor-coreceptor complex: insights into RET signaling and heparin binding. J. Biol. Chem. 283, 35164–35172 10.1074/jbc.M802543200 [DOI] [PMC free article] [PubMed] [Google Scholar]
- 40. Scott R. P., and Ibáñez C. F. (2001) Determinants of ligand binding specificity in the glial cell line-derived neurotrophic factor family receptor α S. J. Biol. Chem. 276, 1450–1458 10.1074/jbc.M006157200 [DOI] [PubMed] [Google Scholar]
- 41. Sjöstrand D., and Ibáñez C. F. (2008) Insights into GFRα1 regulation of neural cell adhesion molecule (NCAM) function from structure-function analysis of the NCAM/GFRα1 receptor complex. J. Biol. Chem. 283, 13792–13798 10.1074/jbc.M800283200 [DOI] [PubMed] [Google Scholar]
- 42. Masure S., Cik M., Hoefnagel E., Nosrat C. A., Van der Linden I., Scott R., Van Gompel P., Lesage A. S., Verhasselt P., Ibáñez C. F., and Gordon R. D. (2000) Mammalian GFRα-4, a divergent member of the GFRα family of coreceptors for glial cell line-derived neurotrophic factor family ligands, is a receptor for the neurotrophic factor persephin. J. Biol. Chem. 275, 39427–39434 10.1074/jbc.M003867200 [DOI] [PubMed] [Google Scholar]
- 43. Hätinen T., Holm L., and Airaksinen M. S. (2007) Loss of neurturin in frog–comparative genomics study of GDNF family ligand-receptor pairs. Mol. Cell. Neurosci. 34, 155–167 10.1016/j.mcn.2006.10.009 [DOI] [PubMed] [Google Scholar]
- 44. Vance D., Shah M., Joshi A., and Kane R. S. (2008) Polyvalency: a promising strategy for drug design. Biotechnol. Bioeng. 101, 429–434 10.1002/bit.22056 [DOI] [PubMed] [Google Scholar]
- 45. Vauquelin G., and Charlton S. J. (2013) Exploring avidity: understanding the potential gains in functional affinity and target residence time of bivalent and heterobivalent ligands. Br. J. Pharmacol. 168, 1771–1785 10.1111/bph.12106 [DOI] [PMC free article] [PubMed] [Google Scholar]
- 46. Schlee S., Carmillo P., and Whitty A. (2006) Quantitative analysis of the activation mechanism of the multicomponent growth-factor receptor Ret. Nat. Chem. Biol. 2, 636–644 10.1038/nchembio823 [DOI] [PubMed] [Google Scholar]
- 47. Treanor J. J., Goodman L., de Sauvage F., Stone D. M., Poulsen K. T., Beck C. D., Gray C., Armanini M. P., Pollock R. A., Hefti F., Phillips H. S., Goddard A., Moore M. W., Buj-Bello A., Davies A. M., et al. (1996) Characterization of a multicomponent receptor for GDNF. Nature 382, 80–83 10.1038/382080a0 [DOI] [PubMed] [Google Scholar]
- 48. Tanaka M., Xiao H., Hirata Y., and Kiuchi K. (2003) A rapid assay for glial cell line-derived neurotrophic factor and neurturin based on transfection of cells with tyrosine hydroxylase promoter-luciferase construct. Brain Res. Brain Res. Protoc. 11, 119–122 10.1016/S1385-299X(03)00023-0 [DOI] [PubMed] [Google Scholar]
- 49. Kjaer S., and Ibáñez C. F. (2003) Identification of a surface for binding to the GDNF-GFRα1 complex in the first cadherin-like domain of RET. J. Biol. Chem. 278, 47898–47904 10.1074/jbc.M309772200 [DOI] [PubMed] [Google Scholar]
- 50. Paratcha G., Ledda F., Baars L., Coulpier M., Besset V., Anders J., Scott R., and Ibáñez C. F. (2001) Released GFRα1 potentiates downstream signaling, neuronal survival, and differentiation via a novel mechanism of recruitment of c-Ret to lipid rafts. Neuron 29, 171–184 10.1016/S0896-6273(01)00188-X [DOI] [PubMed] [Google Scholar]
- 51. Simons K., and Ikonen E. (1997) Functional rafts in cell membranes. Nature 387, 569–572 10.1038/42408 [DOI] [PubMed] [Google Scholar]
- 52. Barnett M. W., Fisher C. E., Perona-Wright G., and Davies J. A. (2002) Signaling by glial cell line-derived neurotrophic factor (GDNF) requires heparan sulphate glycosaminoglycan. J. Cell Sci. 115, 4495–4503 10.1242/jcs.00114 [DOI] [PubMed] [Google Scholar]
- 53. Davies J. A., Yates E. A., and Turnbull J. E. (2003) Structural determinants of heparan sulphate modulation of GDNF signaling. Growth Factors 21, 109–119 10.1080/08977190310001621005 [DOI] [PubMed] [Google Scholar]
- 54. Kulahin N., Rudenko O., Kiselyov V., Poulsen F. M., Berezin V., and Bock E. (2005) Modulation of the homophilic interaction between the first and second Ig modules of neural cell adhesion molecule by heparin. J. Neurochem. 95, 46–55 10.1111/j.1471-4159.2005.03338.x [DOI] [PubMed] [Google Scholar]
- 55. Kjaer S., Hanrahan S., Totty N., and McDonald N. Q. (2010) Mammal-restricted elements predispose human RET to folding impairment by HSCR mutations. Nat. Struct. Mol. Biol. 17, 726–731 10.1038/nsmb.1808 [DOI] [PubMed] [Google Scholar]
- 56. Schlessinger J., Lax I., and Lemmon M. (1995) Regulation of growth factor activation by proteoglycans: what is the role of the low affinity receptors? Cell 83, 357–360 10.1016/0092-8674(95)90112-4 [DOI] [PubMed] [Google Scholar]
- 57. Li L., Chen H., Wang M., Chen F., Gao J., Sun S., Li Y., and Gao D. (2017) NCAM-140 translocation into lipid rafts mediates the neuroprotective effects of GDNF. Mol. Neurobiol. 54, 2739–2751 [DOI] [PubMed] [Google Scholar]
- 58. Tsui C. C., Gabreski N. A., Hein S. J., and Pierchala B. A. (2015) Lipid rafts are physiologic membrane microdomains necessary for the morphogenic and developmental functions of Glial cell line-derived neurotrophic factor in vivo. J. Neurosci. 35, 13233–13243 10.1523/JNEUROSCI.2935-14.2015 [DOI] [PMC free article] [PubMed] [Google Scholar]
- 59. Atanasova M., and Whitty A. (2015) Activation of the RET receptor tyrosine kinase by agonist antibodies results in distinct signaling effects. FASEB J. 29, Suppl. 1 (Abstr. 728.44) [Google Scholar]
- 60. Piltonen M., Bespalov M. M., Ervasti D., Matilainen T., Sidorova Y. A., Rauvala H., Saarma M., and Männistö P. T. (2009) Heparin-binding determinants of GDNF reduce its tissue distribution but are beneficial for the protection of nigral dopaminergic neurons. Exp. Neurol. 219, 499–506 10.1016/j.expneurol.2009.07.002 [DOI] [PubMed] [Google Scholar]
- 61. Hamilton J. F., Morrison P. F., Chen M. Y., Harvey-White J., Pernaute R. S., Phillips H., Oldfield E., and Bankiewicz K. S. (2001) Heparin coinfusion during convection-enhanced delivery (CED) increases the distribution of the glial-derived neurotrophic factor (GDNF) ligand family in rat striatum and enhances the pharmacological activity of neurturin. Exp. Neurol. 168, 155–161 10.1006/exnr.2000.7571 [DOI] [PubMed] [Google Scholar]
- 62. Runeberg-Roos P., Piccinini E., Penttinen A. M., Mätlik K., Heikkinen H., Kuure S., Bespalov M. M., Peränen J., Garea-Rodríguez E., Fuchs E., Airavaara M., Kalkkinen N., Penn R., and Saarma M. (2016) Developing therapeutically more efficient neurturin variants for treatment of Parkinson's disease. Neurobiol. Dis. 96, 335–345 10.1016/j.nbd.2016.07.008 [DOI] [PubMed] [Google Scholar]
- 63. Smith R. C., O'Bryan L. M., Mitchell P. J., Leung D., Ghanem M., Wilson J. M., Hanson J. C., Sossick S., Cooper J., Huang L., Merchant K. M., Lu J., and O'Neill M. J. (2015) Increased brain bio-distribution and chemical stability and decreased immunogenicity of an engineered variant of GDNF. Exp. Neurol. 267, 165–176 10.1016/j.expneurol.2015.03.002 [DOI] [PubMed] [Google Scholar]
- 64. Gash D. M., Zhang Z., Ai Y., Grondin R., Coffey R., and Gerhardt G. A. (2005) Trophic factor distribution predicts functional recovery in parkinsonian monkeys. Ann. Neurol. 58, 224–233 10.1002/ana.20549 [DOI] [PubMed] [Google Scholar]
- 65. Stewart R., Thom G., Levens M., Güler-Gane G., Holgate R., Rudd P. M., Webster C., Jermutus L., and Lund J. (2011) A variant human IgG1-Fc mediates improved ADCC. Protein Eng. Des. Sel. 24, 671–678 10.1093/protein/gzr015 [DOI] [PubMed] [Google Scholar]
- 66. Daramola O., Stevenson J., Dean G., Hatton D., Pettman G., Holmes W., and Field R. (2014) A high-yielding CHO transient system: coexpression of genes encoding EBNA-1 and GS enhances transient protein expression. Biotechnol. Prog. 30, 132–141 [DOI] [PubMed] [Google Scholar]
- 67. Kabsch W. (2010) XDS. Acta Crystallogr. D Biol. Crystallogr. 66, 125–132 10.1107/S0907444909047337 [DOI] [PMC free article] [PubMed] [Google Scholar]
- 68. Dolinsky T. J., Nielsen J. E., McCammon J. A., and Baker N. A. (2004) PDB2PQR: an automated pipeline for the setup of Poisson-Boltzmann electrostatics calculations. Nucleic Acids Res. 32, W665–W667 10.1093/nar/gkh381 [DOI] [PMC free article] [PubMed] [Google Scholar]
- 69. Vonrhein C., Flensburg C., Keller P., Sharff A., Smart O., Paciorek W., Womack T., and Bricogne G. (2011) Data processing and analysis with the autoPROC toolbox. Acta Crystallogr. D Biol. Crystallogr. 67, 293–302 10.1107/S0907444911007773 [DOI] [PMC free article] [PubMed] [Google Scholar]
- 70. Evans P. (2006) Scaling and assessment of data quality. Acta Crystallogr. D Biol. Crystallogr. 62, 72–82 10.1107/S0907444905036693 [DOI] [PubMed] [Google Scholar]
- 71. Winn M. D., Ballard C. C., Cowtan K. D., Dodson E. J., Emsley P., Evans P. R., Keegan R. M., Krissinel E. B., Leslie A. G., McCoy A., McNicholas S. J., Murshudov G. N., Pannu N. S., Potterton E. A., Powell H. R., et al. (2011) Overview of the CCP4 suite and current developments. Acta Crystallogr. D Biol. Crystallogr. 67, 235–242 10.1107/S0907444910045749 [DOI] [PMC free article] [PubMed] [Google Scholar]
- 72. Thompson J. D., Higgins D. G., and Gibson T. J. (1994) CLUSTAL W: improving the sensitivity of progressive multiple sequence alignment through sequence weighting, position-specific gap penalties and weight matrix choice. Nucleic Acids Res. 22, 4673–4680 10.1093/nar/22.22.4673 [DOI] [PMC free article] [PubMed] [Google Scholar]
Associated Data
This section collects any data citations, data availability statements, or supplementary materials included in this article.