

Abstract
Background and Purpose
Regulating P2X7 receptor‐mediated activation of NLRP3 inflammasomes could be a therapeutic strategy to treat alcoholic hepatosteatosis. We investigated whether this process was modulated by gentiopicroside, the main active secoiridoid glycoside from Gentiana manshurica Kitagawa.
Experimental Approach
In vivo models of acute and chronic alcoholic hepatosteatosis were established by intragastrically administered ethanol or using chronic plus binge ethanol feeding of Lieber‐DeCarli liquid diet to male C57BL/6 mice. In vitro, HepG2 cells were treated with ethanol. RAW 264.7 macrophages and murine bone marrow‐derived macrophages (BMDMs) were stimulated with LPS and ATP.
Key Results
In both the acute and chronic alcohol‐induced mouse hepatosteatosis models, gentiopicroside decreased serum aminotransferases and triglyceride accumulation. Up‐regulated SREBP1, down‐regulated PPARα and phosphorylated acetyl‐CoA carboxylase caused by acute and chronic alcohol feeding were modulated by gentiopicroside, through the elevation of LKB1 and AMPK. Suppression of P2X7 receptor‐NLRP3 activation by gentiopicroside inhibited IL‐1β production. In ethanol‐exposed HepG2 cells, gentiopicroside reduced lipogenesis and promoted lipid oxidation via activation of P2X7 receptor‐NLRP3 inflammasomes. Genetic or pharmacological blockade of P2X7 receptors enhanced AMPK activity and reduced SREBP1 expression in ethanol‐treated HepG2 cells. Gentiopicroside down‐regulated P2X7 receptor‐mediated inflammatory responses in LPS/ATP‐stimulated RAW 264.7 macrophages and BMDMs. IL‐1β from macrophages accelerated lipid accumulation in hepatocytes. Depleting macrophages by clodronate liposomes ameliorated alcoholic hepatosteatosis, and it was further alleviated by gentiopicroside.
Conclusions and Implications
Activation of LKB1/AMPK signalling by gentiopicroside was mediated by the P2X7 receptor‐NLRP3 inflammasome, suggesting the therapeutic value of blocking P2X7 receptors in the treatment of alcoholic hepatosteatosis.
Abbreviations
- ACC
acetyl‐CoA carboxylase
- ADH
alcohol dehydrogenase
- ALD
alcoholic liver disease
- ALT
alanine aminotransferase
- AMPK
AMP‐activated protein kinase
- AST
aspartate aminotransferase
- LKB1
liver kinase B1
- SREBP1
sterol regulatory element binding protein‐1
Introduction
Alcoholic liver disease (ALD) is caused by excess alcohol intake or binge drinking. The spectrum of ALD development pathologically includes alcoholic hepatic steatosis, alcoholic hepatitis, alcoholic hepatic fibrosis, cirrhosis and even superimposed hepatocellular carcinoma (Gao and Bataller, 2011). Abstinence is the most important therapy for patients with ALD, but it cannot reverse advanced ALD. For end‐stage ALD, the only definitive treatment is liver transplantation. Medical treatment for ALD has not changed significantly in several decades. Besides supportive therapy and nutritional management, several medical therapies, including corticosteroids and pentoxifylline, which are well‐established first‐line and second‐line therapies, have not been proven to improve survival (Akriviadis et al., 2000; Mathurin et al., 2011; Jaurigue and Cappell, 2014). Therefore, an ideal treatment for ALD should be effective, safe and selective.
Hepatic steatosis, characterized by lipid accumulation in hepatocytes, is the first stage of ALD in response to alcohol abuse, but this condition is usually reversible. High alcohol intake increases the cytosolic NADH/NAD+ ratio in hepatocytes and disrupts fatty acid β‐oxidation in the mitochondria (Hardman et al., 1991). Increased fatty acid synthesis and impaired β‐oxidation result in lipid accumulation. Thus, regulating lipid accumulation or lipolysis might block or postpone the progression from hepatic steatosis to hepatitis or hepatic fibrosis.
During the development of ALD, the imbalance between lipogenesis and fatty acid oxidation, which are regulated by sterol regulatory element binding protein‐1 (SREBP1) and http://www.guidetopharmacology.org/GRAC/ObjectDisplayForward?objectId=593, respectively, contributes to lipid accumulation and subsequent pathophysiological changes. Alcohol consumption directly or indirectly regulates transcription factors related to lipid metabolism and subsequently promotes fatty acid synthesis and inhibits fatty acid oxidation (Rakhshandehroo et al., 2010; Gao and Bataller, 2011).
Both SREBP1 and PPARα are modulated by the AMP‐activated protein kinase (http://www.guidetopharmacology.org/GRAC/ObjectDisplayForward?objectId=1540), which is a metabolic sensor in the regulation of cellular energy homeostasis (Sozio et al., 2011; Hu et al., 2012). AMPK is a serine–threonine protein kinase that can phosphorylate and subsequently inactivate http://www.guidetopharmacology.org/GRAC/FamilyDisplayForward?familyId=255#1263) (Gao and Bataller, 2011). Inhibiting AMPK activity by alcohol intake caused decreased phosphorylation and increased activity of ACC, thereby aggravating hepatic steatosis (You et al., 2004). Serine/threonine kinase 11 (also known as liver kinase B1, http://www.guidetopharmacology.org/GRAC/ObjectDisplayForward?objectId=2212) is constitutively active and functions as an upstream kinase for Thr172 of AMPK (Alexander and Walker, 2011). The activation of the LKB1‐AMPK axis will accelerate the rate of fatty acid oxidation and repress lipogenesis by modulating PPARα and SREBP1 activities.
Excessive lipid accumulation induced by prolonged/chronic alcohol intake results in direct or indirect damages to hepatocytes and in inflammation with increased expression of pro‐inflammatory cytokines. Dysfunction of hepatocytes, infiltration of circulating monocytes, and activation of hepatic resident macrophages (Kupffer cells), are central to the pathogenesis of alcoholic steatohepatitis; Kupffer cells express a range of chemokines and pro‐inflammatory cytokines, including http://www.guidetopharmacology.org/GRAC/LigandDisplayForward?ligandId=4974 (Tacke and Zimmermann, 2014). IL‐1β release requires activation of http://www.guidetopharmacology.org/GRAC/ObjectDisplayForward?objectId=1617 via NOD‐like receptors (NLRs). Among these NLRs, http://www.guidetopharmacology.org/GRAC/ObjectDisplayForward?objectId=1770 forms an inflammasome complex, which is activated by pathogens and danger signals. Upon activation, NLRP3 recruits the inflammasome‐adaptor protein ASC, which in turn recruits caspase‐1. Finally, caspase‐1 clustering allows pro‐IL‐1β cleavage (Abderrazak et al., 2015). Although all liver cell types are, in principle, able to mediate inflammasome activities (Boaru et al., 2012), NLRP3 is prominently expressed in Kupffer cells and moderately expressed in hepatic stellate cells and hepatocytes (Boaru et al., 2015).
Gut‐derived signals, such as http://www.guidetopharmacology.org/GRAC/LigandDisplayForward?ligandId=5019, which promote hepatic injury via induction of Kupffer cell activation (Mandrekar and Szabo, 2009), provide the first signal for the up‐regulation of inflammatory mediators through http://www.guidetopharmacology.org/GRAC/ObjectDisplayForward?objectId=1754). Also, the disturbances in http://www.guidetopharmacology.org/GRAC/LigandDisplayForward?tab=biology&ligandId=1713 homeostasis induce mitochondrial dysfunction during the pathogenesis of ALD (Petrasek et al., 2012), indicating that a high level of ATP, which acts as a danger signal, is involved in alcohol‐induced liver inflammation. The P2X7 receptor, an ATP‐gated ion channel, is activated by high concentrations of ATP. We have postulated that P2X7 receptor activation by ATP, a secondary signal, is critically important in the pathogenesis of liver steatosis. We have reported that blockade of the P2X7 receptor‐NLRP3 inflammasome axis represented a potential therapeutic target for liver fibrosis (Jiang et al., 2017). However, expression of P2X7 receptors and their function in hepatocytes remain uncertain. Therefore, we hypothesized that (i) P2X7 receptor‐mediated activation of the NLRP3 inflammasome might be involved in alcohol‐mediated down‐regulation of the LKB1‐AMPK pathway in hepatocytes; (b) P2X7 receptor activation promotes NLRP3 inflammasome‐mediated release of IL‐1β in macrophages; and (c) inhibition of the IL‐1β secreted from macrophages might be beneficial to the steatotic phenotype of hepatocytes (Supporting Information Figure S1). According to these hypotheses, low MW inhibitors that regulate P2X7 receptor‐coupled activation of NLRP3 inflammasomes might be potential therapeutic candidates for treating alcoholic hepatosteatosis.
Gentiana manshurica Kitagawa, a gentian plant (Gentianaceae) that is abundantly distributed in north‐eastern China, has been used traditionally as a herbal hepatoprotectant by Chinese people. Gentiopicroside (PubChem CID: 88708, Figure 1A), the main active secoiridoid glycoside of Gentiana manshurica Kitagawa, is associated with the significant pharmacological activities of extracts of this plant, such as hepatoprotective (Mihailovic et al., 2014; Tang et al., 2016) and anti‐inflammatory (Zhao et al., 2015) activities. Previously, we have reported that extracts of Gentiana manshurica Kitagawa containing gentiopicroside could prevent alcoholic acute liver steatosis by scavenging free radicals and inhibiting fatty acid synthesis (Lian et al., 2010a). However, whether and how gentiopicroside protected the liver from chronic alcohol‐induced hepatic steatosis remained unclear. The current work was designed to determine whether and how gentiopicroside suppressed P2X7 receptor‐NLRP3 inflammasome‐mediated, acute‐to‐chronic alcoholic hepatosteatosis through the modulation of LKB1‐AMPK signalling. Our results showed that gentiopicroside inhibited release of IL‐1β from macrophages through its action on P2X7 receptor‐mediated activation of inflammasomes and that gentiopicroside interfered with lipid metabolism in hepatocytes through cell–cell crosstalk with macrophages (Supporting Information Figure S1), revealing the therapeutic value of P2X7 receptor blockade in the treatment of ALD.
Figure 1.
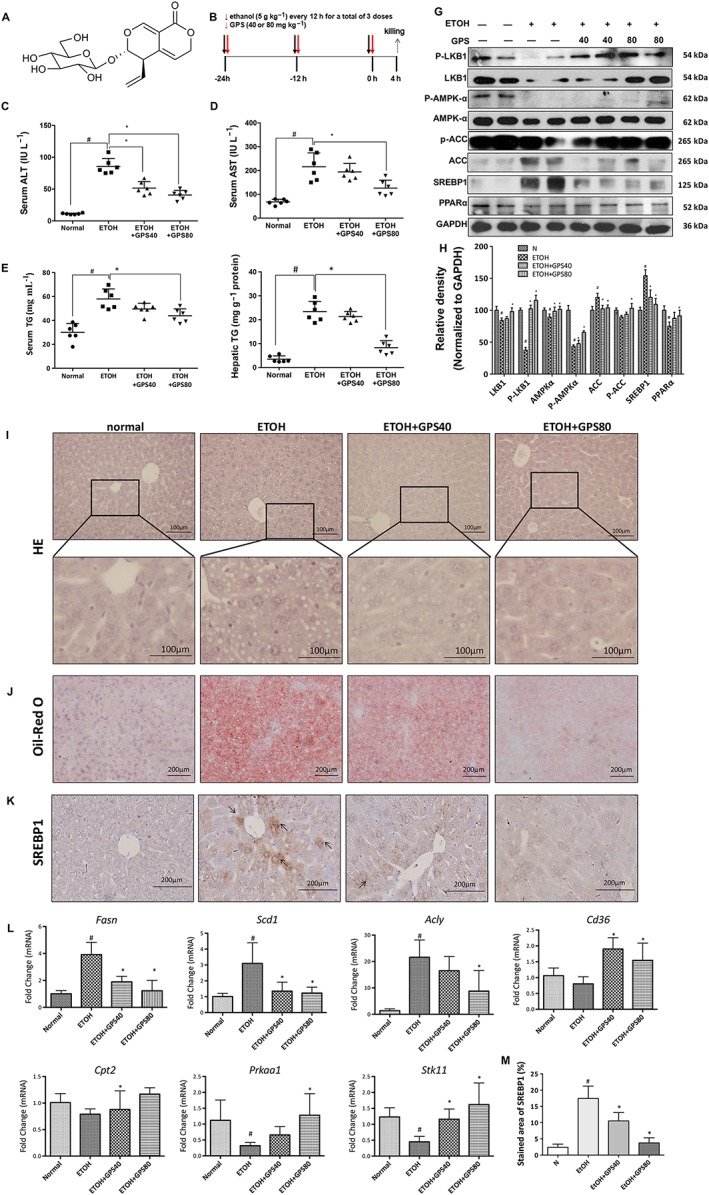
Gentiopicroside alleviates lipid accumulation in acute alcoholic hepatosteatosis. Mice were treated with ethanol (5 g·kg−1) by gavage every 12 h for a total of three doses to induce acute hepatic steatosis. gentiopicroside (GPS; 40 and 80 mg·kg−1) was gavaged simultaneously with ethanol intake. (A) Chemical structure of gentiopicroside. (B) Animal experimental procedure. Serum ALT (C) and AST (D), serum (E) and hepatic (F) TG contents. Each value is expressed as the mean ± SD (n = 6 in each group). (G) Protein expression levels of LKB1, phospho‐LKB1, AMPKα, phospho‐AMPKα, ACC, phospho‐ACC, SREBP1 and PPARα of mice liver were determined at 4 h after the last ethanol administration by five independent Western blots. (H) Each immunoreactive band was normalized against GAPDH and relative to normal to control for unwanted sources of variation. HE (I) and Oil Red O staining (J) were performed with samples obtained at 4 h after the last ethanol administration (400 × original magnification). (K) Effects of gentiopicroside on the expression of SREBP1 in livers based on immunohistochemical assays (200 × original magnification) (n = 6). Black arrows indicate positive signals to SREBP1 in liver sections. Representative images are shown. (M) The percent of integrated optical density of the area was analysed with Image Pro‐Plus 6.0. (L) mRNA expression of Prkaa1, Stk11 and SREBP1 targeting genes‐Fasn, Scd1, Acly and PPARα targeting genes‐Cd36, Cpt2. #P < 0.05, significantly different from normal group; *P < 0.05, significantly different from ethanol alone group; one‐way ANOVA followed by Tukey's test. All histograms represent the mean ± SD of five independent assays.
Methods
Cell culture
Human hepatoma cell line, HepG2 and macrophage‐like murine cell line RAW 264.7 were generous gifts from Professor Jung Joon Lee of Korea Research Institute of Bioscience and Biotechnology (Daejeon, Korea). Although it was reported that HepG2 cells do not express class I alcohol dehydrogenase (ADH) genes or http://www.guidetopharmacology.org/GRAC/ObjectDisplayForward?objectId=1330, they express ADH4, which metabolizes ethanol (Donohue et al., 2006; Bosron and Edenberg, 2010; Pochareddy and Edenberg, 2012). Ethanol also induced the mRNA and protein expression of CYP2E1 in HepG2 cells (Aljomah et al., 2015). Therefore, HepG2 cells are used to identify the effects of alcohol on human hepatocyte‐like cells without the complication of the many different cell types in liver (Pochareddy and Edenberg, 2012; Gao et al., 2016; Yan et al., 2016). RAW 264.7 cells and HepG2 cells were cultured in DMEM supplemented with 10% FBS, 100 units·mL−1 penicillin G and 100 mg·mL−1 streptomycin at 37°C under 5% CO2. The cultures were passaged by trypsinization every 2 or 3 days, and studies were performed using cells from the fourth to seventh passages in vitro.
Isolation of murine bone marrow‐derived macrophages
Murine bone marrow‐derived macrophages (BMDM) were isolated by flushing femurs and tibias of 8‐ to 12‐week‐old C57BL/6 mice with complete DMEM (+10% FBS, +1% penicillin G/streptomycin) for 7 days in presence of 20 ng·mL−1 recombinant mouse M‐CSF. The resulting macrophages were detached, washed, counted and seeded in tissue culture six‐well plates at 1 × 10⁶ cells·mL−1 in recombinant mouse M‐CSF‐containing medium. The cells were treated with LPS for 4 h and subsequently stimulated for 30 min with 3 mM ATP.
Animals
All animal care and experimental procedures were carried out strictly in accordance with the criteria of the “Guide for the Care and Use of Laboratory Animals” published by the USA National Institutes of Health (National Research Council, 1996) and were approved by the Animal Research Committee of Yanbian University, China. The animals were treated humanely, and all efforts were made to minimize the animals' suffering and the animal numbers. Animal studies are reported in compliance with the ARRIVE guidelines (Kilkenny et al., 2010; McGrath and Lilley, 2015).
Eight‐ to 10‐week‐old male C57BL/6 mice (20–22 g) were purchased from Changchun Yisi Laboratory Animal Technology Co., Ltd [(SPF, SCXK [JI] 2011‐0004), Jilin, China]; the mice were fed with a standard chow diet and given tap water ad libitum. All mice were maintained on a 12/12 h light–dark cycle and were housed in a temperature‐ (23 ± 2°C) and humidity‐ (55 ± 5%) controlled vivarium. Mice were exposed to one of two different feeding protocols. (i) Acute alcohol treatment (Figure 1B) (Lian et al., 2010a): The mice were randomly divided into four groups (n = 6 per group), including a control group, ethanol group, and two ethanol plus gentiopicroside groups (40 or 80 mg·kg−1 body weight). Doses of gentiopicroside were determined according to previous publications (Lian et al., 2010a; Lian et al., 2010b). Mice were intragastrically treated with ethanol (5 g·kg−1 body weight) every 12 h for a total of three doses. Normal mice received an isocaloric maltose solution, and gentiopicroside was gavaged simultaneously with ethanol to the mice in the ethanol plus gentiopicroside groups. All mice were killed 4 h after the last dosing. (ii) Chronic plus binge ethanol feeding (Figure 3A) (Bertola et al., 2013a; Yin et al., 2014): Chronic‐plus‐single‐binge ethanol feeding synergistically induces liver inflammation and steatosis, which mimics alcoholic acute‐on‐chronic liver injury in patients (Bertola et al., 2013a; Wilkin et al., 2016). All mice were randomly divided into the following four groups (n = 6): a pair‐fed group, an ethanol‐fed plus a single dose of ethanol group, an ethanol‐fed plus a single dose of ethanol combined with gentiopicroside group (40 mg·kg−1, body weight) and a gentiopicroside single‐dose group (40 mg·kg−1, body weight). Briefly, after a 5 day period of acclimation to the control Lieber‐DeCarli liquid diets ad libitum, mice were fed Lieber‐DeCarli liquid diets (TROPHIC Animal Feed High‐tech Co., Ltd, Nantong, Jiangsu, China) containing 5% (v/v) ethanol or isocaloric dextrin maltose for 10 days. On the 11th day, mice were gavaged with a single dose of ethanol (5 g·kg−1 body weight) or isocaloric maltose dextrin solution in the early morning. The liquid diets were freshly prepared every day using autoclaved cold water in sterilized feeding tubes (Bio‐Serv, Frenchtown, NJ, USA), and the diets were changed daily in the late afternoon. The components and energy composition of the liquid diets have been described previously (Wang et al., 2016). The gentiopicroside‐treated mice were gavaged daily with 40 mg·kg−1 of gentiopicroside. All mice were killed 9 h after gavage. All mice from the two protocols were anesthetized with isoflurane. Blood was collected by direct cardiac puncture. The entire liver was removed, and a portion of tissues from the same lobe of the liver in each mouse was embedded in optimal cutting temperature compound (frozen tissue matrix, OCT; Tissue‐Tek®; Sakura Finetek, Torrance, CA) or 10% neutral buffered formalin for histological analysis. The rest of the tissues were snap frozen in liquid nitrogen and then stored at −80°C until they were analysed.
Biochemical assays
Serum alanine aminotransferase (ALT) and aspartate aminotransferase (AST) levels were measured using an Autodry Chemistry Analyzer (SPOTCHEM™ SP4410, Arkray, Japan). Serum and hepatic triglyceride levels were measured by using a commercial colorimetric kit (Nanjing Jiancheng Bioengineering Institute, Nanjing, China) according to the manufacturer's protocols.
Liver histological analysis
Sections (5μm) of paraffin‐embedded liver were stained with haematoxylin and eosin (H&E). For Oil Red O staining, 5‐μm‐thick cryosections were cut, stained with Oil Red O and then counterstained with haematoxylin. All these analyses were carried out in a blinded manner.
Oil Red O staining of HepG2 cells
HepG2 cells were fixed with 4% paraformaldehyde solution and then washed gently with 60% isopropanol, followed with Oil Red O solution stain. The cells were washed with distilled water to remove unincorporated dye. Then, the cells were counterstained with haematoxylin. Results were examined using a light microscope (Nikon TI‐E, Nikon, Japan).
Immunohistochemistry
Paraffin sections were deparaffinized in xylene and passed through sequential decreasing concentrations of ethanol. Sections were microwaved in 10 mM sodium citrate buffer (pH 6.0) and then allowed to cool to room temperature. Slides were treated with 3% hydrogen peroxide, followed by blocking with 5% normal goat serum and Avidin/Biotin Blocking solution (Vector Laboratories, Inc., Burlingame, CA, USA). Immunohistochemical staining for SREBP1 was performed using a mouse anti‐SREBP1 monoclonal antibody (ab3259, Abcam, Cambridge, MA). The sections were then incubated with biotin‐SP affiniPure Fab fragment goat anti‐mouse IgG (Code Number: 115‐067‐003, Jackson ImmunoResearch Labs) as secondary antibodies. Bound antibodies were visualized with Lab Vision™ DAB Plus Substrate Staining System (Thermo Fisher Scientific, Fremont, CA, USA). Images were acquired by a light microscopy (Nikon TI‐E, Nikon, Tokyo, Japan). All these examinations were carried out in a blinded manner. The percent of integrated optical density of the area was analysed with Image Pro‐Plus 6.0.
Immunofluorescence staining
Cryosections were fixed in acetone/methanol (1:1) and incubated with 5% goat serum to reduce non‐specific binding. The frozen sections were incubated with a rabbit anti‐caspase‐1 p10 polyclonal antibody (sc‐514, Santa Cruz Biotechnology), followed by Alexa Fluor 488 goat anti‐rabbit IgG (A‐11008, Invitrogen, Grand Island, NY). The fluorescence was visualized by a Nikon TI‐E fluorescence microscope. All these examinations were carried out in a blinded manner. The immunofluorescence intensity was analysed with Image Pro‐Plus 6.0.
Real‐time RT‐PCR
RNA was isolated from mouse liver using SV Total RNA Isolation System (Promega, Madison, WI) according to the manufacturer's instructions. Samples of RNA (1μg)was reverse transcribed at 42°C for 60 min using 1 μg Oligo(dT)15 Primer (Promega), 20 U RNasin Ribonuclease Inhibitors (Promega) and 10 U AMV reverse transcriptase (Promega) according to the manufacturer's instructions. And then AMV was inactivated at 95°C for 10 min. Relative gene expression was determined by real‐time PCR with Power SYBR® Green PCR Master Mix (Life Technologies, Carlsbad, CA) on an Agilent Mx3000P QPCR System, and relative fold difference was quantified using the comparative threshold cycle (ΔΔCt) method and GAPDH as a housekeeping gene. The specific primers were used for analyses of gene expression are shown in Supporting Information Table S1, some of them have been described previously (Uribe‐Herranz et al., 2013; Milora et al., 2014).
Western blotting
Cells or liver samples were lysed in RIPA (Abcam) in the presence of protease and phosphatase inhibitors Complete mini and PhosSTOP (Roche Diagnostics, Mannheim, Germany). Nuclear and cytoplasmic fractions were isolated from cells using the Nuclear and Cytoplasmic Protein Extraction Kit (Beyotime, Jiangsu, China). Samples (20 μg) were separated using SDS‐PAGE and transferred onto a PVDF membrane (Amersham Hybond, GE Healthcare Bio‐Sciences, Pittsburgh, PA). The membranes were incubated at 4°C overnight with the following: rabbit anti‐phospho‐AMPKα monoclonal antibody (#2535, Cell Signaling Technology, Boston, MA), rabbit anti‐AMPKα polyclonal antibody (#2532, Cell Signaling Technology), rabbit anti‐phospho‐LKB1 monoclonal antibody (#3482, Cell Signaling Technology), rabbit anti‐LKB1 monoclonal antibody (#3047, Cell Signaling Technology), rabbit anti‐phospho‐ACC monoclonal antibody (#11818, Cell Signaling Technology), rabbit anti‐ACC monoclonal antibody (#3676, Cell Signaling Technology), mouse anti‐SREBP1monoclonal antibody (ab3259, Abcam), rabbit anti‐PPARα polyclonal antibody (sc‐9000, Santa Cruz Biotechnology, Sant Cruz, CA), rabbit anti‐P2x7R polyclonal antibody (ab48871 or ab77413, Abcam), rabbit anti‐caspase‐1 polyclonal antibody (sc‐514 or sc‐622, Santa Cruz Biotechnology), goat anti‐IL‐1β polyclonal antibody (AF‐401, R&D Systems) and mouse anti‐IL‐1β monoclonal antibody (c, R&D Systems). A mouse anti‐GAPDH monoclonal antibody (ab8245, Abcam) was used as a loading control. Then the membrane was further incubated with the appropriate HRP‐conjugated secondary antibodies. The protein bands were developed using Amersham ECL Prime Western Blotting Detection Reagent (GE Healthcare) and quantified by densitometry using Quantity One software (Bio‐Rad, Hercules, CA).
Caspase‐1 activity assay
Caspase‐1 activity was measured using a colorimetric assay (Beyotime) according to the manufacturer's instruction. An equal amount of total protein extracts (20 μg) from liver or cells was incubated with acetyl‐Tyr‐Val‐Ala‐Asp p‐nitroaniline (Ac‐YVAD‐pNA) for 2 h at 37°C. Caspase‐1 activity was measured at 405 nm using microplate spectrophotometer (BioTek Instruments, Inc., USA). The amount of yellow chromophore (pNA) represented the level of caspase‐1 activity.
elisa
Human and mouse IL‐1β protein levels were measured using appropriate species‐specific elisa kits according to the manufacturers' (BD Biosciences, San Jose, CA, and PeproTech) instructions.
siRNA transfection
HepG2 or RAW 264.7 cells were transfected with scrambled control siRNA or P2X7 receptor‐siRNA (Bioneer, Shanghai, China) using Lipofectamine® RNAiMAX reagent (Thermo Fisher Scientific Inc.) or HiPerfect transfection reagent (Qiagen, Valencia, CA, USA) respectively. The transfection efficiency of fluorescein amidite (FAM)‐labelled negative control siRNA was >90% after 24 h transfection. Sequences for human P2X7 receptor‐siRNA21 were as follows: sense, 5′‐AGAGCAAAGUGACCUGGUU‐3′; antisense, 5′‐AACCAGGUCACUUUGCUCU‐3′. Sequences for human P2X7 receptor‐siRNA26 were as follows: sense, 5′‐GGACUGCAACCUAGACCGU‐3′; antisense, 5′‐ACGGUCUAGGUUGCAGUCC‐3′. Sequences for mouse P2X7 receptor‐siRNA were as follows: sense, 5′‐CUGAGAAAUCGGUGUGUUU‐3′; antisense, 5′‐AAACACACCGAUUUCUCAG‐3′.
Data and statistical analysis
The data and statistical analysis comply with the recommendations on experimental design and analysis in pharmacology (Curtis et al., 2015). Data are presented as mean ± SD. All data were analysed by Kolmogorov–Smirnov normality tests and followed a Gaussian distribution (P > 0.1). Statistical significance was evaluated by one‐way ANOVA and Tukey's multiple comparison tests. Differences between ethanol intake and gentiopicroside pretreatment were analysed by two‐way ANOVA with a post hoc Bonferroni multiple comparison test. Post hoc tests were run only if F achieved P < 0.05 and there was no significant variance inhomogeneity. P <0.05was taken to show statistical significance. All statistical analyses were performed using the GraphPad Prism v6 software (Graphpad Software, Inc., San Diego, CA, USA).
Materials
Gentiopicroside was obtained from the National Institute for the Control of Pharmaceutical and Biological Products (>99% purity; Beijing, China) and was dissolved in saline. Ultrapure lipopolysaccharides from Escherichia coli O111:B4 were purchased from InvivoGen (San Diego, CA), and ATP disodium salt was purchased from Sigma Chemical Co. (St. Louis, MO). The P2X7 receptor‐selective antagonist http://www.guidetopharmacology.org/GRAC/LigandDisplayForward?ligandId=4118 (PubChem CID: 11673921) was purchased from Abcam http://www.guidetopharmacology.org/GRAC/LigandDisplayForward?ligandId=4779 (PubChem CID: 14219) was purchased from Beyotime. The caspase‐1 inhibitor VI (http://www.guidetopharmacology.org/GRAC/LigandDisplayForward?ligandId=5302, PubChem CID: 16760349) was purchased from Santa Cruz Biotechnology, Inc. HRP‐conjugated goat anti‐mouse, goat anti‐rabbit and donkey anti‐goat antibodies were purchased from Abcam. The BCA Protein Assay Kit was obtained from Beyotime.
Nomenclature of targets and ligands
Key protein targets and ligands in this article are hyperlinked to corresponding entries in http://www.guidetopharmacology.org, the common portal for data from the IUPHAR/BPS Guide to PHARMACOLOGY (Harding et al., 2018), and are permanently archived in the Concise Guide to PHARMACOLOGY 2017/18 (Alexander et al., 2017a,b,c,d).
Results
Gentiopicroside alleviates lipid accumulation via reduction of lipogenesis and promotion of lipid oxidation in acute alcoholic hepatosteatosis
After three doses of binge alcohol consumption, ethanol intake increased serum ALT and AST levels (q = 22.24; q = 9.376, respectively) as shown in Figure 1C, D. Ethanol treatment caused a significant accumulation of triglyceride in mouse livers and serum (q = 10.12; q = 16.99, respectively) as shown in Figure 1E, F. HE and Oil Red O staining of liver sections also exhibited obvious fat droplets in liver sections from mice given ethanol (Figure 1I, J). We investigated whether oral administration of gentiopicroside could prevent ethanol‐induced acute hepatic steatosis. Mice treated with gentiopicroside alone (40 mg·kg−1) for 10 days exhibited no toxicity, including liver injury and steatosis (Figure 3B, C, F). Gentiopicroside pretreatment reduced the ethanol‐induced elevation of serum AST and ALT levels in a dose‐dependent manner, as well as serum and hepatic TG levels. As expected, lipid droplets in the livers of gentiopicroside‐pretreated mice were much smaller and less abundant than those in the ethanol group.
Ethanol feeding significantly suppressed phosphorylated and total protein levels of LKB1 (q = 25.4; q = 7.355, respectively) and AMPK (q = 25.85; q = 4.800, respectively), and it also suppressed the mRNA expression of LKB1 and AMPK (q = 4.641q = 4.022, respectively), as shown in Figure 1G, I. We then investigated whether gentiopicroside plays a role in the development of lipid accumulation by regulating the activation of AMPK‐LKB1. As expected, gentiopicroside stimulated AMPK and LKB1 phosphorylation and mRNA expression.
Consistent with dynamically altered TG levels, the elevation of SREBP1 protein expression was prevented by gentiopicroside in alcohol‐induced acute hepatic steatosis (Figure 1G). Moreover, the gentiopicroside‐induced decrease in hepatic SREBP1 protein expression was further confirmed by immunohistochemical analysis (Figure 1K). The expression of ACC was increased by ethanol and was reduced by gentiopicroside to nearly normal levels. The inhibitory phosphorylation of ACC was restored by gentiopicroside treatment. Alcohol binging inhibited PPARα protein expression, which may develop as a consequence of alterations in fatty acid oxidation and lipid synthesis. As expected, gentiopicroside dose‐dependently enhanced the protein expression of PPARα. Acute alcohol intake increased the mRNA expression of the SREBP1‐regulated genes‐Fasn, Scd1 and Acly, while it decreased the mRNA expression of the PPARα‐regulated genes‐Cd36 and Cpt2 (Figure 1L). These results suggested that alcohol‐induced lipid accumulation is regulated by SREBP1‐mediated lipogenesis and PPARα‐mediated fatty acid oxidation. gentiopicroside ameliorates hepatic lipid accumulation by down‐regulating lipid synthesis and up‐regulating fatty acid oxidation and eventually attenuating hepatic lipid accumulation.
Gentiopicroside suppresses NLRP3 inflammasome activation via blockade of P2X7 receptors in ethanol‐induced acute hepatic steatosis
We observed a marked increase in the protein and mRNA levels of IL‐1β in ethanol‐treated acute steatotic mouse liver and serum compared with those in the liver and sera of normal mice (Figure 2E, F, H, I). A low level of P2X7 receptors and NLRP3 was detected in the normal mouse liver (Figure 2A, B, H). Alcohol administration induced the enhancement of P2X7 receptor and NLRP3 protein and mRNA expression in both hepatocytes and macrophages in mouse liver, as shown by double immunohistochemistry staining or Western blotting and qPCR (Figure 2A, B, H; Supporting Information Figure S2). Mice treated with ethanol displayed a marked increase in caspase‐1 activation (Figure 2C, G, H), indicating that P2X7 receptor‐NLRP3/caspase‐1 inflammasome activation contributes to the increase in IL‐1β production. Gentiopicroside administration effectively blocked IL‐1β production and caspase‐1 activation and also reduced NLRP3 and P2X7 receptor expression.
Figure 2.
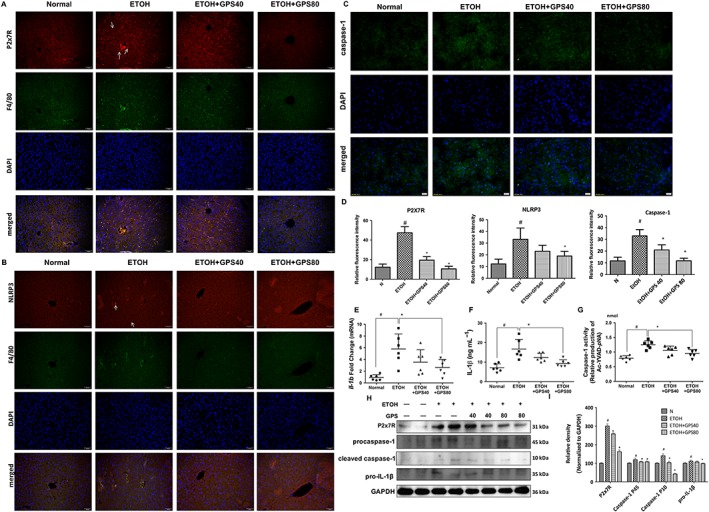
Gentiopicroside (GPS) suppresses NLRP3 inflammasome activation via blockade of P2X7 receptors in acute alcoholic hepatosteatosis. Expression of P2X7 receptor (A, red) and NLRP3 (B, red) in mouse livers were evaluated by dual immunofluorescence staining combined with F4/80 (green, 200× original magnification) (n = 6). White arrows show positive staining cells. (C) Caspase‐1 activity was measured using a colorimetric assay (n = 6). Caspase‐1 staining (green) and nuclei with DAPI (blue) are shown. (D) Relative fluorescence intensity of P2X7 receptors, NLRP3 and caspase‐1 was analysed with Image Pro‐Plus 6.0. Il1b mRNA expression in the liver (E) and IL‐1β protein level in serum (F) were determined by real time PCR or elisa assay (n = 6). (G) Caspase‐1 activity was measured using a colorimetric assay. (H) Protein expression of P2X7 receptor, procaspase‐1, cleaved caspase‐1 and pro‐IL‐1β were determined by five independent Western blots. (G) Each immunoreactive band was normalized against GAPDH and relative to normal to control for unwanted sources of variation. #P < 0.05, significantly different from normal group; *P < 0.05, significantly different from ethanol alone group; one‐way ANOVA followed by Tukey's test. Representative images were shown. All histograms represent the mean ± SD of five independent assays.
Gentiopicroside prevents chronic alcoholic hepatic steatosis by ameliorating lipid accumulation
Heavy chronic alcohol intake amplifies liver inflammation and impairs liver function. Because gentiopicroside reduced the hepatic steatosis induced by acute alcohol binging, we tested the ability of gentiopicroside to reverse ethanol‐induced chronic hepatic steatosis and inflammation. Chronic‐binge ethanol feeding resulted in severe liver injury, characterized by higher serum ALT and AST levels than those in pair‐fed mice (Figure 3B, C) and by serious steatosis and inflammatory infiltration (Figure 3F), which were effectively suppressed after gentiopicroside administration. A decrease in ALT and AST levels was observed in gentiopicroside‐treated chronic‐binge ethanol‐fed mice [treatment: F(1, 20) = 37.24, and F(1, 20) = 17.54 respectively]. Also, an interaction was detected between ethanol intake and gentiopicroside treatment [F(1,20) = 35.58 for ALT; F(1,20) = 24.57 for AST], indicating that gentiopicroside induced a different effect on liver fat content depending on the ethanol intake. Alcohol‐fed mice had a higher serum and hepatic TG contents compared with their pair‐fed controls, while gentiopicroside reduced hepatic and serum TG contents after alcohol exposure (Figure 3D, E). Two‐way ANOVA analysis results showed a significant increase of serum and hepatic TG contents with ethanol intake [ethanol intake: F(1, 20) = 6.366; F(1, 20) = 7.611 respectively], and gentiopicroside pretreatment significantly reduced alcohol‐induced serum and hepatic TG levels [GPS pretreatment: F(1, 20) = 8.828; F(1, 20) = 8.197 respectively]. Oil Red O staining results confirmed the histological results and quantitative TG level data by demonstrating that mice developed severe microvesicular steatosis after chronic‐binge alcohol feeding compared with mice in pair‐fed groups, and this elevation was significantly reduced by gentiopicroside administration (Figure 3F). In addition, gentiopicroside alone at 40 mg·kg−1 did not cause any hepatic injury or lipid accumulation. These results revealed that gentiopicroside could reverse lipid accumulation in chronic alcohol‐induced chronic hepatic steatosis.
Figure 3.
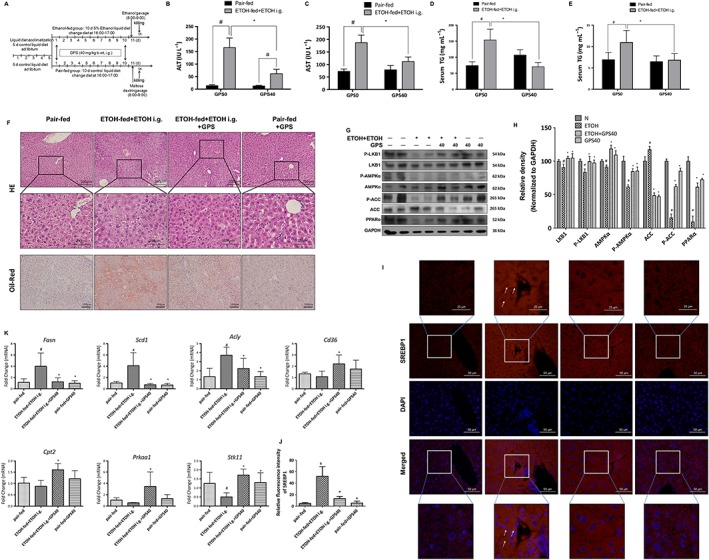
Gentiopicroside (GPS) ameliorates lipid accumulation in chronic‐plus‐binge alcohol feeding‐induced hepatosteatosis. C57BL/6 mice were subjected to chronic‐binge ethanol feeding. (A) Animal experimental procedure. Serum ALT (B) and AST (C), serum (D) and hepatic (E) TG contents, H&E and Oil Red O staining (F) were performed with samples obtained at 9 h after the last ethanol administration (200× original magnification). #P < 0.05, significantly different from pair‐fed group; *P < 0.05, significantly different from ethanol‐fed plus a single dose of ethanol group; two‐way ANOVA with post hoc Bonferroni multiple comparison test. (G) Protein expression levels of LKB1, phospho‐LKB1, AMPK‐α, phospho‐AMPK‐α, phospho‐ACC, ACC and PPARα of mice livers were determined by five independent Western blots. (H) Each immunoreactive band was normalized against GAPDH and relative to normal to control for unwanted sources of variation. #P < 0.05, significantly different from pair‐fed group; *P < 0.05, significantly different from ethanol‐fed plus a single dose of ethanol group; one‐way ANOVA followed by Tukey's test. (I) Expression of SREBP1 of mouse liver was performed with immunofluorescence staining (200× original magnification) (n = 6). Representative images are shown. (J) Relative fluorescence intensity of SREBP1 was analysed with Image Pro‐Plus 6.0. (K) mRNA expression of Prkaa1, Stk11 and SREBP1 targeting genes‐Fasn, Scd1, Acly and PPARα targeting genes‐Cd36, Cpt2. #P < 0.05, significantly different from pair‐fed group; *P < 0.05, significantly different from ethanol‐fed plus a single dose of ethanol group; one‐way ANOVA followed by Tukey's test. All histograms represent the mean ± SD of five independent assays.
Chronic alcohol exposure significantly reduced protein and mRNA expression levels of total and phosphorylated LKB1 and AMPK and also suppressed phosphorylated ACC and PPARα (Figure 3G, K). All of these inhibitory effects of ethanol on proteins involved in lipid metabolism pathways were abolished by gentiopicroside. Additionally, as shown in immunofluorescence staining for SREBP1, chronic‐binge ethanol feeding significantly increased SREBP1‐positive staining in both the cytoplasm and nucleus, and this increase in SREBP1 was inhibited by gentiopicroside (Figure 3I). Additionally, chronic alcohol intake up‐regulated the mRNA expression of SREBP1‐regulated genes (Fasn, Scd1 and Acly) and down‐regulated PPARα‐regulated genes (Cd36 and Cpt2) (Figure 3K), while those alcohol‐induced mRNA expression changes were inhibited by gentiopicroside. These data suggest that the protective effects of gentiopicroside on chronic alcohol‐induced hepatic steatosis are mediated through the inhibition of ethanol‐stimulated lipogenesis and through the elevation of lipid oxidation.
Gentiopicroside improved increased inflammasome activation induced by chronic plus binge ethanol feeding
Chronic plus binge ethanol feeding significantly elevated the mRNA expression and secreted levels of IL‐1β, which were notably reduced after gentiopicroside administration (Figure 4E, F). A significant ethanol intake effect was observed on the levels of mRNA expression of IL‐1β [ethanol intake: F(1, 20) = 19.25] and on the secreted levels of IL‐1β [ethanol intake: F(1, 20) = 150.4]. Alcohol‐fed mice had a significant enhancement of caspase‐1 activity and its cleavage compared with those in pair‐fed mice, whereas gentiopicroside administration greatly reduced caspase‐1 activity and its cleavage (Figure 4C, G–I). Alcohol exposure markedly up‐regulated the protein and mRNA expressions levels of P2X7 receptors and NLRP3, while gentiopicroside abolished the alcohol‐induced expression of P2X7 receptor and NLRP3 (Figure 4A, B; Supporting Information Figure S2). Gentiopicroside alone did not affect the mRNA and protein expression of P2X7 receptors and NLRP3.
Figure 4.
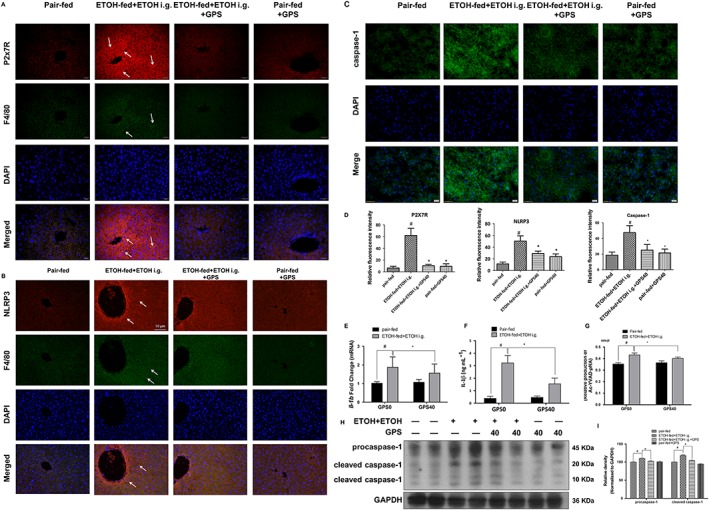
Gentiopicroside (GPS) suppresses P2X7 receptor‐NLRP3 inflammasome activation in chronic‐plus‐binge alcohol feeding‐induced hepatosteatosis. Expression of P2X7 receptor (A, red) and NLRP3 (B, red) in mouse livers were evaluated by dual immunofluorescence staining combined with F4/80 (green, 200× original magnification) (n = 6). White arrows show positive staining cells. (C) Caspase‐1 activity was measured using a colorimetric assay (n = 6). Caspase‐1 staining (green) and nuclei with DAPI (blue) are shown. (D) Relative fluorescence intensity for P2X7 receptors, NLRP3 and caspase‐1 was analysed with Image Pro‐Plus 6.0. #P < 0.05, significantly different from pair‐fed group; *P < 0.05, significantly different from ethanol‐fed plus a single dose of ethanol group; one‐way ANOVA followed by Tukey's test. Il1b mRNA expression in the liver (E), murine IL‐1β protein level in serum (F) and caspase‐1 activity (G) were determined by real‐time PCR, elisa or colorimetric assay (n = 6). #P < 0.05, significantly different from pair‐fed group; *P < 0.05, significantly different from ethanol‐fed plus a single dose of ethanol group; two‐way ANOVA with a post hoc Bonferroni multiple comparison test. (H) Protein expression of procaspase‐1 and cleaved caspase‐1 were determined by five independent Western blots. (I) Each immunoreactive band was normalized against GAPDH and relative to normal to control for unwanted sources of variation. #P < 0.05, significantly different from pair‐fed group; *P < 0.05, significantly different from ethanol‐fed plus a single dose of ethanol group; one‐way ANOVA followed by Tukey's test. Representative images are shown. All histograms represent the mean ± SD of five independent assays.
Gentiopicroside regulates lipid accumulation via P2X7 receptor‐NLRP3 inflammasome activation in ethanol‐induced steatotic hepatocytes
HepG2 cells were incubated with ethanol to induce intracellular lipid accumulation. Ethanol induced cytotoxicity in HepG2 cells, while gentiopicroside pretreatment restored cell survival in a concentration‐dependent manner (Figure 5A). Oil Red O staining was used to examine the inhibitory effects of gentiopicroside on intracellular lipid accumulation in HepG2 cells. As shown in Figure 5B, ethanol exposure increased the quality of lipid droplets in HepG2 cells. However, gentiopicroside alleviated the lipid deposition in hepatocytes as compared with ethanol‐treated cells. Furthermore, gentiopicroside pretreatment reversed the ethanol‐induced suppression of phosphorylated and total protein levels of LKB1 and AMPK (Figure 5C). Regulation of lipid biosynthesis by gentiopicroside also exhibited a remarkable improvement, characterized by enhanced phosphorylated ACC and reduced ACC in ethanol‐treated hepatocytes. Meanwhile, alcohol‐suppressed PPARα protein expression was restored by gentiopicroside. Total SREBP1 expression levels and SREBP1 expression levels both the cytoplasm and nuclear fractions were increased after ethanol exposure (Figure 5C). gentiopicroside successfully reduced SREBP1 expression in both fractions. Metformin, which activates the LKB1‐AMPK pathway, was used as a positive control, and gentiopicroside exhibited a greater inhibition of ethanol‐induced lipid accumulation, compared with metformin. In addition, Oil Red O staining showed that gentiopicroside inhibited lipid accumulation in mouse primary hepatocytes (Supporting Information Figure S3A). These inhibitory effects of gentiopicroside on lipid accumulation were also accompanied by decreased SREBP1 expression and increased AMPK phosphorylation (Supporting Information Figure S3B, C). These results demonstrated that gentiopicroside reduces ethanol‐induced lipid accumulation in hepatocytes.
Figure 5.
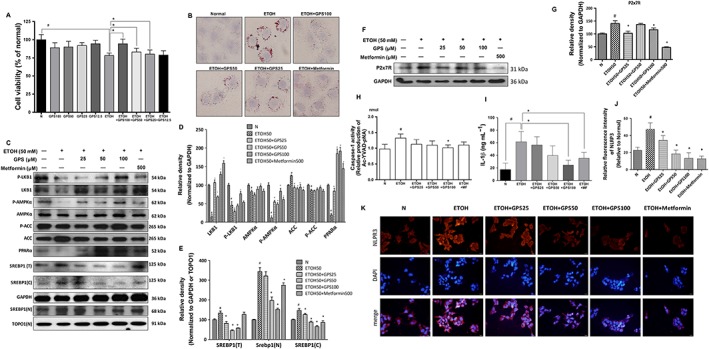
Gentiopicroside regulates lipid accumulation via P2X7 receptor‐NLRP3 inflammasome activation in ethanol‐induced steatotic HepG2 cells. HepG2 cells were incubated with or without gentiopicroside (GPS) in the presence or absence of ethanol (50 mM) except untreated cells for 24 h. (A) Cell viability was determined by MTT assay. (B) Lipid deposition in HepG2 cells was assessed with Oil Red O staining. Images are taken by light microscopy at a magnification of 400×. (C) Total‐ and phospho‐LKB1, AMPKα, ACC and PPARα, SREBP1 protein expression of human HepG2 cells in total (T), cytoplasm (C) and nucleus (N) were evaluated by Western blotting. (F) P2X7 receptor protein expression determined by Western blotting. (D, E, G) Each immunoreactive band was normalized against GAPDH and relative to normal to control for unwanted sources of variation. (H) Caspase‐1 activity was measured using a colorimetric assay. (I) Human IL‐1β protein released into culture medium was determined by elisa assay. The in vitro data are expressed as the mean ± SD of five independent assays. (K) Immunofluorescence staining of NLRP3 in HeGP2 cells (200× magnification). Representative images were shown. (J) Relative fluorescence intensity of NLRP3 was analysed with Image Pro‐Plus 6.0. #P < 0.05, significantly different from untreated cells; *P < 0.05, significantly different from ethanol‐treated cells; one‐way ANOVA followed by Tukey's test. Representative images are shown. All histograms represent the mean ± SD of five independent assays.
P2X7 receptors are typically expressed in multiple liver cells, including immune cells, HSCs and hepatocytes. Here, we investigated how P2X7 receptor expression in hepatocytes is modulated in response to ethanol exposure. P2X7 receptor protein expression (Figure 5F) and caspase‐1 activity (Figure 5H) were significantly increased in ethanol‐exposed HepG2 cells. Ethanol exposure significantly increased NLRP3 activation in HepG2 cells (Figure 5K). The ethanol‐induced increases in P2X7 receptor and NLRP3 expression levels and caspase‐1 activity were significantly attenuated by gentiopicroside treatment. IL‐1β protein secretion was suppressed in ethanol‐exposed HepG2 cells treated with gentiopicroside compared with secrfetion from those cells that only received ethanol (Figure 5I). Elevated levels of secreted IL‐1β protein were detected in the culture medium from ethanol‐treated primary hepatocytes by Western blotting and elisa (Supporting Information Figure S3C, G). In the culture medium of ethanol‐treated primary hepatocytes, we also detected a significant increase in procaspse‐1 and cleaved caspase‐1 (Supporting Information Figure S3C). Gentiopicroside pretreatment abolished these increases in IL‐1β protein secretion and caspase‐1 production and cleavage.
Activation of P2X7 receptors is required for lipid accumulation in ethanol‐induced steatotic hepatocytes
To further assess the regulatory function of P2X7 receptor on lipid accumulation, these receptors were silenced with two different siRNA sequences in HepG2 cells (Figure 6A). In HepG2 cells treated individually with these siRNAs, P2X7 receptor deficiency enhanced the phosphorylation of AMPK in ethanol‐treated hepatocytes, and AMPK activity was further enhanced by gentiopicroside accompanied by genetic blockade of P2X7 receptor (Figure 6B). A significant reduction of SREBP1 expression in P2X7 receptor‐deficient ethanol‐exposed HepG2 cells was also shown by immunofluorescence (Figure 6E). Pretreatment with gentiopicroside inhibited SREBP1 expression to below normal levels. We also used a P2X7 receptor‐selective antagonist (A438079) to block P2X7 receptor or a caspase‐1 inhibitor VI to block NLRP3‐caspase‐1 inflammasome activation. As expected, pharmacological blockade of P2X7 receptors or NLRP3 inflammasome activation restored LKB1‐AMPK activity and decreased SREBP1 (Supporting Information Figure S4A–D). These results suggest that genetic deficiency or pharmacological blockade of P2X7 receptors, which will suppress the activation of the NLRP3 inflammasome, might trigger lipid accumulation in hepatocytes.
Figure 6.
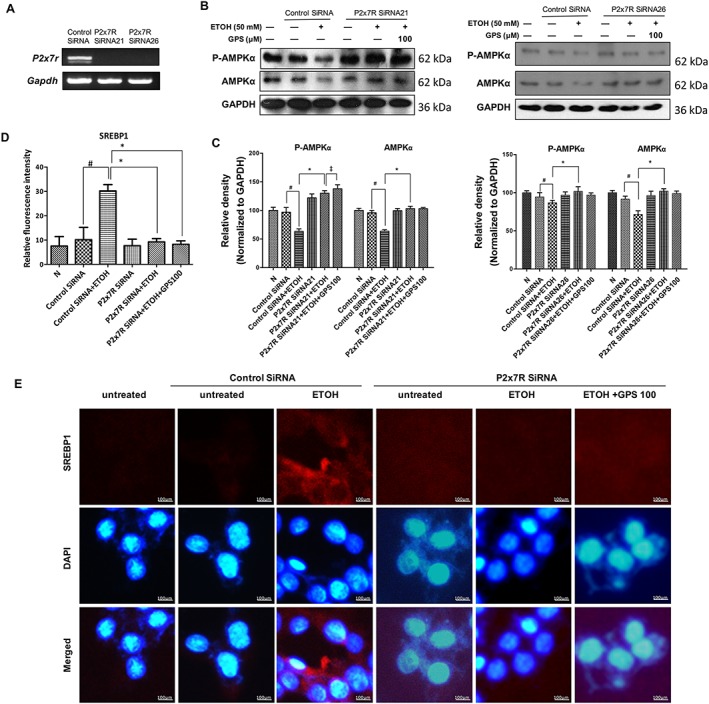
Deficiency of P2X7 receptors blocks lipid accumulation in ethanol‐treated HepG2 cells. HepG2 cells were transfected with two different siRNA sequences targeted to P2X7 receptors or a scrambled siRNA and subsequently treated with gentiopicroside (GPS), followed by ethanol stimulation. (A) Expression of P2X7 receptors in HepG2 cells was verified by RT‐PCR analysis. (B) Phospho‐AMPKα and AMPKα protein levels of HepG2 cells with knock‐down of P2X7 receptors (by siRNA21 or siRNA26) were determined, using Western blot analysis with the whole cell lysates. (C) Each immunoreactive band was normalized against GAPDH and relative to normal to control for unwanted sources of variation. (E) Immunofluorescence staining of SREBP1 (human protein). Images were taken at 200× magnification. SREBP1 staining (red) and nuclei with DAPI (blue) are shown. Representative images are shown. (D) Relative fluorescence intensity of SREBP1 was analysed with Image Pro‐Plus 6.0. In vitro data are expressed as the mean ± SD of five independent assays. #P < 0.05, significantly different from control siRNA‐transfected untreated cells; *P < 0.05, significantly different from control siRNA‐transfected cells stimulated with ethanol; ‡P < 0.05, compared with P2X7 receptor siRNA‐transfected cells stimulated with ethanol; one‐way ANOVA followed by Tukey's test. All histograms represent the mean ± SD of five independent assays.
Gentiopicroside blocks the inflammasome‐mediated IL‐1β release from macrophages, through P2X7 receptors
Interestingly, F4/80 immunohistochemistry showed increased levels of positive staining both in acute alcohol treated‐and chronic plus binge alcohol‐fed mice (Figures 2A, B and 4A, B) compared with F4/80 levels in normal mice, which was consistent with a previous report (Bertola et al., 2013b). The numbers of recruited macrophages were fewer in the livers of mice pretreated with gentiopicroside (Figure 2A, B and 4A, B), suggesting that the observed immune responses in ethanol‐fed mice were likely to be mediated by the recruitment of macrophages. Therefore, the mouse macrophage‐like cell line, RAW 264.7, was utilized to investigate whether the mechanisms of gentiopicroside were associated with NLRP3 inflammasome activation in macrophages. The protein expression of P2X7 receptors in RAW 264.7 cells primed with LPS and subsequently stimulated for 30 min with 3 mM ATP was greatly increased (Figure 7A). LPS plus ATP induced the cleavage of pro‐IL‐1β into mature IL‐1β and markedly triggered the release of IL‐1β (Figure 7A, C). In addition, ATP combined with LPS priming induced increases in caspase‐1 cleavage and activity (Figure 7A, D). In the presence of gentiopicroside, A438079 or caspase‐1 inhibitor VI, P2X7 receptor protein expression and IL‐1β production were clearly decreased. Gentiopicroside also significantly inhibited LPS/ATP‐induced caspase‐1 activation.
Figure 7.
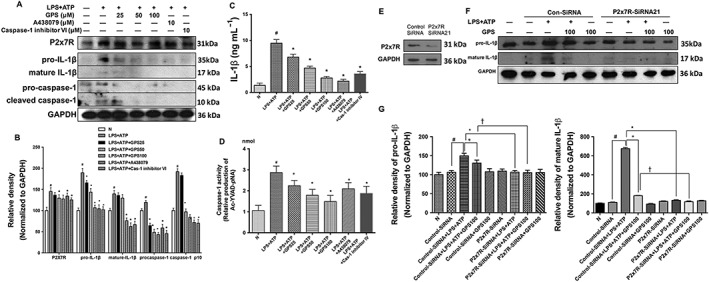
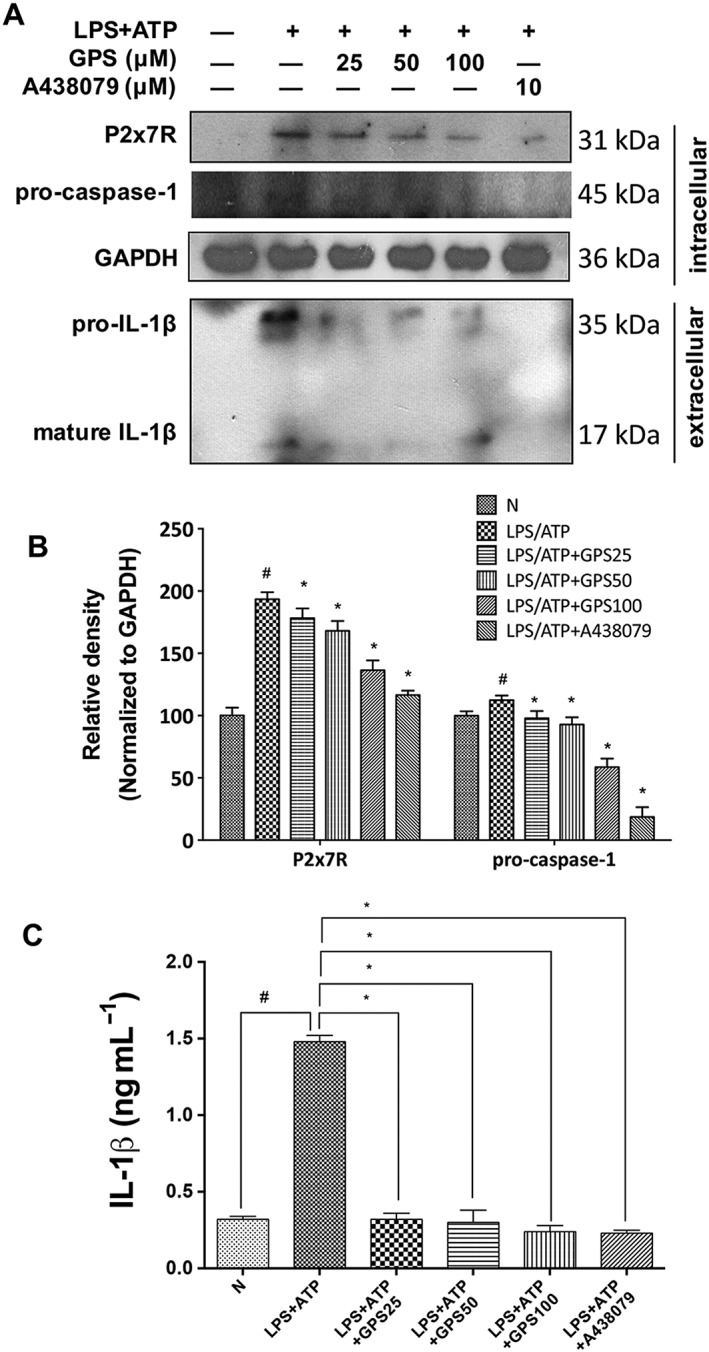
Inhibition of IL‐1β cleavage in RAW 264.7 macrophages by gentiopicroside involves P2X7 receptors. RAW 264.7 macrophages were treated with the indicated concentrations of gentiopicroside (GPS), A438079 or caspase‐1 inhibitor VI for 1 h and were subsequently activated with LPS for another 4 h followed by 30 min of ATP stimulation. (A) Protein expression of P2X7 receptor, IL‐1β and caspase‐1 in RAW 264.7 mouse macrophages was determined by Western blot analysis. (B) Each immunoreactive band was normalized against GAPDH and relative to normal to control for unwanted sources of variation. (C) Murine IL‐1β protein released into culture medium was determined by elisa assay. (D) Caspase‐1 activity was measured using a colorimetric assay. The in vitro data are expressed as the mean ± SD of five independent assays. #P < 0.05, significantly different from untreated cells; *P < 0.05, significantly different from cells stimulated with LPS plus ATP; one‐way ANOVA followed by Tukey's test. RAW 264.7 macrophages were transfected with siRNA targeted to P2X7 receptors or a scrambled siRNA and subsequently treated with gentiopicroside, followed by LPS plus ATP stimulation. (E) Protein expression of P2X7 receptors in RAW 264.7 mouse macrophages was verified by Western blot analysis. (F) Murine IL‐1β was determined using Western blot analysis in the whole cell lysates. (G) Each immunoreactive band was normalized against GAPDH and relative to normal to control for unwanted sources of variation. The results are expressed as the mean ± SD of five independent assays. #P < 0.05, significantly different from control siRNA‐transfected untreated cells; *P < 0.05, significantly different from control siRNA‐transfected cells stimulated with LPS plus ATP; †P < 0.05, significantly different from control siRNA‐transfected cells pretreated with gentiopicroside then stimulated with LPS plus ATP; one‐way ANOVA followed by Tukey's test.
siRNA knockdown of P2X7 receptors markedly attenuated IL‐1β cleavage in response to the P2X7 receptor activator ATP in LPS‐primed RAW 264.7 cells (Figure 7E–G), suggesting that P2X7 receptor signalling in macrophages is an essential second signal in the triggering of IL‐1β cleavage. Gentiopicroside could further suppress IL‐1β cleavage in LPS/ATP stimulated, P2X7 receptor‐silenced, RAW 264.7 cells. Our results indicated that genetically or pharmacologically inhibiting P2X7 receptors resulted in the down‐regulation of the immune response and that gentiopicroside synergized with inhibitory effects of P2X7 receptor knockdown on the immune activation of macrophages.
We further treated BMDMs with LPS plus ATP in the absence or presence of gentiopicroside or A438079. IL‐1β was detected in the culture medium of BMDMs treated with LPS plus ATP (Figure 8A–C). LPS/ATP activated P2X7 receptors and caspase‐1 in BMDMs. Gentiopicroside significantly reduced the LPS/ATP‐induced secretion of the pro‐inflammatory cytokine IL‐1β in BMDMs. With gentiopicroside pretreatment, the protein expression of P2X7 receptor and caspase‐1 activity were decreased in a concentration‐dependent manner (Figure 8A).
Figure 8.
Inhibition of the release of IL‐1β from murine BMDM by gentiopicroside involves P2X7 receptors. BMDMs were treated with the indicated concentrations of gentiopicroside (GPS) or A438079 for 1 h and were subsequently activated with LPS for another 4 h followed by 30 min of ATP stimulation. (A) Protein expression of P2X7 receptors and caspase‐1 in BMDMs and pro‐IL‐1β and mature IL‐1β in supernatant was determined by Western blot analysis. (B) Each immunoreactive band was normalized against GAPDH and relative to normal to control for unwanted sources of variation. (C) Murine IL‐1β protein released into culture medium was determined by elisa assay. The results are expressed as the mean ± SD of five independent assays. #P < 0.05, significantly different from untreated cells; *P < 0.05, significantly different from cells stimulated with LPS plus ATP; one‐way ANOVA followed by Tukey's test.
IL‐1β from macrophages accelerates lipid accumulation in hepatocytes in alcoholic hepatosteatosis
To evaluate the influence of activated macrophages on hepatic lipogenic signalling, we first investigated whether stimulating macrophages could lead to lipid accumulation in hepatocytes. To mimic steatotic hepatocytes induced by neighbouring macrophages, we applied the conditioned medium from untreated or LPS plus ATP‐stimulated THP‐1 macrophages to HepG2 cells. After LPS/ATP stimulation of THP‐1 macrophages, the culture medium from THP‐1 macrophages contains IL‐1β, but interestingly, ethanol itself could not induce IL‐1β release (Supporting Information Figure S5A). This finding suggests that ethanol is not directly involved in the P2X7 receptor‐inflammasome signalling of macrophages. When HepG2 cells were cultured with conditioned medium from LPS/ATP‐activated THP‐1 macrophages, lipid accumulation in HepG2 cells was greatly increased compared with those cells cultured with normal medium containing LPS/ATP, indicating that IL‐1β derived from macrophages might trigger lipid deposition in hepatocytes (Supporting Information Figure S5B). In this culture system, changes in the HepG2 cell phenotype are dependent on inflammatory factors secreted from macrophages, especially IL‐1β. Also, decreases in total and phosphorylated forms of LKB1 and AMPKα and an increase in SREBP1 were detected in response to conditioned medium from LPS/ATP‐stimulated THP‐1 macrophages (Supporting Information Figure S5C, E). To assess whether IL‐1β is essential for the induction of lipid accumulation in HepG2 cells, we applied IL‐1Ra or an IL‐1 β neutralizing antibody to block IL‐1 signalling. IL‐1Ra pretreatment decreased the protein expression of total and phosphorylated LKB1 and AMPKα in HepG2 cells incubated with conditioned medium from LPS/ATP‐activated THP‐1 macrophages (Supporting Information Figure S5G, H). In addition, after the IL‐1β in conditioned medium from LPS/ATP‐activated THP‐1 macrophages was neutralized, the level of phosphorylated AMPKα increased (Supporting Information Figure S5I, J), indicating that inhibiting the IL‐1β secreted from macrophages might be beneficial in controlling of alcoholic hepatosteatosis.
Furthermore, Kupffer cells, which are liver‐specific resident macrophages, are a well‐known source of IL‐1β in ALD. To further evaluate the link between inflammasome suppression in macrophages and the anti‐steatotic phenotype in liver treated with gentiopicroside, mice were treated with clodronate liposomes to deplete macrophages. Macrophages were successfully depleted in liver, as evaluated by F4/80 immunofluorescence staining (Supporting Information Figure S6A) and depletion of hepatic macrophages also markedly decreased serum and hepatic TG levels, but not ALT levels (Supporting Information Figure S6B–D). These results were similar to those previously reported in chronic‐binge alcoholic hepatosteatosis (Cui et al., 2015). From histological evaluations, macrophage depletion apparently alleviated alcoholic steatosis (Supporting Information Figure S7A, B), suggesting that macrophages affect hepatosteatosis. Gentiopicroside administration further decreased serum and hepatic TG level in the absence of macrophages, as well as lipid droplet accumulation. Also, gentiopicroside decreased ALT levels in macrophage‐depleted mice. LKB1 and AMPK phosphorylation was enhanced with macrophage depletion. The absence of macrophages induced LKB1 and AMPK phosphorylation, which was reduced by ethanol intake. Gentiopicroside treatment further strengthened LKB1 and AMPK phosphorylation (Supporting Information Figure S7C). These results indicated that gentiopicroside could affect hepatocytes steatosis and injury, even in the absence of macrophages.
Discussion
Excessive alcohol consumption causes a fatty liver, an early stage of ALD. Some chronic heavy drinkers develop acute alcoholic hepatitis (steatohepatitis), characterized by damaged hepatocytes and infiltration of inflammatory cells (Gao and Bataller, 2011). ALD progression is tightly linked to liver inflammation and steatosis in both experimental animal models and clinical reports (Szabo and Mandrekar, 2009). However, the contribution of inflammation to the development of hepatic steatosis is incompletely understood. Unfortunately, there are no approved drugs to prevent disease progression in patients with ALD. Therefore, there is an urgent need for therapeutic or preventive agents against ALD. Previously, we reported that gentiopicroside protected mice from fulminant hepatic failure with its anti‐apoptotic activities (Lian et al., 2010b), and gentiopicroside‐containing methanolic extracts of Gentiana manshurica Kitagawa prevented alcohol‐induced acute hepatosteatosis (Lian et al., 2010a). This evidence led us to evaluate whether gentiopicroside could ameliorate chronic alcohol‐induced hepatic steatosis, which is often accompanied by inflammation. We identified that gentiopicroside was a potent inhibitor of the P2X7 receptor‐NLRP3 inflammasome activation induced by acute and chronic alcohol consumption as shown by a decrease in IL‐1β and caspase‐1 production, and gentiopicroside inhibited lipid accumulation both in vitro and in vivo. The present work provides the first evidence that P2X7 receptor and NLRP3 inflammasome activation is involved in alcohol‐induced acute‐to‐chronic hepatic steatosis.
Hepatocellular steatosis is the initial stage of alcoholic fatty liver disease. Alcohol exposure may promote fat accumulation in the liver by increasing de novo lipogenesis and impairing fatty acid β‐oxidation by directly or indirectly regulating lipid metabolism‐associated transcription factors and nuclear hormone receptors, such as SREBP1 and PPARα. To investigate whether and how gentiopicroside could ameliorate alcoholic hepatosteatosis, in vivo mice models of acute or chronic alcoholic hepatosteatosis were established by intragastric administration of ethanol to mice or feeding mice with Lieber‐DeCarli liquid diet for 10 days plus a single binge ethanol administration respectively. Both the acute alcohol treatment and chronic‐binge ethanol feeding affected the expression of SREBP1 and PPARα in mice liver and HepG2 cells, as well as the genes they target (Figures 1G, K, L, 3G, I, K and 5C), suggesting that AMPK regulates the ethanol‐induced promotion of fatty acid synthesis and inhibition of fatty acid oxidation. AMPK serves as a metabolic master switch in the control of hepatic lipid homeostasis. AMPK activation inhibits many lipogenic enzymes in the liver, through the action of factors such as SREBP1, which preferentially regulate the lipogenic process by activating genes involved in lipid synthesis (Li et al., 2011). Alcohol binging inhibited PPARα, leading to an increase in lipid synthesis and to a reduction of fatty acid oxidation in the liver (Sozio and Crabb, 2008). Our data showed that gentiopicroside abolished hepatic lipid accumulation by regulating SREBP1 and PPARα in acute and chronic alcohol‐induced hepatic steatosis. Activated AMPK phosphorylates and inhibits PPARα and SREBP1 transcriptional activity in hepatocytes. AMPK also phosphorylates ACC, which supplies malonyl‐CoA for fatty acid synthesis (You et al., 2004). The ethanol‐induced decline in phosphorylated‐ACC activity was related to an increase in ACC and a decrease in AMPK activity. Treatment with alcohol suppressed the phosphorylation of AMPK via its upstream kinase, LKB1. As expected, gentiopicroside could elevate the phosphorylation of LKB1 and AMPK, but gentiopicroside treatment leads to increased phosphorylation and decreased activity of ACC both in acute and chronic alcohol‐induced hepatic steatotic mice liver and in HepG2 cells (Figures 1G, 3G and 5C). These results suggest that gentiopicroside ameliorated acute‐on‐chronic alcoholic fatty liver by promoting fatty acid oxidation and inhibiting lipogenesis via LKB1‐AMPK regulation.
Several lines of evidence have indicated that NLRP3/caspase‐1 inflammasome activation and IL‐1β release are involved in the pathogenesis of ALD (Petrasek et al., 2012; DeSantis et al., 2013). P2X7 receptors are known to be involved in alcoholic steatohepatitis and liver fibrosis (Huang et al., 2014; Gentile et al., 2015; Iracheta‐Vellve et al., 2015). IL‐1β is a potent proinflammatory cytokine that is greatly elevated in the liver and serum in both animal models and patients suffering from ALD (Tilg et al., 1992; Dinarello, 2009). Pro‐IL‐1β is cleaved into the bioactive mature IL‐1β by NLRP3 inflammasome‐associated caspase‐1 (Schroder and Tschopp, 2010). Regulating P2X7 receptor‐NLRP3 inflammasome activation with low MW inhibitors might be a potential therapeutic strategy to treat or prevent ALD. Ethanol stimulation induced inflammasome activation as shown by the increase in caspase‐1 activity, and inflammasome activation promotes IL‐1β secretion, whereas these changes were reversed by treatment with gentiopicroside in acute‐on‐chronic alcoholic hepatic steatosis (Figures 2C, G, H and 4C, G, H). Acting as a danger signal, ATP is released from alcohol‐damaged hepatocytes (Iracheta‐Vellve et al., 2015; Petrasek et al., 2015). P2X7 receptor activation by ATP induces NLRP3 inflammasome activation and the release of IL‐1β. In the current study, we demonstrated that P2X7 receptor and NLRP3 expression was increased in acute and chronic ethanol‐induced steatotic mice liver (Figures 2A, B, H and 4A, B). In line with our observations, P2X7 receptor expression and activation are highly elevated in several injured tissues, such as CCl4‐induced liver fibrotic mouse liver (Huang et al., 2014), the neocortex of mice suffering status epilepticus (Jimenez‐Pacheco et al., 2013) and ischaemic acute kidney injury in mice (Yan et al., 2015). P2X7 receptor and NLRP3 expression was also up‐regulated in ethanol‐exposed hepatocytes (Figure 5F, K). Interestingly, silencing P2X7 receptors with siRNA or pharmacologically blocking the P2X7 receptor‐NLRP3 inflammasome prevented the inhibition of AMPK phosphorylation and the increase in SREBP1 by ethanol (Figure 6B, E). These results indicated that P2X7 receptor activation in hepatocytes is involved in ethanol‐induced LKB1‐AMPK‐mediated lipid accumulation, and genetically and pharmacologically inhibiting the P2X7 receptor‐NLRP3 inflammasome pathway by siRNA or low MW compounds might alleviate alcoholic hepatic steatosis.
Macrophages accumulated in the liver in response to alcohol, which is in accordance with histopathological changes in alcoholic patients with ASH (Ju and Mandrekar, 2015). Also, our results showed that macrophages accumulated in the livers of mice in response to acute and chronic alcohol exposure (Figures 2A, B and 4A, B), suggesting that alcohol consumption triggered an inflammatory response. We then investigated whether gentiopicroside suppressed the macrophage inflammasome and whether this suppression was involved in the gentiopicroside‐induced hepatic changes. For this, we utilized the mouse macrophage‐like cell line RAW 264.7 and mouse BMDM to investigate whether gentiopicroside regulates the P2X7 receptor‐NLRP3 inflammasome‐mediated inflammatory response against extracellular ATP. Expression of P2X7 receptor protein was also elevated in LPS‐primed and ATP‐stimulated macrophages (Figures 8A and 9A). Extracellular ATP induces P2X7 receptor‐dependent IL‐1β production and secretion in both types of macrophages (Figures 8A, C and 9A, C), which is consistent with a previous report (Xie et al., 2014). P2X7 receptor knockdown blocked IL‐1β production in LPS‐primed RAW 264.7 macrophages in response to ATP (Figure 8F). These results indicated that P2X7 receptor activation in macrophages induced NLRP3 inflammasome assembly, leading to the release of IL‐1β. P2X7 receptor deficiency might disturb the assembly of the NLRP3 inflammasome and prevent pro‐inflammatory cytokine release from macrophages, thus reversing liver steatosis.
Figure 9.
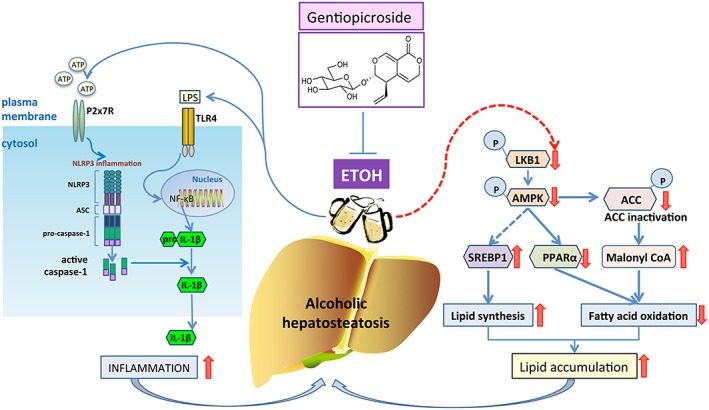
Possible mechanism(s) of suppression of alcoholic hepatosteatosis by gentiopicroside. Activation of LKB1‐AMPK signalling by gentiopicroside (GPS) might be mediated by the P2X7‐NLRP3 inflammasome, suggesting a therapeutic utility of P2X7 receptor blockade in alcoholic hepatosteatosis treatment.
Kupffer cells are well known as the main source of IL‐1β in many models of liver injury, including ALD. To address the link between P2X7 receptor‐NLRP3 inflammasome suppression in macrophage and the anti‐steatotic phenotype in liver, we depleted mice macrophages with clodronate liposomes. In our study, the increase in AMPK and LKB1 phosphorylation following Kupffer cells depletion can be hypothesized to lower IL‐1β derived from macrophages, and gentiopicroside still exhibited a significant anti‐steatotic ability in the absence of macrophages (Supporting Information Figure S7C). IL‐1β promotes lipid accumulation in hepatocytes via suppressing PPARα, resulting in hepatic steatosis (Stienstra et al., 2010). It has been suggested that IL‐1β released from macrophages that were stimulated by ATP released from damaged hepatocytes might affect lipid metabolism in hepatocytes through cell–cell crosstalk. IL‐1β is essential for the induction of lipid accumulation in hepatocytes, and inhibition of IL‐1β secreted from macrophages might control the progression of alcoholic hepatosteatosis (Supporting Information Figure S5G, H). In addition, the decrease in AMPK and LKB1 phosphorylation in HepG2 cells incubated with culture medium from LPS/ATP‐stimulated THP‐1 macrophages suggested that IL‐1β secreted from macrophages accelerates lipid accumulation in hepatocytes in alcoholic hepatosteatosis (Supporting Information Figure S5C), indicating that blocking P2X7 receptor activation in macrophages will be beneficial in relieving lipid accumulation in hepatocytes. These results suggested that gentiopicroside not only suppressed lipid accumulation in hepatocytes but also inhibited IL‐1β secretion in macrophages. Additionally, suppression of the P2X7 receptor‐NLRP3 axis further inhibits the crosstalk between macrophages and steatotic hepatocytes.
In conclusion, activation of LKB1‐AMPK by gentiopicroside leads to a recovery from the lipid accumulation induced by acute and chronic alcohol intake, thereby down‐regulating alcohol‐induced activation of the P2X7 receptor‐mediated NLRP3 inflammasome (Figure 9). These results raise the possibility that modulation of the P2X7 receptor signalling pathway by gentiopicroside could be a therapeutic target for treating alcoholic hepatic steatosis. It will be interesting to initiate clinical research to test the efficacy of P2X7 receptor blockade with gentiopicroside in treating ALD in the future.
Author contributions
X.L. and Y.Z. are the primary investigators in this study. K.‐L.X. participated in part of animal experiments. M.J. and B‐.W.C. participated in part of culture cell experiments. Y.L.W. and S.‐Z.S. participated in part of data analysis. L.‐H.L. and J.‐X.N. designed this study and wrote the manuscript as corresponding authors.
Conflict of interest
The authors declare no conflicts of interest.
Declaration of transparency and scientific rigour
This http://onlinelibrary.wiley.com/doi/10.1111/bph.13405/abstract acknowledges that this paper adheres to the principles for transparent reporting and scientific rigour of preclinical research recommended by funding agencies, publishers and other organisations engaged with supporting research.
Supporting information
Figure S1 Schematic hypothesis for suppression of alcoholic hepatosteatosis by gentiopicroside. Hypothesis 1: gentiopicroside P2X7 receptor‐dependetly regulates lipid accumulation in the livers of acute or chronic‐plus‐binge alcohol fed mice and alcoholic‐induced steatotic hepatocytes. Hypothesis 2: gentiopicroside P2X7 receptor‐dependently inhibits Inflammasome‐mediated release of IL‐1β from macrophages. Hypothesis 3: IL‐1β from activated macrophages promotes lipid accumulation of hepatocytes during alcoholic hepatosteatosis.
Figure S2 Gentiopicroside down‐regulates mRNA expression of P2X7 receptor and Nlrp3 in acute and chronic plus binge alcohol fed‐mice steatotic liver. mRNA expression of P2X7 receptor and Nlrp3 from livers of mice treated as described in Animal experimental procedures (n = 6 in each group). #, P < 0.05, significantly different when compared with normal group; * P < 0.05, significantly different when compared with ethanol‐treated group; one‐way ANOVA followed by Tukey's test. All histograms represent the mean ± SD of five independent assays.
Figure S3 Gentiopicroside regulates lipid accumulation in ethanol‐induced steatotic mouse primary hepatocytes. Mouse primary hepatocytes were incubated with gentiopicroside in the absence or presence of ethanol (50 mM) except untreated cells for 24 h. (A) Lipid deposition in mouse primary hepatocytes was assessed with Oil Red O staining. Images are taken by light microscopy at a magnification of 400×. (B) Immunofluorescence staining of SREBP1. Original images were taken at 200 × magnification. SREBP1 staining (red) and nuclei with DAPI (blue) are shown. Representative images were shown. (F) Relative fluorescence intensity of SREBP1 was analysed with Image Pro‐Plus 6.0. (C) Protein levels of intracellular total‐ and Phosphor‐AMPKα and extracellular procasepae‐1, cleaved caspase‐1, mature IL‐1β were determined using Western Blot analysis. (D, E) Each immunoreactive band was normalized against GAPDH, and relative to normal to control for unwanted sources of variation. (G) IL‐1β protein released to culture medium was determined by elisa assay. The in vitro data are expressed as the mean ± SD of five independent assays. #P < 0.05, significantly different when compared with untreated cells; * P < 0.05, significantly different when compared with ethanol‐treated cells; one‐way ANOVA followed by Tukey's test. Representative images were shown. All histograms represent the mean ± SD.
Figure S4 P2X7 receptor‐NLRP3 inflammasome activation is involved in ethanol‐induced steatosis. HepG2 cells were incubated with A438079 or caspase‐1 inhibitor VI in the absence or presence of ethanol (50 mM) for 24 h. (A) Immunofluorescence staining of SREBP1. Original images were taken at 200 × magnification. SREBP1 staining (red) and nuclei with DAPI (blue) are shown. Representative images were shown. (B) Relative fluorescence intensity of SREBP1 was analysed with Image Pro‐Plus 6.0. (C) Total‐ and Phosphor‐AMPKα and LKB1 protein levels were determined using Western Blot analysis with the whole cell lysates. (D) Each immunoreactive band was normalized against GAPDH, and relative to normal to control for unwanted sources of variation. # P < 0.05, significantly different when compared with untreated cells; * P < 0.05, significantly different when compared with ethanol‐treated cells; one‐way ANOVA followed by Tukey's test. Representative images were shown. All histograms represent the mean ± SD.
Figure S5 IL‐1β from activated macrophages accelerates lipid accumulation in hepatocytes. (A) PMA‐differentiated THP1 macrophages was primed with LPS (1 μg/mL) for 4 h then continuously stimulated ATP (3 mM) for additional 30 min. Intracellular and extracellular pro‐IL‐1β and mature IL‐1β were detected by Western blotting. (B) HepG2 cells were incubated in normal medium containing LPS/ATP or conditioned medium from LPS/ATP‐activated THP‐1 macrophages for 24 h. Lipid deposition in HepG2 cells was assessed with Oil Red O staining (400 × magnification). (C) Total‐ and Phospho‐AMPKα and LKB1 protein levels were determined using Western Blot analysis with the whole HepG2 cells lysates. (D) Each immunoreactive band was normalized against GAPDH, and relative to normal to control for unwanted sources of variation. # P < 0.05, significantly different when compared with untreated normal cells; a P < 0.05, significantly different when compared with cells treated with normal medium containing LPS/ATP; one‐way ANOVA followed by Tukey's test. (E) Immunofluorescence staining of SREBP1. Original images were taken at 200 × magnification. SREBP1 staining (red) and nuclei with DAPI (blue) are shown. Representative images were shown. (F) Relative fluorescence intensity of SREBP1 was analysed with Image Pro‐Plus 6.0. One‐way ANOVA followed by Tukey's test. # P < 0.05, significantly different when compared with untreated normal cells; * P < 0.05, significantly different when compared with cells treated with conditioned medium from LPS/ATP‐activated THP‐1 macrophages. (G) HepG2 cells were incubated with conditioned medium from LPS/ATP‐activated THP‐1 macrophages presence or absence of IL‐1Ra (100 μM) for 24 h. Total‐ and Phospho‐AMPKα and LKB1 protein levels were determined using Western Blot analysis with the whole HepG2 cells lysates. (H) Each immunoreactive band was normalized against GAPDH, and relative to normal to control for unwanted sources of variation. # P < 0.05, significantly different when compared with conditioned medium from untreated THP‐1 macrophages; * P < 0.05, significantly different when compared with cells treated with conditioned medium from LPS/ATP‐activated THP‐1 macrophages; one‐way ANOVA followed by Tukey's test. (I) HepG2 cells were incubated with conditioned medium from LPS/ATP‐activated THP‐1 macrophages containing increasing amounts of neutralizing anti‐human IL‐1β IgG or isotype‐matched IgG for 24 h. (J) Each immunoreactive band was normalized against GAPDH, and relative to normal to control for unwanted sources of variation. #P < 0.05, significantly different when compared with conditioned medium from untreated THP‐1 macrophages; *P < 0.05, significantly different when compared with cells treated with conditioned medium from LPS/ATP‐activated THP‐1 macrophages; one‐way ANOVA followed by Tukey's test. Data are representative of five independent experiments, and all histograms represent the mean ± SD.
Figure S6 Gentiopicroside attenuates alcoholic hepatosteatosis even in absence of macrophages. C57BL/6 mice were pretreated with clodronate liposomes to deplete kupffer cells, then 48 h after injection mice were intragastrically treated with ethanol (5 g kg−1, body weight) or gentiopicroside (40 mg kg−1, body weight) every 12 h for a total of 3 doses. (A) Depletion efficiency was verified by immunofluorescence staining of F4/80 (original magnification 200×). Red arrows mean F4/80 positive stain cells. Representative images were shown. Serum ALT (B), serum and hepatic TG content (C and D). P values were shown in histogram. Statistics was performed by one‐way ANOVA followed by Tukey's test. #P < 0.05, significantly different when compared with PBS/liposomes‐treated mice; *P < 0.05, significantly different when compared clodronate/liposomes‐treated mice; a P < 0.05, significantly different when compared with clodronate/liposomes plus gentiopicroside‐treated mice; b P < 0.05, significantly different when compared with PBS/liposomes plus ethanol‐treated mice. Data are representative of five independent experiments and all histograms represent the mean ± SD (n = 6 per group).
Figure S7 Kupffer cell depletion alleviates alcoholic hepatic steatosis. C57BL/6 mice were pretreated with clodronate liposomes to deplete Kupffer cells, then 48 h after injection mice were intragastrically treated with ethanol (5 g kg−1, body weight) or gentiopicroside (40 mg kg−1, body weight) every 12 h for a total of 3 doses. (A) HE staining (original magnification 200×). (B) Nile red staining (original magnification 200×). (C) Total‐ and phospho‐AMPKα and LKB1 protein levels were determined using Western Blot analysis. (D) Each immunoreactive band was normalized against GAPDH, and relative to normal to control for unwanted sources of variation. P values were shown in histogram. Statistics was performed by one‐way ANOVA followed by Tukey's test. #P < 0.05, significantly different when compared with PBS/liposomes‐treated mice; b P < 0.05, significantly different when compared with PBS/liposomes plus ethanol‐treated mice; c P < 0.05, significantly different when compared with clodronate/liposomes plus ethanol‐treated mice Data are representative of five independent experiments and all histograms represent the mean ± SD (n = 6 per group).
Table S1 Primers sequences used in Real Time PCR.
Acknowledgements
This work was supported by the grants from the National Natural Science Foundation of China (81560597, 81360658, 81660689 and 81260664) and partially by Science and Technology Planning Projects from the Science and Technology Department of Jilin Province (20150520145JH and 20160101205JC to L.‐H.L.; 20130206052YY to J.‐X.N.). This work was also supported in part by the Innovative Research Team of Yanbian University (to J.‐X.N.) and Outstanding Young Talent Cultivation Fund Project of Key Laboratory at Yanbian University (NRFM‐YF201602 to L.‐H.L.).
Li, X. , Zhang, Y. , Jin, Q. , Xia, K.‐L. , Jiang, M. , Cui, B.‐W. , Wu, Y.‐L. , Song, S.‐Z. , Lian, L.‐H. , and Nan, J.‐X. (2018) Liver kinase B1/AMP‐activated protein kinase‐mediated regulation by gentiopicroside ameliorates P2X7 receptor‐dependent alcoholic hepatosteatosis. British Journal of Pharmacology, 175: 1451–1470. doi: 10.1111/bph.14145.
Contributor Information
Li‐Hua Lian, Email: lhlian@ybu.edu.cn.
Ji‐Xing Nan, Email: jxnan@ybu.edu.cn.
References
- Abderrazak A, Syrovets T, Couchie D, El Hadri K, Friguet B, Simmet T et al (2015). NLRP3 inflammasome: from a danger signal sensor to a regulatory node of oxidative stress and inflammatory diseases. Redox Biol 4: 296–307. [DOI] [PMC free article] [PubMed] [Google Scholar]
- Akriviadis E, Botla R, Briggs W, Han S, Reynolds T, Shakil O (2000). Pentoxifylline improves short‐term survival in severe acute alcoholic hepatitis: a double‐blind, placebo‐controlled trial. Gastroenterology 119: 1637–1648. [DOI] [PubMed] [Google Scholar]
- Alexander A, Walker CL (2011). The role of LKB1 and AMPK in cellular responses to stress and damage. FEBS Lett 585: 952–957. [DOI] [PubMed] [Google Scholar]
- Alexander SPH, Cidlowski JA, Kelly E, Marrion NV, Peters JA, Faccenda E et al (2017a). The Concise Guide to PHARMACOLOGY 2017/18: Nuclear hormone receptors. Br J Pharmacol 174: S208–S224. [DOI] [PMC free article] [PubMed] [Google Scholar]
- Alexander SPH, Fabbro D, Kelly E, Marrion NV, Peters JA, Faccenda E et al (2017b). The Concise Guide to PHARMACOLOGY 2017/18: Enzymes. Br J Pharmacol 174: S272–S359. [DOI] [PMC free article] [PubMed] [Google Scholar]
- Alexander SPH, Peters JA, Kelly E, Marrion NV, Faccenda E, Harding SD et al (2017c). The Concise Guide to PHARMACOLOGY 2017/18: Ligand‐gated ion channels. Br J Pharmacol 174: S130–S159. [DOI] [PMC free article] [PubMed] [Google Scholar]
- Alexander SPH, Fabbro D, Kelly E, Marrion NV, Peters JA, Faccenda E et al (2017d). The Concise Guide to PHARMACOLOGY 2017/18: Catalytic receptors. Br J Pharmacol 174: S225–S271. [DOI] [PMC free article] [PubMed] [Google Scholar]
- Aljomah G, Baker SS, Liu W, Kozielski R, Oluwole J, Lupu B et al (2015). Induction of CYP2E1 in non‐alcoholic fatty liver diseases. Exp Mol Pathol 99: 677–681. [DOI] [PMC free article] [PubMed] [Google Scholar]
- Bertola A, Mathews S, Ki SH, Wang H, Gao B (2013a). Mouse model of chronic and binge ethanol feeding (the NIAAA model). Nat Protoc 8: 627–637. [DOI] [PMC free article] [PubMed] [Google Scholar]
- Bertola A, Park O, Gao B (2013b). Chronic plus binge ethanol feeding synergistically induces neutrophil infiltration and liver injury in mice: a critical role for E‐selectin. Hepatology 58: 1814–1823. [DOI] [PMC free article] [PubMed] [Google Scholar]
- Boaru SG, Borkham‐Kamphorst E, Tihaa L, Haas U, Weiskirchen R (2012). Expression analysis of inflammasomes in experimental models of inflammatory and fibrotic liver disease. J Inflamm 9: 49. [DOI] [PMC free article] [PubMed] [Google Scholar]
- Boaru SG, Borkham‐Kamphorst E, Van de Leur E, Lehnen E, Liedtke C, Weiskirchen R (2015). NLRP3 inflammasome expression is driven by NF‐kappaB in cultured hepatocytes. Biochem Biophys Res Commun 458: 700–706. [DOI] [PubMed] [Google Scholar]
- Bosron WF, Edenberg HJ (2010). Comprehensive toxicology In: Guengerich FP. (ed). Alcohol Dehydrogenases. Elsevier Science: Kidlington, United Kingdom, pp. 111–130. [Google Scholar]
- Cui K, Yan G, Xu C, Chen Y, Wang J, Zhou R et al (2015). Invariant NKT cells promote alcohol‐induced steatohepatitis through interleukin‐1beta in mice. J Hepatol 62: 1311–1318. [DOI] [PubMed] [Google Scholar]
- Curtis MJ, Bond RA, Spina D, Ahluwalia A, Alexander SP, Giembycz MA et al (2015). Experimental design and analysis and their reporting: new guidance for publication in BJP. Br J Pharmacol 172: 3461–3471. [DOI] [PMC free article] [PubMed] [Google Scholar]
- DeSantis DA, Ko CW, Liu Y, Liu X, Hise AG, Nunez G et al (2013). Alcohol‐induced liver injury is modulated by Nlrp3 and Nlrc4 inflammasomes in mice. Mediators Inflamm 2013 : 751374, 1, 12. [DOI] [PMC free article] [PubMed] [Google Scholar]
- Dinarello CA (2009). Interleukin‐1beta and the autoinflammatory diseases. N Engl J Med 360: 2467–2470. [DOI] [PubMed] [Google Scholar]
- Donohue TM, Osna NA, Clemens DL (2006). Recombinant Hep G2 cells that express alcohol dehydrogenase and cytochrome P450 2E1 as a model of ethanol‐elicited cytotoxicity. Int J Biochem Cell Biol 38: 92–101. [DOI] [PubMed] [Google Scholar]
- Gao B, Bataller R (2011). Alcoholic liver disease: pathogenesis and new therapeutic targets. Gastroenterology 141: 1572–1585. [DOI] [PMC free article] [PubMed] [Google Scholar]
- Gao L, Shan W, Zeng W, Hu Y, Wang G, Tian X et al (2016). Carnosic acid alleviates chronic alcoholic liver injury by regulating the SIRT1/ChREBP and SIRT1/p66shc pathways in rats. Mol Nutr Food Res 60: 1902–1911. [DOI] [PubMed] [Google Scholar]
- Gentile D, Natale M, Lazzerini PE, Capecchi PL, Laghi‐Pasini F (2015). The role of P2X7 receptors in tissue fibrosis: a brief review. Purinergic Signalling 11: 435–440. [DOI] [PMC free article] [PubMed] [Google Scholar]
- Harding SD, Sharman JL, Faccenda E, Southan C, Pawson AJ, Ireland S et al. (2018). The IUPHAR/BPS Guide to PHARMACOLOGY in 2018: updates and expansion to encompass the new guide to IMMUNOPHARMACOLOGY. Nucl Acids Res 46: D1091–D1106. [DOI] [PMC free article] [PubMed] [Google Scholar]
- Hardman MJ, Page RA, Wiseman MS, Crow KE (1991). Regulation of rates of ethanol metabolism and liver [NAD+NADH] ratio In: Palmer TN. (ed). Alcoholism: A Molecular Perspective. Springer US: Boston, MA, pp. 27–33. [Google Scholar]
- Hu M, Wang F, Li X, Rogers CQ, Liang X, Finck BN et al (2012). Regulation of hepatic lipin‐1 by ethanol: role of AMP‐activated protein kinase/sterol regulatory element‐binding protein 1 signaling in mice. Hepatology 55: 437–446. [DOI] [PMC free article] [PubMed] [Google Scholar]
- Huang C, Yu W, Cui H, Wang Y, Zhang L, Han F et al (2014). P2X7 blockade attenuates mouse liver fibrosis. Mol Med Rep 9: 57–62. [DOI] [PubMed] [Google Scholar]
- Iracheta‐Vellve A, Petrasek J, Satishchandran A, Gyongyosi B, Saha B, Kodys K et al (2015). Inhibition of sterile danger signals, uric acid and ATP, prevents inflammasome activation and protects from alcoholic steatohepatitis in mice. J Hepatol 63: 1147–1155. [DOI] [PMC free article] [PubMed] [Google Scholar]
- Jaurigue MM, Cappell MS (2014). Therapy for alcoholic liver disease. World J Gastroenterol 20: 2143–2158. [DOI] [PMC free article] [PubMed] [Google Scholar]
- Jiang S, Zhang Y, Zheng JH, Li X, Yao YL, Wu YL et al (2017). Potentiation of hepatic stellate cell activation by extracellular ATP is dependent on P2X7R‐mediated NLRP3 inflammasome activation. Pharmacol Res 117: 82–93. [DOI] [PubMed] [Google Scholar]
- Jimenez‐Pacheco A, Mesuret G, Sanz‐Rodriguez A, Tanaka K, Mooney C, Conroy R et al (2013). Increased neocortical expression of the P2X7 receptor after status epilepticus and anticonvulsant effect of P2X7 receptor antagonist A‐438079. Epilepsia 54: 1551–1561. [DOI] [PubMed] [Google Scholar]
- Ju C, Mandrekar P (2015). Macrophages and alcohol‐related liver inflammation. Alcohol Res 37: 251–262. [PMC free article] [PubMed] [Google Scholar]
- Kilkenny C, Browne W, Cuthill IC, Emerson M, Altman DG (2010). Animal research: reporting in vivo experiments: the ARRIVE guidelines. Br J Pharmacol 160: 1577–1579. [DOI] [PMC free article] [PubMed] [Google Scholar]
- Li Y, Xu S, Mihaylova MM, Zheng B, Hou X, Jiang B et al (2011). AMPK phosphorylates and inhibits SREBP activity to attenuate hepatic steatosis and atherosclerosis in diet‐induced insulin‐resistant mice. Cell Metab 13: 376–388. [DOI] [PMC free article] [PubMed] [Google Scholar]
- Lian LH, Wu YL, Song SZ, Wan Y, Xie WX, Li X et al (2010a). Gentiana manshurica Kitagawa reverses acute alcohol‐induced liver steatosis through blocking sterol regulatory element‐binding protein‐1 maturation. J Agric Food Chem 58: 13013–13019. [DOI] [PubMed] [Google Scholar]
- Lian LH, Wu YL, Wan Y, Li X, Xie WX, Nan JX (2010b). Anti‐apoptotic activity of gentiopicroside in D‐galactosamine/lipopolysaccharide‐induced murine fulminant hepatic failure. Chem Biol Interact 188: 127–133. [DOI] [PubMed] [Google Scholar]
- Mandrekar P, Szabo G (2009). Signalling pathways in alcohol‐induced liver inflammation. J Hepatol 50: 1258–1266. [DOI] [PMC free article] [PubMed] [Google Scholar]
- Mathurin P, O'Grady J, Carithers RL, Phillips M, Louvet A, Mendenhall CL et al (2011). Corticosteroids improve short‐term survival in patients with severe alcoholic hepatitis: meta‐analysis of individual patient data. Gut 60: 255–260. [DOI] [PubMed] [Google Scholar]
- McGrath JC, Lilley E (2015). Implementing guidelines on reporting research using animals (ARRIVE etc.): new requirements for publication in BJP. Br J Pharmacol 172: 3189–3193. [DOI] [PMC free article] [PubMed] [Google Scholar]
- Mihailovic V, Katanic J, Misic D, Stankovic V, Mihailovic M, Uskokovic A et al (2014). Hepatoprotective effects of secoiridoid‐rich extracts from Gentiana cruciata L. against carbon tetrachloride induced liver damage in rats. Food Funct 5: 1795–1803. [DOI] [PubMed] [Google Scholar]
- Milora KA, Miller SL, Sanmiguel JC, Jensen LE (2014). Interleukin‐1alpha released from HSV‐1‐infected keratinocytes acts as a functional alarmin in the skin. Nat Commun 5: 5230. [DOI] [PMC free article] [PubMed] [Google Scholar]
- National Research Council (1996). Guide for the Care and Use of Laboratory Animals. The National Academies Press: Washington, DC: https://doi.org/10.17226/5140. [Google Scholar]
- Petrasek J, Bala S, Csak T, Lippai D, Kodys K, Menashy V et al (2012). IL‐1 receptor antagonist ameliorates inflammasome‐dependent alcoholic steatohepatitis in mice. J Clin Invest 122: 3476–3489. [DOI] [PMC free article] [PubMed] [Google Scholar]
- Petrasek J, Iracheta‐Vellve A, Saha B, Satishchandran A, Kodys K, Fitzgerald KA et al (2015). Metabolic danger signals, uric acid and ATP, mediate inflammatory cross‐talk between hepatocytes and immune cells in alcoholic liver disease. J Leukoc Biol 98: 249–256. [DOI] [PMC free article] [PubMed] [Google Scholar]
- Pochareddy S, Edenberg HJ (2012). Chronic alcohol exposure alters gene expression in HepG2 cells. Alcohol Clin Exp Res 36: 1021–1033. [DOI] [PMC free article] [PubMed] [Google Scholar]
- Rakhshandehroo M, Knoch B, Muller M, Kersten S (2010). Peroxisome proliferator‐activated receptor alpha target genes. PPAR Res 2010: 1–20. [DOI] [PMC free article] [PubMed] [Google Scholar]
- Schroder K, Tschopp J (2010). The inflammasomes. Cell 140: 821–832. [DOI] [PubMed] [Google Scholar]
- Sozio M, Crabb DW (2008). Alcohol and lipid metabolism. Am J Physiol Endocrinol Metab 295: E10–E16. [DOI] [PMC free article] [PubMed] [Google Scholar]
- Sozio MS, Lu C, Zeng Y, Liangpunsakul S, Crabb DW (2011). Activated AMPK inhibits PPAR‐{alpha} and PPAR‐{gamma} transcriptional activity in hepatoma cells. Am J Physiol Gastrointest Liver Physiol 301: G739–G747. [DOI] [PMC free article] [PubMed] [Google Scholar]
- Stienstra R, Saudale F, Duval C, Keshtkar S, Groener JE, van Rooijen N et al (2010). Kupffer cells promote hepatic steatosis via interleukin‐1beta‐dependent suppression of peroxisome proliferator‐activated receptor alpha activity. Hepatology 51: 511–522. [DOI] [PubMed] [Google Scholar]
- Szabo G, Mandrekar P (2009). A recent perspective on alcohol, immunity, and host defense. Alcohol Clin Exp Res 33: 220–232. [DOI] [PMC free article] [PubMed] [Google Scholar]
- Tacke F, Zimmermann HW (2014). Macrophage heterogeneity in liver injury and fibrosis. J Hepatol 60: 1090–1096. [DOI] [PubMed] [Google Scholar]
- Tang X, Yang Q, Yang F, Gong J, Han H, Yang L et al (2016). Target profiling analyses of bile acids in the evaluation of hepatoprotective effect of gentiopicroside on ANIT‐induced cholestatic liver injury in mice. J Ethnopharmacol 194: 63–71. [DOI] [PubMed] [Google Scholar]
- Tilg H, Wilmer A, Vogel W, Herold M, Nolchen B, Judmaier G et al (1992). Serum levels of cytokines in chronic liver diseases. Gastroenterology 103: 264–274. [DOI] [PubMed] [Google Scholar]
- Uribe‐Herranz M, Lian LH, Hooper KM, Milora KA, Jensen LE (2013). IL‐1R1 signaling facilitates Munro's microabscess formation in psoriasiform imiquimod‐induced skin inflammation. J Invest Dermatol 133: 1541–1549. [DOI] [PMC free article] [PubMed] [Google Scholar]
- Wang M, Zhang XJ, Feng K, He C, Li P, Hu YJ et al (2016). Dietary alpha‐linolenic acid‐rich flaxseed oil prevents against alcoholic hepatic steatosis via ameliorating lipid homeostasis at adipose tissue‐liver axis in mice. Sci Rep 6: 26826. [DOI] [PMC free article] [PubMed] [Google Scholar]
- Wilkin RJ, Lalor PF, Parker R, Newsome PN (2016). Murine models of acute alcoholic hepatitis and their relevance to human disease. Am J Pathol 186: 748–760. [DOI] [PubMed] [Google Scholar]
- Xie Q, Shen WW, Zhong J, Huang C, Zhang L, Li J (2014). Lipopolysaccharide/adenosine triphosphate induces IL1beta and IL‐18 secretion through the NLRP3 inflammasome in RAW264.7 murine macrophage cells. Int J Mol Med 34: 341–349. [DOI] [PubMed] [Google Scholar]
- Yan G, Lestari R, Long B, Fan Q, Wang Z, Guo X et al (2016). Comparative proteomics analysis reveals l‐arginine activates ethanol degradation pathways in HepG2 cells. Sci Rep 6: 23340. [DOI] [PMC free article] [PubMed] [Google Scholar]
- Yan Y, Bai J, Zhou X, Tang J, Jiang C, Tolbert E et al (2015). P2X7 receptor inhibition protects against ischemic acute kidney injury in mice. Am J Physiol Cell Physiol 308: C463–C472. [DOI] [PMC free article] [PubMed] [Google Scholar]
- Yin H, Hu M, Liang X, Ajmo JM, Li X, Bataller R et al (2014). Deletion of SIRT1 from hepatocytes in mice disrupts lipin‐1 signaling and aggravates alcoholic fatty liver. Gastroenterology 146: 801–811. [DOI] [PMC free article] [PubMed] [Google Scholar]
- You M, Matsumoto M, Pacold CM, Cho WK, Crabb DW (2004). The role of AMP‐activated protein kinase in the action of ethanol in the liver. Gastroenterology 127: 1798–1808. [DOI] [PubMed] [Google Scholar]
- Zhao L, Ye J, Wu GT, Peng XJ, Xia PF, Ren Y (2015). Gentiopicroside prevents interleukin‐1 beta induced inflammation response in rat articular chondrocyte. J Ethnopharmacol 172: 100–107. [DOI] [PubMed] [Google Scholar]
Associated Data
This section collects any data citations, data availability statements, or supplementary materials included in this article.
Supplementary Materials
Figure S1 Schematic hypothesis for suppression of alcoholic hepatosteatosis by gentiopicroside. Hypothesis 1: gentiopicroside P2X7 receptor‐dependetly regulates lipid accumulation in the livers of acute or chronic‐plus‐binge alcohol fed mice and alcoholic‐induced steatotic hepatocytes. Hypothesis 2: gentiopicroside P2X7 receptor‐dependently inhibits Inflammasome‐mediated release of IL‐1β from macrophages. Hypothesis 3: IL‐1β from activated macrophages promotes lipid accumulation of hepatocytes during alcoholic hepatosteatosis.
Figure S2 Gentiopicroside down‐regulates mRNA expression of P2X7 receptor and Nlrp3 in acute and chronic plus binge alcohol fed‐mice steatotic liver. mRNA expression of P2X7 receptor and Nlrp3 from livers of mice treated as described in Animal experimental procedures (n = 6 in each group). #, P < 0.05, significantly different when compared with normal group; * P < 0.05, significantly different when compared with ethanol‐treated group; one‐way ANOVA followed by Tukey's test. All histograms represent the mean ± SD of five independent assays.
Figure S3 Gentiopicroside regulates lipid accumulation in ethanol‐induced steatotic mouse primary hepatocytes. Mouse primary hepatocytes were incubated with gentiopicroside in the absence or presence of ethanol (50 mM) except untreated cells for 24 h. (A) Lipid deposition in mouse primary hepatocytes was assessed with Oil Red O staining. Images are taken by light microscopy at a magnification of 400×. (B) Immunofluorescence staining of SREBP1. Original images were taken at 200 × magnification. SREBP1 staining (red) and nuclei with DAPI (blue) are shown. Representative images were shown. (F) Relative fluorescence intensity of SREBP1 was analysed with Image Pro‐Plus 6.0. (C) Protein levels of intracellular total‐ and Phosphor‐AMPKα and extracellular procasepae‐1, cleaved caspase‐1, mature IL‐1β were determined using Western Blot analysis. (D, E) Each immunoreactive band was normalized against GAPDH, and relative to normal to control for unwanted sources of variation. (G) IL‐1β protein released to culture medium was determined by elisa assay. The in vitro data are expressed as the mean ± SD of five independent assays. #P < 0.05, significantly different when compared with untreated cells; * P < 0.05, significantly different when compared with ethanol‐treated cells; one‐way ANOVA followed by Tukey's test. Representative images were shown. All histograms represent the mean ± SD.
Figure S4 P2X7 receptor‐NLRP3 inflammasome activation is involved in ethanol‐induced steatosis. HepG2 cells were incubated with A438079 or caspase‐1 inhibitor VI in the absence or presence of ethanol (50 mM) for 24 h. (A) Immunofluorescence staining of SREBP1. Original images were taken at 200 × magnification. SREBP1 staining (red) and nuclei with DAPI (blue) are shown. Representative images were shown. (B) Relative fluorescence intensity of SREBP1 was analysed with Image Pro‐Plus 6.0. (C) Total‐ and Phosphor‐AMPKα and LKB1 protein levels were determined using Western Blot analysis with the whole cell lysates. (D) Each immunoreactive band was normalized against GAPDH, and relative to normal to control for unwanted sources of variation. # P < 0.05, significantly different when compared with untreated cells; * P < 0.05, significantly different when compared with ethanol‐treated cells; one‐way ANOVA followed by Tukey's test. Representative images were shown. All histograms represent the mean ± SD.
Figure S5 IL‐1β from activated macrophages accelerates lipid accumulation in hepatocytes. (A) PMA‐differentiated THP1 macrophages was primed with LPS (1 μg/mL) for 4 h then continuously stimulated ATP (3 mM) for additional 30 min. Intracellular and extracellular pro‐IL‐1β and mature IL‐1β were detected by Western blotting. (B) HepG2 cells were incubated in normal medium containing LPS/ATP or conditioned medium from LPS/ATP‐activated THP‐1 macrophages for 24 h. Lipid deposition in HepG2 cells was assessed with Oil Red O staining (400 × magnification). (C) Total‐ and Phospho‐AMPKα and LKB1 protein levels were determined using Western Blot analysis with the whole HepG2 cells lysates. (D) Each immunoreactive band was normalized against GAPDH, and relative to normal to control for unwanted sources of variation. # P < 0.05, significantly different when compared with untreated normal cells; a P < 0.05, significantly different when compared with cells treated with normal medium containing LPS/ATP; one‐way ANOVA followed by Tukey's test. (E) Immunofluorescence staining of SREBP1. Original images were taken at 200 × magnification. SREBP1 staining (red) and nuclei with DAPI (blue) are shown. Representative images were shown. (F) Relative fluorescence intensity of SREBP1 was analysed with Image Pro‐Plus 6.0. One‐way ANOVA followed by Tukey's test. # P < 0.05, significantly different when compared with untreated normal cells; * P < 0.05, significantly different when compared with cells treated with conditioned medium from LPS/ATP‐activated THP‐1 macrophages. (G) HepG2 cells were incubated with conditioned medium from LPS/ATP‐activated THP‐1 macrophages presence or absence of IL‐1Ra (100 μM) for 24 h. Total‐ and Phospho‐AMPKα and LKB1 protein levels were determined using Western Blot analysis with the whole HepG2 cells lysates. (H) Each immunoreactive band was normalized against GAPDH, and relative to normal to control for unwanted sources of variation. # P < 0.05, significantly different when compared with conditioned medium from untreated THP‐1 macrophages; * P < 0.05, significantly different when compared with cells treated with conditioned medium from LPS/ATP‐activated THP‐1 macrophages; one‐way ANOVA followed by Tukey's test. (I) HepG2 cells were incubated with conditioned medium from LPS/ATP‐activated THP‐1 macrophages containing increasing amounts of neutralizing anti‐human IL‐1β IgG or isotype‐matched IgG for 24 h. (J) Each immunoreactive band was normalized against GAPDH, and relative to normal to control for unwanted sources of variation. #P < 0.05, significantly different when compared with conditioned medium from untreated THP‐1 macrophages; *P < 0.05, significantly different when compared with cells treated with conditioned medium from LPS/ATP‐activated THP‐1 macrophages; one‐way ANOVA followed by Tukey's test. Data are representative of five independent experiments, and all histograms represent the mean ± SD.
Figure S6 Gentiopicroside attenuates alcoholic hepatosteatosis even in absence of macrophages. C57BL/6 mice were pretreated with clodronate liposomes to deplete kupffer cells, then 48 h after injection mice were intragastrically treated with ethanol (5 g kg−1, body weight) or gentiopicroside (40 mg kg−1, body weight) every 12 h for a total of 3 doses. (A) Depletion efficiency was verified by immunofluorescence staining of F4/80 (original magnification 200×). Red arrows mean F4/80 positive stain cells. Representative images were shown. Serum ALT (B), serum and hepatic TG content (C and D). P values were shown in histogram. Statistics was performed by one‐way ANOVA followed by Tukey's test. #P < 0.05, significantly different when compared with PBS/liposomes‐treated mice; *P < 0.05, significantly different when compared clodronate/liposomes‐treated mice; a P < 0.05, significantly different when compared with clodronate/liposomes plus gentiopicroside‐treated mice; b P < 0.05, significantly different when compared with PBS/liposomes plus ethanol‐treated mice. Data are representative of five independent experiments and all histograms represent the mean ± SD (n = 6 per group).
Figure S7 Kupffer cell depletion alleviates alcoholic hepatic steatosis. C57BL/6 mice were pretreated with clodronate liposomes to deplete Kupffer cells, then 48 h after injection mice were intragastrically treated with ethanol (5 g kg−1, body weight) or gentiopicroside (40 mg kg−1, body weight) every 12 h for a total of 3 doses. (A) HE staining (original magnification 200×). (B) Nile red staining (original magnification 200×). (C) Total‐ and phospho‐AMPKα and LKB1 protein levels were determined using Western Blot analysis. (D) Each immunoreactive band was normalized against GAPDH, and relative to normal to control for unwanted sources of variation. P values were shown in histogram. Statistics was performed by one‐way ANOVA followed by Tukey's test. #P < 0.05, significantly different when compared with PBS/liposomes‐treated mice; b P < 0.05, significantly different when compared with PBS/liposomes plus ethanol‐treated mice; c P < 0.05, significantly different when compared with clodronate/liposomes plus ethanol‐treated mice Data are representative of five independent experiments and all histograms represent the mean ± SD (n = 6 per group).
Table S1 Primers sequences used in Real Time PCR.