

Abstract
Homorepeat (HR) proteins are involved in key biological processes and multiple pathologies, however their high‐resolution characterization has been impaired due to their homotypic nature. To overcome this problem, we have developed a strategy to isotopically label individual glutamines within HRs by combining nonsense suppression and cell‐free expression. Our method has enabled the NMR investigation of huntingtin exon1 with a 16‐residue polyglutamine (poly‐Q) tract, and the results indicate the presence of an N‐terminal α‐helix at near neutral pH that vanishes towards the end of the HR. The generality of the strategy was demonstrated by introducing a labeled glutamine into a pathological version of huntingtin with 46 glutamines. This methodology paves the way to decipher the structural and dynamic perturbations induced by HR extensions in poly‐Q‐related diseases. Our approach can be extended to other amino acids to investigate biological processes involving proteins containing low‐complexity regions (LCRs).
Keywords: genetic code expansion, homorepeat proteins, huntingtin, NMR spectroscopy, protein structures
While the majority of protein sequences are aperiodic and feature most of the 20 proteinogenic amino acids, many protein sequences harbor low‐complexity regions (LCRs). LCRs are unusually simple sequences with a strong bias in their amino acid composition.1 A subfamily of LCRs termed homorepeats (HRs) presents sequences with repetitions of just one amino acid. HRs are abundant in eukaryotes, in which around 15 % of the proteome contains at least one repeat, and this represents an important source of genetic variability. Furthermore, HRs are conserved in specific functional classes of proteins, such as transcription factors and developmental proteins, where they increase functional versatility by mediating biomolecular interactions and facilitate spatial organization.2, 3 The abundance of HR‐hosting proteins is tightly regulated due to their potential detrimental effects, which explains why more than 40 % of proteins with multiple HRs are involved in human diseases.4 Although HRs from all amino acids have been reported, the most abundant are hydrophilic, and are characterized by a high level of disorder, which in many cases precludes crystallization.2, 5, 6 As a consequence, they are underrepresented in the Protein Data Bank (PDB), thus highlighting the need for novel approaches for their structural and dynamic characterization.
The most common type of HRs in eukaryotes are polyglutamine (poly‐Q) repeats.2 Moreover, poly‐Q expansions form the basis of at least ten neurodegenerative disorders, including Huntington's Disease (HD), Kennedy's disease, and several ataxias.6, 7 HD is the most abundant and most well studied poly‐Q‐related disorder. The causative agent of this deadly neurodegenerative pathology is the huntingtin protein (htt).4, 7 Although full‐length htt has more than 3000 residues, the first exon (exon1; Figure 1 a), which contains the poly‐Q tract, is sufficient to replicate much of the pathology in cell and animal models.8 Importantly, only individuals with more than 35 consecutive glutamines (pathological threshold) develop HD symptoms, and disease onset and severity are correlated to the length of the poly‐Q expansion.7 All poly‐Q‐related diseases present similar pathological thresholds, thus suggesting a common amyloidogenic mechanism.9
Figure 1.
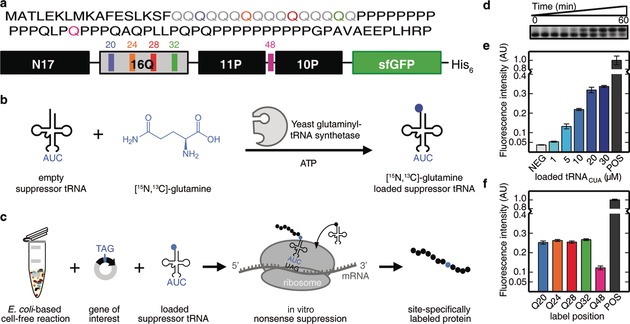
General Scheme, validation, and optimization of the method. a) Amino acid sequence of huntingtin exon1 containing 16 consecutive glutamines and schematic representation of the sfGFP fusion construct used in this study. N17=17 N‐terminal residues; 16Q=polyglutamine tract with 16Q; 11P and 10P=polyproline tracts; sfGFP=superfolder GFP. The glutamines studied by NMR are highlighted in different colors (Q20 blue, Q24 orange, Q28 red, Q32 green, and Q48 magenta). The same color scheme is used throughout the manuscript. b) Enzymatic loading of suppressor tRNACUA. In vitro transcribed suppressor tRNACUA is incubated with the yeast glutaminyl‐tRNA synthetase, [15N,13C]‐glutamine, and ATP to yield loaded suppressor tRNACUA. c) Site‐specific labeling is achieved by adding the loaded suppressor tRNACUA to the cell‐free reaction in the presence of a plasmid coding for htt exon1 with an amber stop codon replacing the codon for the residue to be studied by NMR. d) Time course following the enzymatic loading of suppressor tRNACUA. Upper and lower bands correspond to loaded and unloaded suppressor tRNACUA, respectively. Samples were taken at t=0, 0.16, 0.5, 1, 2, 5, 10, 15, 30, and 60 min. e) Titration of cell‐free reactions with increasing concentrations of loaded tRNACUA. The plasmid with an amber stop codon replacing the codon for Q20 (H16Q20) was used. NEG=negative control without suppressor tRNACUA. POS=positive control using a plasmid without the amber stop codon. f) Screening of several constructs for which the amber stop codon was placed at the position of Q20, Q24, Q28, Q32, or Q48 using 10 μm of loaded suppressor tRNACUA.
A hallmark of HD is the presence of neuronal inclusions containing htt exon1 aggregates that have been linked to the aggregation behavior of poly‐Q constructs in vitro.7, 9 So far, structural studies on htt exon1 constructs in solution have used computational10 or low‐resolution approaches,10, 11, 12, 13 and focused mainly on the overall properties of the poly‐Q tract. Unfortunately, these studies have reported contradictory observations regarding the conformational preferences of the HR. Similar observations have been obtained from crystallographic studies of non‐aggregated poly‐Q constructs: while a peptide of 10 consecutive glutamines in complex with an antibody showed an extended structure,14 a construct with 17 Qs in the context of htt exon1 showed multiple conformations (helix, random coil, and extended loop), and only the initial residues were visible on the map.15 More recently, Baias et al. assigned the backbone resonances and studied the secondary‐structure propensities of a shortened exon1 construct using pH titrations and high‐dimensional (5D) NMR experiments.16 While this study managed to assign 17 glutamines, it is questionable whether this approach could be applied to constructs with longer poly‐Q tracts where the similarity of the chemical environments within the poly‐Q would yield poorly resolved NMR spectra. The lack of general approaches to perform NMR studies on poly‐Q‐hosting proteins precludes the understanding of structural features such as residue‐specific conformational preferences, structural cooperativity within HRs, and the presence of intra‐molecular interactions. Consequently, the structural basis of the pathological threshold, and the putative presence of a subpopulation of toxic conformers beyond this threshold remain speculative.
Herein, we present a strategy that overcomes the aforementioned limitations and enables the detailed characterization of poly‐Q HRs independent of their lengths. We site‐specifically introduce a unique [15N,13C]‐labeled glutamine into an otherwise unlabeled htt exon1 poly‐Q tract with 16 glutamines (H16) by combining nonsense suppression17 and cell‐free (CF) protein synthesis18 (Figure 1). In contrast to earlier studies,17, 19, 20 our method makes use of a synthetic orthogonal and in vitro transcribed suppressor tRNA/glutaminyl‐tRNA synthetase (GlnRS) pair based on the tRNAGln from Saccharomyces cerevisiae (Figure 1 b). The GlnRS allows rapid (<60 minutes) charging of up to 90 % of the nonsense suppressor tRNA (tRNACUA) with commercially available [15N,13C]‐glutamine (Figure 1 d). The loaded tRNACUA is then added to a CF reaction that uses release factor‐1 (RF1)‐depleted Escherichia coli extracts originating from BL21 Star (DE3)::RF1‐CBD3 cells, which has been shown to increase the yield of CF suppression reactions.18 In order to determine the optimal suppression conditions, we optimized the CF reaction conditions on a small scale (50 μL) by adding increasing amounts of loaded tRNACUA (Figure 1 e). To monitor the titration, we used a plasmid coding for the htt exon1 construct fused to superfolder GFP (sfGFP), in which the Q20 codon was substituted with the amber stop codon (see Figure 1 a and the Supporting Information).
The titration showed that increasing concentrations of loaded tRNACUA resulted in better suppression yields (ca. 37 % of the positive control at 30 μm of loaded tRNACUA). However, the yield increase was not linear above concentrations of 10 μm. Thus, we used 10 μm of loaded tRNACUA for large‐scale protein production. We subsequently investigated the position effect on the suppression efficiency by placing the amber stop codon in a set of non‐consecutive glutamine positions spanning the whole htt exon1, including the HR tract (Q20, Q24, Q28, Q32) and the proline‐rich region (Q48; Figure 1 a). While the suppression efficiency within the poly‐Q tract remained stable (ca. 25 %), the yield of H16Q48 was approximately half (Figure 1 f). We attribute this lower efficiency to the intercalated position of the glutamine between two prolines (Figure 1 a), which present the slowest translational velocity among the 20 natural amino acids.21
Using optimized CF conditions, we prepared residue‐specifically [15N,13C]‐labeled htt exon1 samples of the aforementioned glutamine positions. A 5 mL reaction was sufficient to conduct 15N and 13C heteronuclear NMR experiments and structurally probe these residues (Figure 2). The simplicity of the spectra allowed the precise measurement of backbone and side‐chain chemical shifts, thus avoiding the inherent overlap present in the fully labeled version of the protein (Figure 2 b,d and Table S1). Inspection of the spectra regarding the different glutamine residues indicates a reasonable dispersion of the 1H‐15N correlations for residues closer to the N17 region, however Q32 (at the end of the HR) and Q48 (in the proline‐rich region) overlap (Figure 2 d). Interestingly, the Q48 1H‐15N HSQC presents a second less‐intense peak (ca. 1:0.2) that corresponds to the population of this residue when preceding a cis‐proline (Figure 2 b and Figure S3). The dispersion of the 1H‐13C correlations diminishes along the side chain (from Hα‐Cα to Hγ‐Cγ), thus indicating an increase in mobility and a reduced influence of the backbone conformation.
Figure 2.
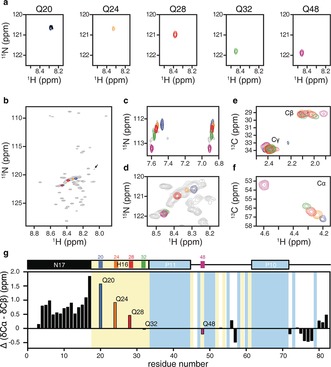
NMR analyses of H16. a) Individual backbone resonances of site‐specifically labeled glutamines H16Q20, H16Q24, H16Q28, H16Q32, and H16Q48 in context of htt exon1. b) Overlay of the single‐residue 1H‐15N HSQC spectra of H16 with that of the fully labeled H16 htt exon1. The arrow indicates the population of Q48 preceding a cis‐proline. c) Enlarged view of the H16 1H‐15N HSQC spectra showing the glutamine side chains. d) Zoom on the poly‐Q region of the H16 1H‐15N HSQC spectra showing individual Qs overlaid on fully labeled htt exon1. 1H‐13C HSQC NMR spectra showing the Cβ and Cγ (e) and the Cα (f) regions. g) Secondary chemical‐shift analysis on H16 using experimental Cα and Cβ chemical shifts and a random‐coil library.22 A schematic representation of htt exon1 is shown to indicate the different domains, and the positions of Q and P residues are highlighted in yellow and blue, respectively.
We then proceeded to the assignment of H16 by applying 3D NMR experiments to two samples produced under CF conditions using [15N,13C]‐labeled algal extract with or without added [15N,13C]‐glutamine (Figure S1 in the Supporting Information). Following this strategy, 28 out of the 30 non‐proline, non‐glutamine backbone resonances of htt exon1 were assigned (Figure S2). Access to backbone chemical shifts enabled the derivation of secondary‐structure elements of the protein. Secondary chemical shift (SCS) values for H16 at pH 6.5 were computed as the difference between the measured chemical shifts and their amino acid specific random‐coil values using neighbor amino acid sequence corrections employing a well‐established random‐coil chemical‐shift database.22 Figure 2 g, which displays the SCS difference between Cα and Cβ for htt exon1, indicates that the 17 N‐terminal residues (N17) have a strong propensity for α‐helical structure that increases when approaching the HR, which is in agreement with previous NMR studies.16, 23 Along the poly‐Q tract, a systematic decrease in helical propensity is observed, with Q32 presenting random‐coil chemical shifts. The helical tendency within the poly‐Q region causes the up‐field shift of the glutamine peak cluster in the 1H‐15N‐HSQC (Figure 2 d), and increases the dispersion of the Hα‐Cα correlations (Figure 2 f). Finally, at the end of the C‐terminal proline‐rich region, deviations from the random‐coil chemical shifts become less profound, with a greater tendency towards extended structure, which is most likely due to an enrichment in polyproline‐II conformations.
We explored the potential for applying our strategy to longer poly‐Q tracts by isotopically labeling Q20 in htt exon1 with 46 consecutive glutamines (H46Q20). An NMR sample was obtained from a 10 mL CF production upon addition of 10 μm [15N,13C]‐glutamine‐loaded tRNACUA (Figure S6). Interestingly, the 1H‐15N HSQC displays two peaks for Q20 in the context of a longer poly‐Q tract (Figure S6). This observation suggests the coexistence of at least two conformations in slow exchange that are not present in the non‐pathological construct. Further experiments will be necessary to fully characterize the origin of this difference.
In summary, we present a novel strategy that combines CF expression and nonsense suppression to gain high‐resolution structural and dynamic information on inaccessible poly‐Q regions. We demonstrated the robustness of our approach using huntingtin, the causative agent of HD, as a model protein, and the results reveal the presence of helical regions at the N‐terminus, encompassing N17 and the first portion of the poly‐Q tract. With this method, NMR observables such as residual dipolar couplings and paramagnetic relaxation enhancement can be precisely measured to decipher local conformational propensities, structural cooperativity, and intramolecular interactions in HR regions. The experiments performed on a pathological htt (H46) demonstrate that, in contrast to other strategies based on the use of high‐dimensional NMR spectra, our method is independent of the length of the poly‐Q expansion.16, 24 Consequently, this approach paves the way for investigation of the structural basis of the pathological threshold found in at least ten different poly‐Q diseases. The development of other orthogonal tRNA/synthetase pairs or the use of established synthetic tools, such as flexizyme25 or chemical aminoacylation,17 to load nonsense tRNA with natural amino acids could extend the described strategy for the exploration of other LCRs. In this way, this important but structurally elusive family of proteins can be investigated at high resolution to decipher the structural basis of crucial biological processes and to guide drug design.
Conflict of interest
The authors declare no conflict of interest.
Supporting information
As a service to our authors and readers, this journal provides supporting information supplied by the authors. Such materials are peer reviewed and may be re‐organized for online delivery, but are not copy‐edited or typeset. Technical support issues arising from supporting information (other than missing files) should be addressed to the authors.
Supplementary
Acknowledgements
The authors thank Gottfried Otting for providing the BL21 (DE3) Star::RF1‐CBD3 strain. This work was supported by the European Research Council under the European Union's H2020 Framework Programme (2014–2020)/ ERC Grant agreement n°[648030] and Labex EpiGenMed, an « Investissements d'avenir » program (ANR‐10‐LABX‐12‐01) awarded to P.B.. The CBS is a member of France‐BioImaging (FBI) and the French Infrastructure for Integrated Structural Biology (FRISBI), two national infrastructures supported by the French National Research Agency (ANR‐10‐INSB‐04‐01 and ANR‐10‐INSB‐05, respectively). A.U. is supported by a grant from the Fondation pour la Recherche Médicale (SPF20150934061). The authors thank Lionel Imbert, IBS cell‐free facility, for his technical help and valuable advice. This work used the Cell‐Free facility at the Grenoble Instruct Centre (ISBG; UMS 3518 CNRS‐CEA‐UJF‐EMBL) with support from Instruct (PID: 1552) within the Grenoble Partnership for Structural Biology (PSB).
A. Urbanek, A. Morató, F. Allemand, E. Delaforge, A. Fournet, M. Popovic, S. Delbecq, N. Sibille, P. Bernadó, Angew. Chem. Int. Ed. 2018, 57, 3598.
References
- 1. Wootton J. C., Curr. Opin. Struct. Biol. 1994, 4, 413–421. [Google Scholar]
- 2. Jorda J., Kajava A. V., Adv. Protein Chem. Struct. Biol. 2010, 79, 59–88. [DOI] [PubMed] [Google Scholar]
- 3. Chavali S., Chavali P. L., Chalancon G., de Groot N. S., Gemayel R., Latysheva N. S., Ing-Simmons E., Verstrepen K. J., Balaji S., Babu M. M., Nat. Struct. Mol. Biol. 2017, 24, 765–777. [DOI] [PMC free article] [PubMed] [Google Scholar]
- 4. Karlin S., Brocchieri L., Bergman A., Mrazek J., Gentles A. J., Proc. Natl. Acad. Sci. USA 2002, 99, 333–338. [DOI] [PMC free article] [PubMed] [Google Scholar]
- 5. Jorda J., Xue B., Uversky V. N., Kajava A. V., FEBS J. 2010, 277, 2673–2682. [DOI] [PMC free article] [PubMed] [Google Scholar]
- 6. Darling A. L., Uversky V. N., Molecules 2017, 22, 2027. [DOI] [PMC free article] [PubMed] [Google Scholar]
- 7. Adegbuyiro A., Sedighi F., Pilkington A. W., Groover S., Legleiter J., Biochemistry 2017, 56, 1199–1217. [DOI] [PMC free article] [PubMed] [Google Scholar]
- 8. Mangiarini L., Sathasivam K., Seller M., Cozens B., Harper A., Hetherington C., Lawton M., Trottier Y., Lehrach H., Davies S. W., et al., Cell 1996, 87, 493–506. [DOI] [PubMed] [Google Scholar]
- 9. Zoghbi H. Y., Orr H. T., Annu. Rev. Neurosci. 2000, 23, 217–247. [DOI] [PubMed] [Google Scholar]
- 10. Warner J. B., Ruff K. M., Tan P. S., Lemke E. A., Pappu R. V., Lashuel H. A., J. Am. Chem. Soc. 2017, 139, 14456–14469. [DOI] [PMC free article] [PubMed] [Google Scholar]
- 11. Bhattacharyya A., Thakur A. K., Chellgren V. M., Thiagarajan G., Williams A. D., Chellgren B. W., Creamer T. P., Wetzel R., J. Mol. Biol. 2006, 355, 524–535. [DOI] [PubMed] [Google Scholar]
- 12. Crick S. L., Jayaraman M., Frieden C., Wetzel R., Pappu R. V., Proc. Natl. Acad. Sci. USA 2006, 103, 16764–16769. [DOI] [PMC free article] [PubMed] [Google Scholar]
- 13. Peters-Libeu C., Miller J., Rutenber E., Newhouse Y., Krishnan P., Cheung K., Hatters D., Brooks E., Widjaja K., Tran T., et al., J. Mol. Biol. 2012, 421, 587–600. [DOI] [PMC free article] [PubMed] [Google Scholar]
- 14. Li P., Huey-Tubman K. E., Gao T., Li X., West A. P., Bennett M. J., Bjorkman P. J., Nat. Struct. Mol. Biol. 2007, 14, 381–387. [DOI] [PubMed] [Google Scholar]
- 15. Kim M. W., Chelliah Y., Kim S. W., Otwinowski Z., Bezprozvanny I., Structure 2009, 17, 1205–1212. [DOI] [PMC free article] [PubMed] [Google Scholar]
- 16. Baias M., Smith P. E. S., Shen K., Joachimiak L. A., Żerko S., Koźmiński W., Frydman J., Frydman L., J. Am. Chem. Soc. 2017, 139, 1168–1176. [DOI] [PubMed] [Google Scholar]
- 17. Noren C. J., Anthony-Cahill S. J., Griffith M. C., Schultz P. G., Science 1989, 244, 182–188. [DOI] [PubMed] [Google Scholar]
- 18. Loscha K. V., Herlt A. J., Qi R., Huber T., Ozawa K., Otting G., Angew. Chem. Int. Ed. 2012, 51, 2243–2246; [DOI] [PubMed] [Google Scholar]; Angew. Chem. 2012, 124, 2286–2289. [Google Scholar]
- 19. Peuker S., Andersson H., Gustavsson E., Maiti K. S., Kania R., Karim A., Niebling S., Pedersen A., Erdelyi M., Westenhoff S., J. Am. Chem. Soc. 2016, 138, 2312–2318. [DOI] [PubMed] [Google Scholar]
- 20. Ellman J. A., Volkman B. F., Mendel D., Schulz P. G., Wemmer D. E., J. Am. Chem. Soc. 1992, 114, 7959–7961. [Google Scholar]
- 21. Pavlov M. Y., Watts R. E., Tan Z., Cornish V. W., Ehrenberg M., Forster A. C., Proc. Natl. Acad. Sci. USA 2009, 106, 50–54. [DOI] [PMC free article] [PubMed] [Google Scholar]
- 22. Kjaergaard M., Poulsen F. M., J. Biomol. NMR 2011, 50, 157–165. [DOI] [PubMed] [Google Scholar]
- 23. Thakur A. K., Jayaraman M., Mishra R., Thakur M., Chellgren V. M., Byeon I.-J. L., Anjum D. H., Kodali R., Creamer T. P., Conway J. F., et al., Nat. Struct. Mol. Biol. 2009, 16, 380–389. [DOI] [PMC free article] [PubMed] [Google Scholar]
- 24. Eftekharzadeh B., Piai A., Chiesa G., Mungianu D., García J., Pierattelli R., Felli I. C., Salvatella X., Biophys. J. 2016, 110, 2361–2366. [DOI] [PMC free article] [PubMed] [Google Scholar]
- 25. Murakami H., Ohta A., Ashigai H., Suga H., Nat. Methods 2006, 3, 357–359. [DOI] [PubMed] [Google Scholar]
Associated Data
This section collects any data citations, data availability statements, or supplementary materials included in this article.
Supplementary Materials
As a service to our authors and readers, this journal provides supporting information supplied by the authors. Such materials are peer reviewed and may be re‐organized for online delivery, but are not copy‐edited or typeset. Technical support issues arising from supporting information (other than missing files) should be addressed to the authors.
Supplementary