

Abstract
Increase in human life expectancy has resulted in the rapid growth of the elderly population with minimal or no intellectual deterioration. The aim of this stereological study of 10 structures and 5 subdivisions with and without neurofibrillary degeneration in the brains of 28 individuals 25–102-years-old was to establish the pattern of age-associated neurodegeneration and neuronal loss in the brains of nondemented adults and elderly. The study revealed the absence of significant neuronal loss in 7 regions and topographically selective reduction of neuronal reserve over 77 years in 8 brain structures including the entorhinal cortex (EC) (−33.3%), the second layer of the EC (−54%), cornu Ammonis sector 1 (CA1) (−28.5%), amygdala, (−45.8%), thalamus (−40.5%), caudate nucleus (−35%), Purkinje cells (−48.3%), and neurons in the dentate nucleus (40.1%). A similar rate of neuronal loss in adults and elderly, without signs of accelerating neuronal loss in agers or super-agers, appears to indicate age-associated brain remodeling with significant reduction of neuronal reserve in 8 brain regions. Multivariate analysis demonstrates the absence of a significant association between neuronal loss and the severity of neurofibrillary degeneration and β-amyloidosis, and a similar rate of age-associated neuronal loss in structures with and without neurofibrillary degeneration.
Keywords: β-Amyloidosis, Brain aging, Neuronal loss, Neuronal reserve, Neurofibrillary degeneration
INTRODUCTION
The increase in life expectancy at birth from 47 years in 1900 to 77 years in 2000 has been associated with fast growth of the population 65 years of age and older. In the United States, this population is expected to grow from 35 million in 2000 to 72 million in 2030 (1). The classification of people 65 and older as elderly and the subclassification of elderly as young-old (65–74 years), middle-old (75–84), and oldest-old (85 and older) reflects the chronological staging of a biological process. The oldest-old population is growing faster than the other age groups, both internationally and nationally, and has increased in the United States to ∼1.9 million (2). The estimated 300–450 individuals older than 110 years of age of the more than 7 billion people alive (3) delineates the current limits of the oldest-old.
While a great deal of attention has focused on the impact of advanced aging on old-age associated decline, another consequence is an expanded population of individuals experiencing successful aging, defined as aging that is free of chronic disease with few or no physical or intellectual limitations (4). Although aging per se is obligatorily normal, biological aging is associated with the accumulation of deleterious changes in cells and tissues (5), and it is of great importance to understand how these changes unfold over time and how to distinguish them from disease-related pathological processes.
The most prevalent age-associated pathology is neurofibrillary degeneration, detected even in some individuals younger than 30 years of age (6). Neurodegeneration in the transentorhinal-entorhinal region begins during early adulthood and progresses throughout life, as demonstrated in Braak and Braak (7) staging. In Braak stages I and II, neurofibrillary degeneration develops in the entorhinal-perirhinal cortex, and in stages III and IV, in the hippocampus, amygdala, and magnocellular basal complex (MBC). In stages V and VI, neurofibrillary degeneration spreads to all neocortical subdivisions (8), and the majority of the elderly with stages V and VI are diagnosed with Alzheimer disease (AD). After the age of 65 years, the incidence of dementia doubles every 5 years (9), and the prevalence of dementia increases to 88% in those 100 years of age and older (10).
However, the association between Alzheimer-type pathology and dementia weakens in 75- to 95-year-old subjects (11) and in “supernormal centenarians” (12–15). In a study of individuals 90 years of age and older, 22% of participants with dementia did not have sufficient AD pathology to account for their cognitive loss (16). The correlation between AD and ApoE4 in younger subjects with AD but the lack of this association in centenarians indicates another aspect of the dissociation of AD from aging (17). Although the pathological process underlying AD does not inevitably lead to dementia (18, 19), AD remains the most common (61%) underlying pathology of dementia in the oldest-old (20).
Functional assessments reveal that performance in normal aging declines over time, however, the performance of some elderly individuals is distinctly above the normative range. Preserved cognitive function in the elderly with a wide range of Braak scores and with an amyloid load similar to that detected in prodromal AD (21) suggests there may be an as yet to be discovered mechanism contributing to brain resilience, which conserves the neuronal reserve and cognitive function in the oldest-old population (22–24).
The broad spectrum of neurodegenerative changes (25–27) and of clinically missed changes that are neuropathologically difficult to identify (28, 29) contribute to multiregional neuronal losses. One may expect that in the majority of the elderly, erosion of brain/cognitive reserve is a cumulative product of brain aging and diverse insults resulting in a global pattern of neuronal loss with regional subpatterns and significant interindividual differences.
The overall goal of this study of the brains of 28 nondemented individuals 25–102 years of age with unbiased stereological methods was to establish a pattern of neurodegeneration and neuronal loss within cognitively normal adults and the elderly. The specific aims of the study of 10 brain regions and their 5 subdivisions were to: (1) establish a global pattern of neurofibrillary degeneration, β-amyloidosis, and neuronal loss in nondemented adults (25–63 years of age), elderly (69–102 years of age) and combined adult and elderly subjects; (2) estimate neuronal populations’ susceptibility to age-associated neuronal loss; (3) determine the rate of age-associated neuronal loss in structures with and without neurofibrillary degeneration; (4) determine whether neurofibrillary degeneration and/or β-amyloidosis have a significant association with age-related neuronal loss; and (5) estimate brain structure-specific reduction of the number of neurons in nondemented adults and the elderly.
MATERIALS AND METHODS
Materials
The brains of 28 subjects without records of cognitive decline or dementia, including 15 males and 13 females; 25–102 years of age, were examined (Table 1). The cause of death was determined as respiratory system disorder, heart disorder, cancer, sepsis, intraabdominal hemorrhage, and traumatic injuries. In 3 cases, cause of death was not established. The postmortem interval corresponding to the period between death and autopsy, ranged from 3 to 48 hours (15 hours on average, SE ± 2.5). Brains were removed using standard techniques, weighed, and were sagittally cut through the corpus callosum and brainstem. In 21 subjects, the left hemisphere, and in 7 subjects, the right hemisphere was examined. The mean brain weight at autopsy was 1230 g (SE ± 29), and brain weight decreased significantly with age (r = −0.67; p < 0.0001).
TABLE 1.
Clinical and Postmortem Characteristics of Examined Subjects Including Braak & Braak Stage of Neurofibrillary Degeneration and β-Amyloidosis
| # | Case # | Sex | Age (y) | Cause of Death | PMI (h) | Hem | Brain Weight (g) | NFTs | Aβ |
|---|---|---|---|---|---|---|---|---|---|
| 1 | 17-07 | F | 25 | Not established | 26 | L | 1402 | 0 | 0 |
| 2 | 4-12 | F | 31 | Traumatic injuries | 17 | L | 1354 | 0 | 0 |
| 3 | 291-00 | M | 32 | Heart failure | 14 | R | 1540 | I | 0 |
| 4 | 212-98 | F | 33 | Bronchopneumonia | 6 | L | 1180 | 0 | 0 |
| 5 | 38-98 | F | 43 | Sepsis | 10 | L | 1260 | 0 | 0 |
| 6 | 200-96 | M | 43 | Pulmonary embolism | 8.5 | L | 1380 | I | 0 |
| 7 | 457-96 | M | 47 | Myocardial infarct | 24 | L | 1500 | I | 0 |
| 8 | 63-96 | F | 47 | Pneumonia | 9 | L | 1220 | I | 0 |
| 9 | 64-96 | F | 52 | Pneumonia | 4 | R | 1140 | I | 0 |
| 10 | 44-96 | F | 53 | Pulmonary embolism | 20 | R | 1180 | I | 0 |
| 11 | 25-98 | M | 56 | Heart failure | 14 | L | 1430 | II | B |
| 12 | 458-96 | M | 58 | Lung carcinoma | — | R | 1290 | II | A |
| 13 | 42-96 | M | 61 | Pneumonia | — | R | 1400 | I | 0 |
| 14 | 380-01 | M | 61 | Pulmonary embolism | 4 | L | 1380 | II | C |
| 15 | 9-07 | F | 63 | Not established | — | R | 994 | I | A |
| 16 | 459-96 | F | 69 | Pulmonary edema | 48 | L | 1320 | II | A |
| 17 | 129-98 | M | 72 | Myocardial infarct | 3 | L | 1200 | IV | C |
| 18 | 456-96 | M | 73 | Heart failure | 48 | L | 1200 | III | A |
| 19 | 199-96 | M | 77 | Intra-abdominal hemorrhage | 19 | L | 1270 | II | A |
| 20 | 402-00 | F | 78 | Lymphoma | 4 | L | 980 | III | A |
| 21 | 115-00 | M | 80 | Lymphoma | 7 | L | 1120 | III | C |
| 22 | 113-00 | M | 82 | Bronchopneumonia | 7 | L | 1140 | IV | C |
| 23 | 361-99 | M | 83 | Heart failure | 7 | L | 1200 | II | A |
| 24 | 114-00 | F | 85 | Coronary artery disease | 6 | L | 1060 | II | A |
| 25 | 191-02 | M | 85 | Heart failure | 27 | R | 1080 | III | 0 |
| 26 | 362-99 | F | 87 | Brest cancer | 23 | L | 1120 | II | B |
| 27 | 293-00 | M | 90 | Pneumonia | 6 | L | 1120 | III | A |
| 28 | 449-02 | F | 102 | Not established | 10 | L | 984 | III | A |
| Average and standard error (±) | 15 ± 2.5 | 1230 ± 29 | |||||||
| Correlation between age and brain weight | −0.67 (p = 0.0001) | ||||||||
NFT, neurofibrillary tangle; PMI, postmortem interval in hours (h). Hem, hemisphere; L, left or R, right.
This study was performed using anonymized, coded brain tissue samples. The brains were obtained from the Brain Bank for Developmental Disabilities and Aging at the NYS Institute for Basic Research in Developmental Disabilities (IBR), Alzheimer’s Disease Research Center at New York University, and the University of Miami Brain Endowment Bank. In each case, diagnostic tissue blocks from 1 brain hemisphere were used for neuropathological evaluation and the second intact hemisphere was preserved for morphometric studies. The protocol of this study was approved by the institutional review board at IBR.
Neuropathological and Clinical Exclusion Criteria
The diagnostic criteria developed at a consensus conference organized by the National Institute on Aging and the Reagan Institute (30) was applied. Cases with a clinical diagnosis of dementia, including AD and Parkinson disease, were excluded, as were cases with brain tumors, metastases, hemorrhages, multiple small infarcts, and gross traumatic insult. The absence of Parkinson disease pathology was evaluated by immunostaining for the presence of Lewy bodies and Lewy neurites (monoclonal antibody [mAb] VP-A-106 detecting α-synuclein; Vector Laboratories, Burlingame, CA).
Tissue Processing, Embedding, Sectioning, Staining, and Immunostaining
After at least 6 weeks of fixation in 10% buffered formalin, 1 brain hemisphere from each of the examined subjects was cut coronally into 1-cm-thick slabs by using a brain macrotome that provides a consistent plane of hemisphere dissection and uniform slab thickness. The tissue blocks were dehydrated in ethyl alcohol (5 days in 70%, 6 days in 80%, and 6 days in 96%), infiltrated with polyethylene glycol 400 (PEG, Sigma, Saint Louis, MO) for 6 days, and with PEG 1000 for another 6 days, embedded in fresh PEG 1000, cut serially into 50-μm-thick numbered sections, and stored in 70% ethyl alcohol (8).
Free-floating serial sections were stained with cresyl violet to determine the borders of the examined structures and their subdivisions (nuclei, layers, or sectors), to measure the area of region of interest, and to calculate the volume of the examined structures. The number of neurons was evaluated in cresyl violet-stained sections.
Both staging and morphometric estimates of neurofibrillary degeneration were based on immunostaining with the mAb Tau-1 following the staging criteria of Braak et al (31). Neurons with neurofibrillary changes were detected with mAb Tau-1 (1:100 000). This antibody recognizes an epitope between amino acids 189 and 207 of the human tau sequence (32). To obtain optimum staining with Tau-1, sections were treated with alkaline phosphatase (Sigma, Type VII-L, 400 μg/ml in PBS, pH 7.4, 0.01% H2O2) (33). This process enables identification of neurons in all stages of progression of neurofibrillary changes including pretangles (neurons with scattered Tau-1-positive granules in the cell body), early tangles (neurons with rod-shaped immunopositive inclusions in the neuronal cell body), mature tangles (neurons with cytoplasm filled with Tau-1-positive bundles of fibers and a shrunken and usually dislocated cell nucleus), and the end stage tangles (neurons with the cell soma entirely filled with Tau-1-positive bundles of fibrils, which mask the cell nucleus) (34). Ghost tangles, which are loosely arranged bundles of fibers released after neuronal death, were not included in this morphometric study.
Amyloid deposits were immunolabeled with mAb 4G8. This antibody recognizes an epitope between amino acids 17 and 24 of the Aβ-peptide (35) (provided by Dr. Richard Kascsak from IBR). To enhance staining, sections were pretreated with 88% formic acid for 30 minutes (36). The endogenous peroxidases were blocked with 0.2% hydrogen peroxide in methanol. To block unspecific binding, sections were treated with 10% fetal bovine serum in phosphate buffer solution for 30 minutes. The primary antibody was diluted 1:3000 with 10% fetal bovine serum in PBS, and sections were incubated with mAb 4G8 overnight at 4 °C. The sections were washed and treated for 30 minutes with biotinylated sheep antimouse IgG antibody diluted 1:200. Then the sections were treated with an extravidin conjugate (1:200) for 1 hour, and the reaction product was visualized with diaminobenzidine (0.5 mg/mL with 1.5% hydrogen peroxide in PBS). After immunostaining, some sections were counterstained with cresyl violet, whereas noncounterstained sections were used to show the undisturbed pattern of β-amyloidosis and neurofibrillary degeneration.
Delineation of Regions of Interest for Stereological Studies
The study included: (1) the entorhinal cortex ([EC]; layers II, III, V, and VI); (2) the pyramidal layer in 4 sectors of the Ammon’s horn (cornu Ammonis, CA1-4); (3) and in the subiculum proper; (4) 4 nuclei (basal, accessory basal, lateral, and central) in the amygdala; (5) all subdivisions of the thalamus; (6) the caudate nucleus; (7) the substantia nigra; (8) 4 subdivisions (Ch1–Ch4) in the MBC; (9) the cerebellum (molecular, granule layer, and the white matter and the number of Purkinje cells); and (10) the dentate nucleus. The anatomical boundaries of 10 examined brain structures and their cytoarchitectural subdivisions were described in detail in our previous reports (37, 38). Briefly, in the amygdala, the boundaries of the lateral, basal, accessory basal, and central nuclei were delineated by using the cytoarchitectural criteria applied by Schumann and Amaral (39). Division of the Ammon’s horn, subicular complex, and EC into layers and sectors was based on the anatomical and cytoarchitectural criteria of Lorente de No (40), Duvernoy et al (41), Amaral and Insausti (42), Insausti et al (43), and Rosene and Van Hosen (44) with distinction of the CA4, which is the hilar part of the CA3. The borders of 4 cellular layers (II, III, V, and VI) in the EC were established by using of Amaral and Insausti (42) criteria. Neurons were counted within 4 layers of the EC (Brodmann area 28), including large modified pyramidal and stellate neurons in layer II separated from layer III by an acellular gap. A broad layer III built up of medium-sized pyramidal neurons is separated from layer V by the lamina dissecans (labeled as layer IV). Layer V was distinguished by the large size of pyramidal neurons in contrast to the small pyramidal neurons in layer VI (42). In the MBC, 4 subdivisions were distinguished according to the anatomical criteria of Vogels et al (45), including the CH1 (medial septal nucleus), CH2 (vertical limb nucleus of the diagonal band of Broca), CH3 (horizontal limb nucleus of the diagonal band of Broca), and CH4 (nucleus basalis of Meynert). In the substantia nigra, the pars reticulata and pars compacta were examined, including all subdivisions of the dorsal and ventral tiers and a lateral part identified by Fearnley and Lees (46, 47). In the caudate nucleus, the number of small neurons was estimated. Because Purkinje cells are located within a border between the molecular and granule layers of the cerebellar cortex, the numerical density and number of Purkinje cells were determined per molecular and granule layers combined.
Stereological Analysis
The volume and numerical density of neurons, and the total number of neurons with and without neurofibrillary tangles (NFTs), as well as the β amyloid load, were estimated with unbiased stereological methods (48) by using a workstation consisting of an Axiophot II light microscope (Carl Zeiss, Gottingen, Germany) with Plan-NEOFLUAR objectives: 1.25× (numerical aperture, N.A., 0.035), 2.5× (N.A. 0.075), 20× (N.A. 0.5), and 40× (N.A. 0.75); a specimen stage with a 3-axis, computer-controlled stepping system (Ludl Electronics, Hawthorne, NY); a CCD color camera (CX9000, MicroBrightfield Bioscience, Inc., Williston, VT); and stereology software (Stereo Investigator, MicroBrightfield Bioscience). The stereological parameters and procedures applied to estimate the volume of brain subdivisions and the number of neurons and NFTs are listed in Table 2.
TABLE 2.
Stereological Parameters and Procedures Applied
| Structures and Their Subdivisions | Mean Number of Examined Sections (per case) | Obj. (Vol.) | Obj. (Numb.) | Grid Size (μm) | Test Area Frame × Height (μm) | Mean Number of Counting Spaces (per case) | Mean Number of Counted Neurons (per case) | CE* |
|---|---|---|---|---|---|---|---|---|
| Entorhinal c. (All layers) | 8 | 5× | 40× | 600 × 600 | 60 × 60×30 | 656 | 1223 | 0.04 |
| Entorhinal c. (Islands) | 8 | 5× | 40× | 400 × 400 | 60 × 60×30 | 147 | 212 | 0.09 |
| CA1 | 12 | 5× | 40× | 800 × 800 | 60 × 60×30 | 226 | 601 | 0.05 |
| CA2 | 400 × 400 | 60 × 60×30 | 111 | 378 | 0.07 | |||
| CA3 | 400 × 400 | 60 × 60×30 | 131 | 328 | 0.07 | |||
| CA4 | 600 × 600 | 100 × 100×30 | 138 | 467 | 0.07 | |||
| Subiculum | 12 | 5× | 40× | 600 × 600 | 60 × 60×30 | 219 | 467 | 0.05 |
| Amygdala (4 nuclei) | 8 | 1.25× | 40× | 1600 × 1600 | 80 × 80×30 | 215 | 781 | 0.04 |
| Thalamus | 9 | 1.25× | 40× | 1600 × 1600 | 80 × 80×30 | 459 | 721 | 0.04 |
| Magnocellular basal comple × (Ch1-Ch4) | 13 | 2.5× | 40× | 500 × 500 | 80 × 80×30 | 445 | 586 | 0.04 |
| Caudate nucleus (small neurons) | 13 | 2.5× | 40× | 1400 ×1400 | 60 × 60×30 | 360 | 779 | 0.03 |
| Substantia nigra (pigmented neurons; pars comp. and ret.) | 9 | 2.5× | 40× | 500 × 500 | 80 × 80×30 | 336 | 498 | 0.05 |
| Cerebellum volume, Purkinje cell number | 16 | 2.5× | 20× | 1800 × 1800 | 180 × 180×30 | 651 | 1449 | 0.06 |
| Dentate nucleus | 18 | 2.5× | 40× | 1000 × 1000 | 180 × 180×30 | 561 | 1407 | 0.04 |
Number of sections examined = mean number of equidistant sections examined per structure/case. Obj. (Vol.) = Objective lens (1.25×, 2.5× or 5×) used to provide final magnification for planimetry and volumetry.
Obj. (Numb.) = Objective lens (40× or 20×) used for fractionator to estimate neuronal density and total number of neurons.
CE = the average predicted Schaeffer coefficient of error of the neuronal counts.
To determine the volume of examined structures and their subdivisions (layers, sectors, nuclei), the cross-sectional area of the structure was measured at various low magnifications providing the best anatomical delineation of the region of interest, including 1.25× (47× final magnification), 2.5× (95×), or 5× (190×). The number of neurons and NFTs was estimated by using a 40× lens (final magnification, 1450×), but the number of Purkinje cells was estimated by using a 20× lens (final magnification, 720×). The numerical density of Purkinje cells (n/mm3) was estimated in the molecular and granule cell layers in the cerebellar cortex. An optical fractionator systemic random sampling scheme supported by Stereo Investigator was applied. The number of equidistant serial sections used for neuronal counts matched the size and complexity of the examined regions and was large for sectors CA1-4 and the subiculum (n = 12), caudate nucleus and MBC (n = 13), Purkinje cells (n = 16), and dentate nucleus (n = 18), whereas for smaller and more compact structures, the number of sections examined was reduced to 9 in the substantia nigra and thalamus, and to 8 in the amygdala and EC. The distortion in the results of analysis related to sectioning defects was reduced by the application of 5-µm-wide top and bottom guard zones.
The size of the grid and of the virtual counting space was adjusted to the size and shape of the examined structures and the spatial distribution of neurons. The number of virtual counting spaces ranged from 111 in CA2 to 656 in the EC. The mean number of counted neurons per case was high for 3 structures—the EC (1223), dentate nucleus (1407), and Purkinje cells (1449)—whereas for other regions it ranged from 212 (islands of stellate cells in the entorhinal cortex) to 781 (amygdala). The applied procedures resulted in a sufficiently low average predicted Schaeffer coefficient of error of the neuronal count (0.03–0.09).
Statistical Analysis
The results of examination of 10 brain regions and their 5 subdivisions are presented as mean volume per case, mean number of neurons with and without NFTs per region, numerical density of neurons (n/mm3), and amyloid load (% of brain region volume occupied by mAb 4G8-positive β amyloid deposits). Spearman rank correlations of the Braak stages of neurofibrillary degeneration and β-amyloidosis with age were performed in 2 age groups: 15 subjects 25–63 years of age (adults) and 13 subjects 69–102 years of age (elderly) (Table 3). Spearman rank correlations were used to estimate the association between the Braak stage of neurofibrillary degeneration and the number of NFTs. Pearson correlations were used to estimate the association between age and the number of NFTs and amyloid load, the number of neurons and age, the mean volume of examined regions and age and the numerical density of neurons and age. In structures demonstrating a significant correlation between age and number of neurons, regression analysis (49, 50) was applied to establish mean neuronal loss per day. Estimates of the total number of lost neurons and the percentage of lost neurons were calculated as 2 measures of neuronal reserve in nondemented elderly, with the total number of neurons in young adults serving as the denominator.
TABLE 3.
Spearman Rank Correlations Between Age and Stage of Neurofibrillary Degeneration and β-Amyloidosis in Adults (25–63 Years of Age) and Elderly (69–102 Years of Age)
| Correlations Between | Age: 25–63y (n = 15) | Age: 69–102y (n = 13) |
|---|---|---|
| Age and stage of neurofibrillary degeneration | 0.83; p = 0.0001 | ns |
| Age and stage of β-amyloidosis | 0.67; p = 0.0066 | ns |
| Stage of neurofibrillary degeneration and β-amyloidosis | 0.73; p = 0.0030 | ns |
p values incorporate adjustment to set false discovery rate at 0.05.
We have computed p values for the analyses above using the False Discovery Rate (51) to adjust for multiple comparisons, taking the set of tests over all structures for each parameter tested (neuronal count, structure volume, etc.) as the basis for determining the number of multiple comparisons.
Multiple regression was used to determine the significance of the associations between the percentage of neurons with NFTs and neuronal loss and between amyloid load and neuronal loss controlled for the effect of age. In connection with this analysis a post hoc power analysis was applied to determine what level of effect of NFTs on neuronal counts could be detected. On average, age predicted roughly 20% of the variance in neuronal count. With an N of 25 cases we had power (1-beta) of 80% to detect an increment to the variance explained (R2) due to NFTs of about the same magnitude, 21%, using a 0.05 significance criterion (alpha). As the object in these analyses was to ascertain whether the effect of NFTs on neuronal loss disappeared once the effect of age was controlled, we wished to minimize the possibility of missing an effect (a Type II error) and accordingly did not adjust p values for multiple comparisons.
RESULTS
Topographic Pattern of Neurofibrillary Degeneration and β-Amyloidosis in Nondemented Adults and Elderly
The expansion of neurofibrillary degeneration detected with mAb Tau1 followed Braak and Braak staging but was restricted to stages I–IV. In stage I, neurofibrillary degeneration appears in the transentorhinal region with NFTs detected sporadically in the EC. In stage II, neurofibrillary degeneration extends from the transentorhinal region to the EC, particularly to the islands of the stellate neurons and then to deeper layers of the EC, as well as to sectors CA1 and CA2. In stage III, pathology spreads to sectors CA3 and CA4, the amygdala, and the parahippocampal gyrus. In 2 cases, the expansion of neurofibrillary degeneration to the subiculum, thalamus, inferior and middle temporal gyrus, and insula was consistent with stage IV, but the examined nondemented subjects did not develop pathology corresponding to stage V or VI.
Topographic expansion of neurodegeneration was associated with the progression of neurofibrillary degeneration and an increase in the number of neurons with NFTs and Tau-1-positive neuritic plaques. In stage III, neurofibrillary degeneration was more severe in the structures affected in stage I and II, whereas in stage IV, the severity of neurofibrillary degeneration increased in sites affected in stage III. A few neuritic plaques appeared in stage III, but they were a common finding in the EC, amygdala, and temporal inferior and middle gyrus in 2 cases in stage IV. Results of neuropathological staging based on Braak et al (31) criteria are summarized in Table 1. Two groups were distinguished on the basis of age: subjects 25–63 years of age (adults) and those 69–102 years of age (elderly). In the first group, 4 subjects were free of NFTs (stage 0), 8 developed neurofibrillary degeneration corresponding to stage I, and 3 to stage II. In this cohort, the oldest subject with stage I (63 years of age) marked the borderline between adults and the elderly. A characteristic feature of the elderly group of 13 nondemented subjects 69–102 years of age was the absence of stages 0 and I, but an increase in the prevalence of stage II (n = 5; 39%), stage III (n = 6; 46%), and stage IV (n = 2; 15%). In spite of their long lifespans, no elderly case developed neocortical neurofibrillary degeneration corresponding to stage V or VI. These latter findings indicate a 33-year-long period of absence of topographic expansion of neurofibrillary degeneration within this population.
The first amyloid plaques were found in a 56-year-old subject. Among amyloid-positive cases 56–102 years of age, stage A was most common (63%), whereas stages B and C were found in only 12% and 25% of cases, respectively.
Association Between Age and the Stage of Neurofibrillary Degeneration and β-Amyloidosis
The symbols 0, A, B, and C (8) were replaced by the ordinary numbers 0, 1, 2, and 3 to estimate the correlation between the stage of β-amyloidosis and age. To compare the pattern of changes in adults and the elderly, the Spearman rank correlation between age and the stage of neurodegeneration and β-amyloidosis was applied (Table 3). A significant correlation between the stage of neurofibrillary degeneration and age (ρ = 0.83; p = 0.0001) in adults reflects the transition from stage 0 to I and II. A significant correlation between the stage of β-amyloidosis and age in 25- to 63-year-old adults (ρ = 0.67; p = 0.0066) reflects a transition from stage 0 to A, B, or C. The absence of significant correlations between the stage of neurofibrillary degeneration and age, the stage of β-amyloidosis and age, and the stage of neurofibrillary degeneration and the stage of β-amyloidosis in 69- to 102-year-old subjects reflects a plateau in the staging of neurofibrillary degeneration and β-amyloidosis in examined elderly.
Regional Differences in the Number and Percentage of Neurons With NFTs
Braak and Braak staging (8) provides a global view of the topographic expansion of neurodegeneration and the regional progression of neurofibrillary degeneration and β-amyloidosis during aging and AD. To detect regional differences in the progression of neurofibrillary degeneration, the number and percentage of Tau-1-positive NFTs was determined in 10 brain regions and their subdivisions in 25- to 102-year-old subjects. The percentage of neurons with NFTs (Table 4) was highest in the 4 structures/subdivisions that were affected in younger cases, including the islands of stellate neurons in the entorhinal cortex (15.5%), EC (9.1%), CA1 (7.0%), and amygdala (6.3%), but the rate of involvement in neurofibrillary degeneration was much less in the structures affected later, including CA2 (3.2%), CA4 (3.6%), the subiculum (3.9%), the substantia nigra (3.5%), and the MBC (2.6%). The percentage of affected neurons was very low in CA3 (1.7%), the thalamus (0.3%), and the caudate nucleus (0.1%). After adjustment to set the false discovery rate at 0.05, the Pearson correlation between the number of NFTs and age was significant only in sector CA1 (r = 0.61; p = 0.042).
TABLE 4.
Onset and Prevalence of Neurofibrillary Degeneration and β-Amyloidosis in 14 Brain Regions and Their Subdivisions
| Structures and Their Subdivisions | Neurofibrillary Degeneration (mAb Tau-1) |
Amyloid Plaques (mAb 4G8) |
|||||
|---|---|---|---|---|---|---|---|
| Percentage of Subjects with NFTs | Number of Neurons with NFTs* | Percentage of Neurons with NFTs* | Pearson Correlation Between Number of NFTs and age* | Percentage of Subjects with Plaques | Amyloid Load (%)* | Pearson Correlation Between Amyloid load (%) and age* | |
| Entorhinal c. (All layers) | 80 | 874 152 | 9.1 | ns | 28 | 5.0 | ns |
| Entorhinal c. (Islands) | 76 | 105 449 | 15.5 | ns | 20 | 0.03 | ns |
| CA1 | 84 | 755 068 | 7.0 | 0.61; p = .0420 | 24 | 2.8 | ns |
| CA2 | 64 | 51 713 | 3.2 | ns | — | — | — |
| CA3 | 60 | 19 970 | 1.7 | ns | 12 | 0.3 | ns |
| CA4 | 68 | 48 994 | 3.6 | ns | 8 | 2.4 | ns |
| Subiculum | 68 | 155 418 | 3.9 | ns | 24 | 3.9 | ns |
| Amygdala | 71 | 662 323 | 6.3 | ns | 29 | 3.6 | ns |
| Thalamus | 20 | 62 711 | 0.3 | ns | 20 | 3.9 | ns |
| MBC | 64 | 25 184 | 2.6 | ns | 28 | 3.1 | ns |
| Caudate n. | 4 | 39 781 | 0.1 | ns | 22 | 6.4 | ns |
| Substantia nigra | 7 | 19 373 | 3.5 | ns | 4 | 0.41 | — |
| Purkinje cells | 0 | 0 | 0 | — | NA | NA | NA |
| Dentate nucleus | 0 | 0 | 0 | — | 0 | 0 | NA |
NFTs or amyloid load calculated only for pathology-positive cases.
p values incorporate adjustment to set false discovery rate at 0.05.
Correlation Between Stages I–IV and Increasing Number of Neurons With NFTs
Spearman rank correlations reveal that the number of neurons with NFTs correlates significantly with the stage of neurofibrillary degeneration in the structures affected early and severely, including the EC, islands of stellate neurons in the EC, CA1, CA2, CA4, subiculum, and amygdala (Table 5). The progression of neurofibrillary degeneration might be illustrated by changes in 3 large structures: the increase in the number of NFTs in the entire EC from 98 795 (stage I) to 1.9 million in stage IV, in the CA1 (from 67 550 to 1.3 million); or in the amygdala (from 55 000 to 1.5 million). Figure 1 illustrates the relationship between the percentage of neurons with NFTs and the Braak and Braak stage. These patterns are not detectable in structures where neurofibrillary degeneration occurs at later ages, structures with a low percentage of neurons with NFTs, including the MBC or thalamus, or in structures with a very low percentage of affected individuals, such as the substantia nigra.
TABLE 5.
Correlation Between Braak and Braak Stage of Neurofibrillary Degeneration and Number of Neurons With NFTs
| Structures and Their Subdivisions | Spearman rank Correlation Between Stage and Number of NFTs | Mean Number and Percentage of Neurons with NFTs |
|||||||
|---|---|---|---|---|---|---|---|---|---|
| Stage I |
Stage II |
Stage III |
Stage IV |
||||||
| Number | % | Number | % | Number | % | Number | % | ||
| Entorhinal cortex (All layers) | 0.64; p = 0.0054 | 98 795 | 0.8 | 1 010 427 | 9.3 | 979 209 | 11.2 | 1 906 012 | 18.1 |
| Entorhinal cortex (Islands) | 0.60; p = 0.0124 | 13 745 | 1.4 | 116 572 | 15.2 | 124 368 | 21.4 | 176 453 | 28.1 |
| CA1 | 0.82; p = 0.0001 | 67 550 | 0.6 | 849 647 | 8.3 | 1 449 347 | 13.8 | 1 360 737 | 13.2 |
| CA2 | 0.62; p = 0.0148 | 1041 | 0.0 | 33 629 | 2.4 | 77 365 | 4.5 | 120 296 | 7.1 |
| CA4 | 0.56; p = 0.0219 | 6176 | 1.2 | 49 191 | 3.7 | 57 615 | 4.2 | 79 751 | 5.6 |
| Subiculum | 0.75; p = 0.0018 | 6088 | 0.1 | 122 675 | 3.0 | 283 857 | 7.4 | 238 290 | 5.4 |
| Amygdala | 0.49; p = 0.0482 | 55 558 | 0.2 | 561 393 | 4.7 | 825 333 | 8.9 | 1 518 203 | 14.5 |
p values incorporate adjustment to set false discovery rate at 0.05.
FIGURE 1.

Graphs illustrate the increase of the percentage of neurons with NFTs in nondemented adults and elderly in Braak and Braak stages I–IV. The percentage of neurons with NFTs correlates (p < 0.05) with stages in the entorhinal cortex; islands of the stellate neurons in the entorhinal cortex, sectors CA1, 2; the subiculum; the amygdala; and CA4 (not shown).
Amyloid Load
In comparison to neurofibrillary degeneration, the age of onset of amyloid plaques in the aging population was delayed to the fifth and sixth decades, and the percentage of amyloid-positive subjects was low, with 28% developing amyloid plaques in the EC, 24% in CA1 and the subiculum, 29% in the amygdala, 28% in the MBC, 22% in the caudate nucleus, and 20% in the thalamus (Table 4). The amyloid load (the percentage of structure volume occupied by mAb4G8-positive β amyloid) was the highest in the EC (5%) and in the caudate nucleus (6.4%), but amyloid load in 8 other regions was in range from 0.03% to 3.9% (second layer of the EC, CA1, CA3, CA4, subiculum, amygdala, thalamus, magnocellular basal complex, caudate nucleus, and substantia nigra).
Estimates of Neuronal Loss in 15 Brain Structures and Their Subdivisions in Nondemented Subjects From 25 to 102 Years of Age
To determine neuronal loss in different age groups, the number of neurons was estimated in the 38-year-long period between 25 and 63 years of age, the 33-year-long period between 69 and 102 years of age, and the 77-year-long period between 25 and 102 years of age. To estimate the contribution of neurofibrillary degeneration to age-associated neuronal loss and reduction of neuronal reserve in nondemented subjects, 15 brain regions and their subdivisions were examined, including structures with early and late onset of neurofibrillary degeneration and structures free of neurofibrillary degeneration (Table 6; Fig. 2). Pearson correlation was applied to detect structures with significant neuronal loss and to estimate the rate of neuronal loss per day.
TABLE 6.
Estimated Total Number of Neurons and the Rate of Age-Associated Neuronal Loss in Examined Structures and Their Subdivisions in 1 Brain Hemisphere
| Structures and Their Subdivisions | Age: 25–102 y |
Age: 25–63 y |
Age: 69–102 y |
||||||
|---|---|---|---|---|---|---|---|---|---|
| Number of Neurons (± SE) | Pearson Correlation with Age | *Neuronal Loss | Number of Neurons (± SE) | Pearson Correlation with Age | *Neuronal Loss | Number of Neurons (± SE) | Pearson Correlation with Age | *Neuronal Loss | |
| Entorhinal c. (All layers) | 10 725 576 | −0.72 | −154/d | 11 676 477 | ns | — | 9 695 433 | ns | — |
| ± 305 963 | p = 0.0002 | −14/106/d | ± 304 548 | 361 079 | |||||
| Entorhinal c. (Islands) | 827 145 | −0.80 | −21.8/d | 970 287 | ns | — | 672 074 | ns | — |
| ± 38 699 | p = 0.0002 | −26/106/d | ± 35 738 | ± 31 778 | |||||
| CA1 | 11 198 419 | −0.65 | −132/d | 11 955 648 | ns | — | 10 234 672 | ns | — |
| ± 285 346 | p = 0.0011 | −12/106/d | ± 335 529 | ± 303 305 | |||||
| CA2 | 1 433 640 | ns | — | 1 329 799 | ns | — | 1 565 802 | ns | — |
| ± 52 860 | ± 69 450 | ± 64 358 | |||||||
| CA3 | 1 211 225 | ns | — | 1 218 610 | ns | — | 1 201 826 | ns | — |
| ± 50 488 | ± 66 843 | ± 80 594 | |||||||
| CA4 | 1 444 831 | ns | — | 1 536 529 | ns | — | 1 328 125 | ns | — |
| ± 56 909 | ± 90 869 | ± 39 640 | |||||||
| CA1-4 | 15 288 115 | −0.61 | −137/d | 16 040 586 | ns | — | 14 330 425 | ns | — |
| ± 314 613 | p = 0.0024 | −9/106/d | ± 352 488 | ± 412 972 | |||||
| Subiculum | 4 077 064 | ns | — | 4 165 571 | ns | — | 3 964 418 | ns | |
| ± 103 929 | ± 125 618 | ± 174 762 | |||||||
| Amygdala (4 nuclei) | 12 009 682 | −0.67 | −258/d | 13 665 457 | ns | — | 10 226 541 | ns | |
| ± 526 713 | p = 0.0002 | −21/106/d | ± 626 372 | ± 526 071 | |||||
| Thalamus | 25 243 680 | −0.78 | −464/d | 27 888 720 | −0.87 | −650/d | 22 598 640 | ns | |
| ± 957 265 | p = 0.0002 | −18/106/d | ± 988 340 | p = 0.015 | −23/106/d | ±1 156 514 | |||
| Magnocellular basal complex | 912 440 | ns | — | 904 645 | ns | — | 922 362 | ns | |
| ± 34 601 | ± 47 885 | ±52 143 | |||||||
| Caudate nucleus | 37 551 200 | −0.53 | −566/d | 42 322 527 | ns | — | 32 346 117 | ns | |
| ±1 755 654 | p = 0.0155 | −15/106/d | ±1 880 800 | ±2 177 370 | |||||
| Substantia nigra | 722 080 | ns | — | 778 062 | ns | 657 485 | ns | ||
| ± 35 467 | ± 37 695 | ± 59 449 | |||||||
| Purkinje cells | 14 968 857 | −0.80 | −349/d | 17 291 977 | 13 068 122 | ns | — | ||
| ± 730 213 | p < 0.0002 | −23/106/d | ±1 015 345 | ± 603 632 | |||||
| Dentate nucleus | 1 263 661 | −0.71 | −23/d | 1 404 414 | 1 087 720 | ns | |||
| ± 45 941 | p < 0.0002 | −18/106/d | ± 52 141 | ± 42 823 | |||||
Estimated rate of neuronal loss per day (/d), and per 1 million neurons per day (/106/d).
p values incorporate adjustment to set false discovery rate at 0.05.
FIGURE 2.

Regression analysis reveals comparable correlation between age and the number of neurons in nondemented subjects in 4 structures/regions affected early by neurofibrillary degeneration (the entorhinal cortex, islands in the entorhinal cortex, CA1, and the amygdala); in 2 regions with neurofibrillary degeneration affecting only a very few neurons and in only a few subjects (the thalamus and caudate nucleus), and 2 neuronal populations free of neurofibrillary degeneration (Purkinje cells and neurons in the dentate nucleus).
Surprisingly, in a group of 13 successfully aging elderly 69–102 years of age, in none of 15 regions did neuronal loss reach a significant level when an adjustment to set the false discovery rate at 0.05 was applied. Similar analysis in 15 adults 25–63 years of age revealed a significant neuronal loss of 650 neurons per day in the thalamus only. However, estimates in 28 subjects 25–102 years of age revealed significant neuronal loss in 8 of 15 regions examined.
The mean total number of neurons in the EC decreased from 11.7 million in 25- to 63-year-old subjects to 9.7 million in 69- to 102-year-old subjects. In 25- to 102-year-old subjects, the decrease in the number of neurons correlated with age (r = −0.72; p = 0.0002). Regression-based estimates reveal a loss of 154 neurons per day.
The mean total number of stellate neurons in the second layer of the EC decreases from 970 thousand in adults to 672 thousand in the elderly group. The Pearson correlation between age and the number of neurons is significant in 25- to 102-year-old subjects (r = −0.80, p = 0.0002), reflecting a loss of 21.8 neurons per day. The decrease in the mean number of neurons in CA1 from 11.9 to 10.2 million corresponds to loss of 132 neurons per day. A similar pattern was observed in the amygdala, with a decrease in the number of neurons from 13.6 to 10.2 million and a loss of 258 neurons per day in subjects 25–102 years of age. Significant neuronal loss was detected in 2 structures with a low percentage of neurons with NFTs: the thalamus (0.3%) and small neurons in the caudate nucleus (0.1%). The total number of neurons in the thalamus decreased from 27.8 to 22.6 million or 464 neurons per day, whereas the number of small neurons in the caudate nucleus decreased from 42.3 million 32.3 million or 566 per day. The number of neurons also decreased significantly in 2 neuronal populations free of neurofibrillary degeneration. The mean number of Purkinje cells decreased from 17.3 to 13.1 million (349 per day). The number of neurons in the cerebellar dentate nucleus decreased from 1.4 to 1.1 million (23 per day).
After adjustment to maintain False Discovery Rate of 0.05 the decrease in the number of pigmented neurons in the substantia nigra from 778 062 in adults to 657 482 in the elderly was slightly short of significance (p = 0.0525) and was considered a trend towered age-associated neuronal loss.
To compare neuronal loss in structures with enormous differences in the total number of neurons, ranging from 0.7 in the substantia nigra to 24 million small neurons in the caudate nucleus in adult subjects, the neuronal loss was requantified as number of neurons lost per 1 million per day. The index of neuronal loss was comparable (Table 6; Fig. 3) in structures with significant neurofibrillary degeneration (14 neurons per million per day in the EC, 26 in the second layer of the EC, 12 in CA1, and 21 in the amygdala), as well as in structures with a few NFTs (18 neurons in the thalamus and 15 in the caudate nucleus), and in neuronal populations free of NFTs (23 Purkinje cells and 18 neurons in the dentate nucleus).
FIGURE 3.

In 8 brain regions, daily neuronal loss varies from 22 in the islands (Isl) of stellate neurons in the entorhinal cortex to 566 neurons in the caudate nucleus. However, the estimated neuronal loss per 1 million neurons per day is strikingly similar in all examined regions, including 4 structures affected early by neurofibrillary degeneration and characterized by a relatively high percentage of neurons with NFTs (the entorhinal cortex, EC; Islands, Isl; cornu Ammonis CA1; and the amygdala, Amy); in 2 regions with neurofibrillary degeneration affecting only a few neurons and in only a few subjects (the thalamus, Th, and small neurons in the caudate nucleus, CNs); and in 2 neuronal populations free of neurofibrillary degeneration (Purkinje cells, PC, and neurons in the dentate nucleus, DN).
Figure 4 illustrates the difference in the number of neurons at 25 and 102 years of age, and conversely, the number of neurons lost in 8 brain structures, varying from 0.61 million in the second layer of the EC to 15.9 million in the caudate nucleus. While these findings suggest a differential effect of several orders of magnitude, the estimated percentage of neurons lost actually reveals that losses occur in a relatively narrow range across different neuronal circuits, different neurotransmitter systems, and structures affected and unaffected by neurofibrillary degeneration and β-amyloidosis. Losses of neurons over this 77-year period ranging from 28.5% in CA1 to 54% in the second layer of the EC and 48.3% of Purkinje cells in subjects without records of cognitive deterioration may correspond to neuronal reserve in human brain. This study of 15 regions identifies also 7 regions without statistically significant neuronal loss, suggesting their relative resistance to mechanisms leading to age associated neuronal loss.
FIGURE 4.
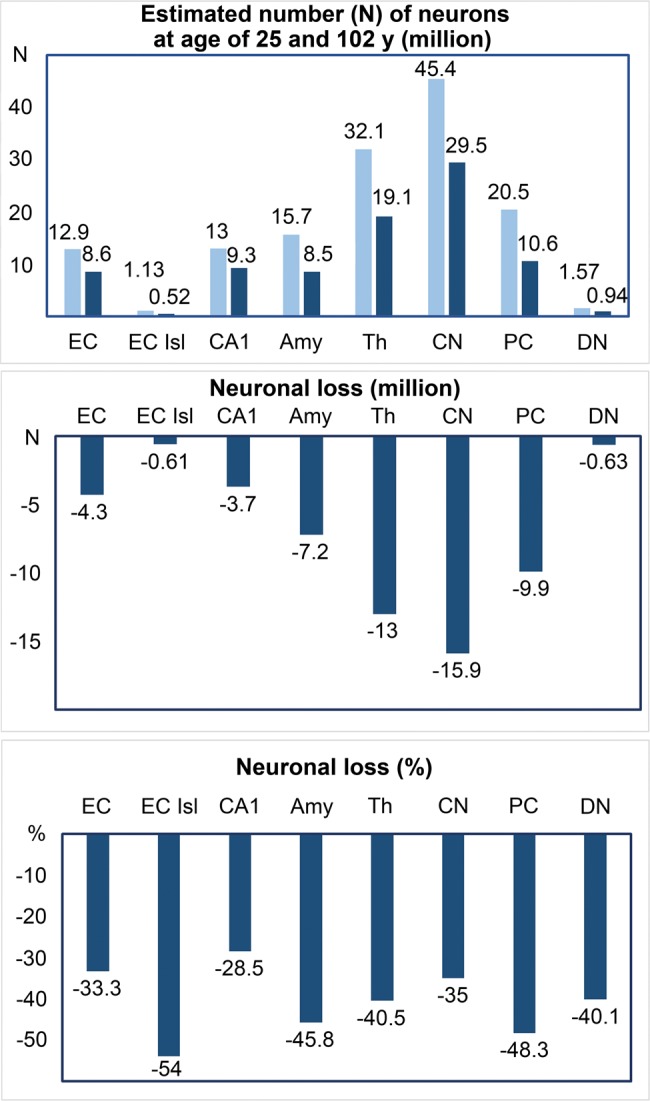
Regression-based estimates of the number of neurons at 25 years of age (light blue) and 102 years of age (dark blue) allow evaluation of neuronal loss in 8 brain regions (millions) and the percentage of lost neurons during 77 years of life of adults and elderly. The percentage of lost neurons is similar in the islands in the EC (54%) with the earliest onset of neurofibrillary degeneration and in Purkinje cells (48.3%) free of neurofibrillary degeneration.
Association Between Number of Neurons, Neurofibrillary Degeneration, and β-Amyloidosis
Multivariate regressions were performed to determine the contribution of neurofibrillary degeneration and amyloid deposits to neuronal loss in each examined region once the effect of age-related loss was accounted for. Table 7 summarizes regressions of neuronal counts on age, NFTs, and age and NFTs together for the structures with the highest percentage of neurons with NFTs. There was no significant association between the number of neurons and the percentage of neurons with neurofibrillary degeneration in these structures, including the entorhinal cortex, islands of the stellate neurons in the EC, CA1 and the amygdala; structures with a few NFTs (thalamus and caudate nucleus; not shown), or in neuronal populations free of neurofibrillary degeneration (Purkinje cells and neurons in the dentate nucleus; not shown). Similar analysis revealed also that the number of neurons was not significantly associated with β-amyloid load in the 15 regions examined or their subdivisions in adults and elderly once the effect of age was controlled (not shown).
TABLE 7.
Multivariate Regression of Neuronal Count on Age and Percentage of NFTs
| Structures | F | df | p | adj. R2 | β | t | p |
|---|---|---|---|---|---|---|---|
| Entorhinal c. (All layers) | |||||||
| Age (univariate) | 24.19 | 1,23 | 0.0001 | 0.4914 | −56160.43 | −4.92 | 0.0001 |
| Percent NFTs (univariate) | 5.18 | 1,23 | 0.0325 | 0.1483 | −1.01 × 10⁷ | −2.28 | 0.0325 |
| Overall age + NFTs model | 11.90 | 2,22 | 0.0003 | 0.4760 | |||
| Age | −62359.24 | −3.92 | 0.001 | ||||
| Percent NFTs | 2719916 | 0.57 | ns | ||||
| Entorhinal c. Islands | |||||||
| Age (univariate) | 41.64 | 1,23 | 0.0001 | 0.6287 | −7963.411 | −6.45 | 0.0001 |
| Percent NFTs (univariate) | 26.79 | 1,23 | 0.0001 | 0.5180 | −1126262 | −5.18 | 0.0001 |
| Overall age + NFTs model | 25.39 | 2,22 | 0.0001 | 0.6702 | |||
| Age | −5640.406 | −3.41 | 0.003 | ||||
| Percent NFTs | 505291.5 | −1,97 | ns | ||||
| CA1 | |||||||
| Age (univariate) | 16.59 | 1,23 | 0.0005 | 0.3937 | −48319.07 | −4.07 | 0.0005 |
| Percent NFTs (univariate) | 9.11 | 1,23 | 0.0061 | 0.2525 | −1.00 × 10⁷ | −3.02 | 0.006 |
| Overall age + NFTs model | 8.53 | 2,22 | 0.0018 | 0.3856 | |||
| Age | −39339.59 | −2.45 | 0.023 | ||||
| Percent NFTs | −3614970 | −0.83 | ns | ||||
| Amygdala | |||||||
| Age (univariate) | 15.34 | 1,22 | 0.0007 | 0.3841 | −83251.04 | −3.92 | 0.0007 |
| Percent NFTs (univariate) | 3.82 | 1,22 | ns | 0.1093 | −1.31 × 10⁷ | −1.96 | ns |
| Overall age + NFTs model | 7.69 | 2,21 | 0.0031 | 0.3677 | |||
| Age | −76167 | −3.16 | 0.005 | ||||
| Percent NFTs | −4141917 | −0.65 | ns | ||||
The dependent variable for all regressions is the number of neurons in the structure.
Brain Region-Specific Volume Loss
The evaluation of the entire cohort 25–102 years of age revealed a significant decrease in the volume of the EC (r = −0.53; p = 0.022), the second layer in the entorhinal cortex (r = −0.57; p = 0.015, the thalamus (r = −0.78, p = 0.0015), and the dentate nucleus (r = −0.54; p = 0.015) (Table 8). The observed pattern suggests a similar reduction in the volume of some brain structures with and without neurofibrillary degeneration.
TABLE 8.
Estimated Mean Volume (mm3 ± SE) of Examined Structures and Cytoarchitectonic Subdivisions in 1 Brain Hemisphere and Correlation Between Volume and Age
| Structures and Their Subdivisions | Age: 25–102 |
Age 25–63 |
Age 69–102 |
|||
|---|---|---|---|---|---|---|
| Volume | Pearson Correlation with Age | Volume | Pearson Correlation with Age | Volume | Pearson Correlation with Age | |
| Entorhinal c. (All layers) | 593 ± 23 | −0.53; p = 0.022 | 650 ± 32 | ns | 531 ± 24 | ns |
| Entorhinal c. (Islands) | 35 ± 2 | −0.57; p = 0.015 | 40 ± 2 | ns | 29 ± 1 | ns |
| CA1 | 423 ± 14 | ns | 450 ± 16 | ns | 389 ± 21 | ns |
| CA2 | 36 ± 1 | ns | 34 ± 2 | ns | 39 ± 2 | ns |
| CA3 | 45 ± 2 | ns | 45 ± 2 | ns | 45 ± 3 | ns |
| CA4 | 105 ± 5 | ns | 110 ± 7 | ns | 100 ± 6 | ns |
| CA (1–4) | 610 ± 18 | ns | 639 ± 21 | ns | 572 ± 28 | ns |
| Subiculum* | 188 ± 8 | ns | 194 ± 10 | ns | 180 ± 12 | ns |
| Amygdala† | 446 ±15 | ns | 470 ±15 | ns | 420 ± 20 | ns |
| Thalamus | 3023 ± 122 | −0.78; p = 0.0015 | 3406 ± 114 | ns | 2640 ± 130 | ns |
| Magnocellular basal complex‡ | 128 ± 4 | ns | 134 ± 5 | ns | 120 ± 5 | ns |
| Caudate nucleus | 1975 ± 59 | ns | 2018 ± 93 | ns | 1929 ± 71 | ns |
| Substantia nigra§ | 90 ± 5 | ns | 97 ± 6 | ns | 82 ± 6 | ns |
| Cerebellum | 24 514 | ns | 25 451 ± 1618 | ns | 23 747 ± 1438 | ns |
| Dentate nucleus | 323 ±14 | −0.54; p = 0.015 | 364 ± 14 | ns | 271 ± 15 | ns |
Volume (mm3), total volume calculated using mounted section thickness.
Subiculum, total volume of the subiculum proper.
Amygdala, total volume of lateral, basal, accessory and central nuclei.
Magnocellular basal complex: total volume of Ch1-4.
Substantria nigra, total volume of the pars compacta and reticulata.
p values incorporate adjustment to set false discovery rate at 0.05.
Numerical Density of Neurons
The numerical density of neurons (N/mm3) reflects changes in the number of neurons and the volume in the region of interest. The significant decrease in brain structure volume in parallel with the loss of neurons in the EC, CA1, thalamus, substantia nigra, and dentate nucleus seemed to account for a lack of significant change in neuronal density with aging (Table 9). However, where there were disproportional changes in volume and neuronal loss, detectable reductions in neuronal density were observed. This was the case for the caudate nucleus (r = −0.62, p = 0.0012), and in the numerical density of Purkinje cells (r = −0.68, p = 0.012), but only in the entire cohort 25–102 years of age.
TABLE 9.
Estimated Numerical Density of Neurons (N/mm3)
| Structures and Their Subdivisions | Age: 25–102 y |
Age: 25–63 y |
Age: 69–102 y |
|||
|---|---|---|---|---|---|---|
| Neuronal Density | Pearson Correlation with Age | Neuronal Density | Pearson Correlation with Age | Neuronal Density | Pearson Correlation with Age | |
| Entorhinal c. (All layers) | 18 370 ± 469 | ns | 18 326 ± 719 | ns | 18 416 ± 624 | ns |
| Entorhinal c. (Islands) | 24 100 ± 769 | ns | 25 070 ± 1200 | ns | 23 050 ± 892 | ns |
| CA1 | 26 876 ± 761 | ns | 26 793 ± 839 | ns | 26 980 ± 1411 | ns |
| CA2 | 39 882 ± 1198 | ns | 39 416 ± 1408 | ns | 40 475 ± 2119 | ns |
| CA3 | 27 201 ± 906 | ns | 27 410 ± 1275 | ns | 26 934 ± 1331 | ns |
| CA4 | 14 113 ± 561 | ns | 14 332 ± 699 | ns | 13 833 ± 945 | ns |
| All sectors (CA1-4) | 25 437 ± 727 | ns | 25 341 ± 812 | ns | 25 560 ± 1338 | ns |
| Subiculum | 22 187 ± 671 | ns | 22 003 ± 1008 | ns | 22 421 ± 873 | ns |
| Amygdala (4 nuclei) | 27 194 ± 1190 | ns | 27 334 ± 1430 | ns | 24 888 ± 1228 | ns |
| Thalamus | 8410 ± 215 | ns | 8 228 ± 270 | ns | 8592 ± 340 | ns |
| Magnocellular basal complex | 7179 ± 226 | ns | 6771 ± 290 | ns | 7697 ± 303 | ns |
| Caudate nucleus | 19 045 ± 732 | −0.62; p = 0.012 | 21 114 ± 689 | ns | 16 788 ± 957 | ns |
| Substantia nigra (pigmented neurons) | 8067 ± 234 | ns | 8146 ± 353 | ns | 7977 ± 310 | ns |
| Purkinje cell (density per molecular and granule cell layers) | 618 ± 27 | −0.68; p = 0.012 | 691 ± 44 | ns | 558 ± 23 | ns |
| Dentate nucleus | 3984 ± 114 | ns | 3909 ± 168 | ns | 4076 ± 149 | ns |
p values incorporate adjustment to set false discovery rate at 0.05.
DISCUSSION
Our results support and expand earlier studies suggesting brain resilience that allows some elderly individuals to withstand the impacts of significant neurofibrillary degeneration and β-amyloidosis and delay or avoid substantial cognitive decline and dementia (7, 22, 52–60). This stereological study of 15 brain regions and their cytoarchitectonic subdivisions in 28 nondemented individuals 25–102 years of age suggests that the pattern of structural changes in the brains of adults and the elderly can be characterized as (1) age-associated brain remodeling with reduction of the number of neurons in 8 of 15 brain regions, ranging from 28.5% in CA1 to the 54% loss of stellate neurons in the second layer of the EC and 48.3% loss of Purkinje cells; (2) a 77-year period of non-symptomatic reduction of neuronal reserve with a similar rate of neuronal loss in adults and the elderly, without signs of accelerated neuronal loss in agers or super-agers; (3) an absence of topographic expansion of neurofibrillary degeneration to the neocortex; (4) a similar rate of age-associated neuronal loss in structures with and without neurofibrillary degeneration; and (5) the absence of a significant association between age-related neuronal loss and the severity of neurofibrillary degeneration and β-amyloidosis.
Three Decades of Absence of Topographic Expansion of Neurofibrillary Degeneration in Aging
Several arguments support the key role of the arrest of expansion of neurofibrillary degeneration to the neocortex in successful aging. The ranking by Ohm et al (61) of progression of neurofibrillary degeneration in 887 brains obtained from routine autopsy revealed an increase in the relative proportion of the lower stages of neurodegeneration beyond the age of 90 years and a small number of individuals devoid of neurofibrillary degeneration, suggesting that among aged adults, there is a subpopulation of individuals resistant to AD. A similar prevalence of stages 0–IV in cognitively normal subjects in our study (57% stage I and II, 21% stage III, and 7% stage IV) and in a study of 39 cognitively normal subjects 74–95 years of age examined by Knopman et al (57) (56% with stage I or II, 28% with stage III, and 13% with stage IV) indicates that the absence of topographic expansion of neurofibrillary degeneration is typical for nondemented elderly individuals.
Neurofibrillary pathology in the neocortex is a key event associated with cognitive decline (29, 62, 63). The absence of expansion of neurofibrillary degeneration to the neocortex in individuals with successful aging is supported by clinical (64) and neuropathological (29) studies. Structural MRI of the brains of “SuperAgers”, that is, individuals who were 80 years of age or older and had episodic memory scores at the level of individuals 20–30 years younger, revealed a significantly thicker cerebral cortex than in 50- to 65-year-old healthy adults, which may be a proxy measure of preserved cortical neuronal integrity. Our and others’ results (29, 57, 61, 64) suggest that the absence of the progression to the neocortex of neurofibrillary degeneration and NFT-related neuronal loss is a key factor related to preservation of cognition. The correlation between age and stages I and II in adults up to 63 years of age but the lack of correlation between age and stages II–IV in 69- to 102-year-old individuals appears to be another sign of the disruption of the progression of neurofibrillary degeneration in people who do not develop Alzheimer-type neurodegeneration and cognitive impairment in the next 3 decades of life.
Perhaps most importantly, this study contributes to growing evidence that AD is not a consequence of advanced brain aging but, instead, a distinct pathological process (58, 65). Identification of the mechanisms that prevent the topographic expansion of neurofibrillary degeneration in successfully aging individuals might be helpful for research aimed at the prevention of AD.
Comparable Rate of Age-Associated Neuronal Loss in Adults and Elderly
The most striking feature of neuronal loss in the 28 subjects examined (25- to 102-years-old) was the lack of a significant correlation between age and number of neurons in the 15 subjects 25–63 years of age as well as in the 13 subjects 69–102 years of age, though the correlation between age and number of neurons was significant in the 28 subjects taken as a whole. This pattern could explain why many reports of aged subjects failed to detect age associated neuronal loss. The association between age and neuronal loss in 25- to 102-year-old subjects also reveals that neuronal loss in adults is comparable with neuronal loss in the elderly, including super agers, which is conflict with expectations that neuronal loss is accelerated in the elderly. These data support the view that aging is not a pathological process but rather an age-associated process of brain remodeling in adults and the elderly. The absence of significant neuronal loss in 7 of 15 brain structures or their subdivisions distinguishes brain structures and neuronal populations resilient to aging-associated remodeling from 8 regions with age-associated neuronal loss. Neuronal loss appears to be strikingly different in different brain structures when loss is calculated per structure, but estimates of neuronal loss per million neurons per day indicate that the rate of neuronal loss is rather similar across structures, ranging from 12/million/day in the CA1 with early onset of neurofibrillary degeneration to 23/million/day among Purkinje cells free of neurofibrillary degeneration.
Lack of Significant Association Between Neurofibrillary Degeneration and β-Amyloidosis and Neuronal Loss in Aging
In 25- to 102-year-old subjects, estimates of neuronal loss revealed very similar loss in structures with neurofibrillary degeneration (EC, 33.3%; second layer of the EC, 54%; CA1, 28.5%; and amygdala, 45.8%), in structures with mild neurofibrillary degeneration (thalamus, 40.5%; caudate nucleus, 35%), and in neuronal populations free of NFTs (Purkinje cells, 48.3%, and neurons in the dentate nucleus, 40.1%). These data indicate that regional neurofibrillary degeneration-associated neuronal loss is not a predictor of age-associated neuronal loss.
The limited contribution of neurofibrillary degeneration to neuronal loss in aging has been shown in other studies. The study by Von Gunten et al (66) of a cohort of 34 subjects 74–102 years of age with a high prevalence of demented subjects and only rare cases of questionable or very mild dementia revealed that NFT numbers predict only 38% of the neuron number variability in layer II of the EC and 55% in CA1. Also, in AD, neuronal loss correlates with, but exceeds, the number of NFTs (67). Testing the hypothesis that NFT formation accounts for all of the CA1 pyramidal neuronal loss observed in AD revealed that NFTs accounted for only a small proportion (8.1%) of the ∼60% of the neuronal loss observed in AD (68). A study by Hof et al (69) of the second layer of EC and CA1 revealed that large numbers of neurons with intracellular NFTs may persist until late stages of AD progression. Morsch et al (70) models estimated that CA1 neurons containing NFTs may survive for ∼20 years. The present study extends these findings to a population experiencing successful aging and strengthens the suggestion that in adults and the elderly mechanisms distinct from neurofibrillary degeneration and β-amyloidosis influence neuronal loss and brain function.
Several previous studies have demonstrated that NFT densities are closely associated with cognitive status, whereas amyloid deposits are more closely related to brain aging (62, 71–73). Amyloid deposition is common in older individuals with intact cognitive function (74–75). However, studies of nonagenarians and centenarians have documented significantly slower progression of neurofibrillary degeneration and β-amyloidosis compared to younger cases (76). The lack of amyloid plaques in 8% of nondemented subjects 69–102 years of age, including an 85-year-old individual; stage A of brain amyloidosis in 61% of subjects including 90- and 102-year-olds; stage B in 8%, and stage C in 23%; the only 3.5% average amyloid load in 9 amyloid-positive regions; and the lack of correlation between the stage of amyloidosis and age suggest that in successful aging, inhibition of neurofibrillary degeneration coincides with prominent inhibition of β-amyloidosis. The lack of significant association between the number of neurons and the number of NFTs or amyloid load once the effect of age in the nondemented cohort was controlled indicates subthreshold neurofibrillary degeneration and β-amyloidosis without an effect on cognition.
The presence of neurofibrillary degeneration in all adults older than 43 years of age and evidence that this pathology causes neuron death clearly shows that NFTs contribute to neuronal loss throughout later adulthood. However, the spatial pattern of neuronal loss described here shows comparable neuronal loss in NFT-free brain structures and neuronal populations. Several nonAlzheimer neurodegenerative pathologies, including α-synucleinopathy (26, 27) and TDP-43 deposition (25, 77), are known to contribute to neuronal loss. Lewy body pathology has been found in 26.9% of 98- to 107-year-olds (77). TDP-43 pathology has also been found in the hippocampus and in other brain structures in 80% of nondemented elderly cases. In 21% of these elderly, the hippocampal sclerosis was reported to coexist with widespread arteriosclerosis outside of the hippocampus (77). Longitudinal MRI studies of age-associated pathology reveal shrinkage not only of the hippocampus and EC but also of the caudate nucleus, cerebellum, and several neocortical regions (78–80). A broader view of neuropathology in aging suggests the combined contribution to neuronal loss of regional neuropathology and the global effects of vascular pathology and hypertension (79, 80). These studies suggest that even after application of clinical and neuropathological exclusion criteria the examined adults and elderly might be affected by undetected low range common cerebral morbidities contributing to regional and interindividual differences in the reduction of neuronal reserve.
Brain Aging and Primary Age-Related Tauopathy
In examined adults and elderly with no records of cognitive decline, the topographic pattern of neurofibrillary degeneration and β amyloidosis matches primary age-related tauopathy (PART) diagnosed in very old subjects with mainly allocortical neurofibrillary pathology (Braak stages IV or below) and without or with few Aβ deposits (81). The relationships between age-related tauopathy and AD are a matter of discussion reflected in 2 recommendations: to consider PART as a distinct age-associated tauopathy that does not meet the morphological criteria for sporadic AD (82), or to consider PART as a part of AD due to partial overlap between age- and AD-associated stages of neurofibrillary degeneration and phases of Aβ deposition (83). Aging per se is not considered pathology whereas PART is defined as a neuropathological process. This study demonstrates a topographically selective but rather uniform rate of neuronal loss per day in adults and the elderly, without acceleration of neuronal loss in the elderly and without cognitive decline. Neuronal loss is the principal sign of an age-associated process, potentially over more than 70 years, which appears to be brain remodeling rather than disease. Multivariate analysis demonstrates no significant association between the number of neurons, the number of NFTs, and amyloid load in nondemented adults and the elderly, and suggests that these forms of neurodegeneration coexist with but are not a sine qua non component of age-associated brain remodeling.
Multiregional Decrease of Neuronal Reserve in Nondemented Adults and Elderly With Unspecified Age-Associated Functional Decline
Cognitive reserve and brain reserve have been postulated to make independent and interactive contributions to preserving functions with advanced adult aging and when the brain is exposed to injury (84, 85). According to proponents of the cognitive reserve concept, preexisting cognitive processing approaches or enlisting of compensatory approaches are used to cope with the detrimental effects of aging (85). In contrast, the original concept of a brain reserve was more focused on quantitative characteristics of brain structure and considered expanded numbers of neurons and synapses as protective factors. Consistent with this concept, the brain tolerates some pathology before it reaches a critical threshold for clinical symptoms to appear (84, 86). A measure of neuronal reserve might be the loss of neurons without a loss of specific function of affected brain structures and neuronal circuits. This study provides measures of the decrease in neuronal reserve in nondemented adults and elderly with some age-associated functional decline. Neuronal loss is characterized in (1) 3 subdivisions of the limbic system composed of disparate anatomical units (the EC, hippocampus, and amygdala) united by a major role in the memory system and the early onset of neurofibrillary degeneration in aging; (2) the thalamus and caudate nucleus, with minimal neurofibrillary degeneration, but early and severe neuronal loss in aging; and (3) Purkinje cells and neurons in the dentate nucleus free of neurofibrillary degeneration.
In nondemented subjects the estimated number of neurons in the EC decreased by 4.3 million (from 12.9 to 8.6 million; 33.3%) over the years between 25 and 102. In the study of nondemented subjects 60–90 years of age by Price et al (87), the number of neurons was reduced by 21%. In a group with very mild AD, the number of neurons was reduced by 35% in the EC, by 50% in layer II, and by 46% in CA1. In examined nondemented subjects the estimated number of neurons in the second layer of the EC was reduced by 54% (from 1.13 million at age of 25 years to 0.52 million at age of 102 years). For our adult group (25- to 63-year-olds), the estimated numbers of neurons were 11.9 million (CA1), 2.5 million (CA2 and CA3), and 1.5 million (CA4), whereas in the study by Korbo and West (88) of 21- to 56-year-old control subjects, the numbers of neurons were 14.7 million (CA1), 2.7 million (CA2 and CA3), and 2.7 million (CA4). Estimates of the number of neurons in CA1 in several studies of the elderly show a broader range of differences, from 16.0 million in 47- to 85-year-olds (48), to 6.2 million in 72- to 96-year-olds (89), and to 10.2 million in our group 69–102 years of age. While multiple factors might be contributing to this variation in findings, including hippocampal vascular fibrosis and calcification (90), vascular brain pathology, cardiovascular disorders, and ischemia (28), there is consistency with respect to the direction of the effects of aging, per se, and the regional neuronal loss in the aging human hippocampus is fundamentally different from the pattern associated with AD (91).
The amygdala is involved in emotional and motivational behavior, including emotional memory (92, 93) and learning (94), recognition of emotions and facial expression (95), and fear responses (96), which are disturbed in individuals with dementia (97). The amygdala is affected by neurofibrillary degeneration in AD (8) and by Lewy body degeneration in presymptomatic (27) and symptomatic Parkinson disease (98). In the examined nondemented individuals, the amygdala was affected by neurofibrillary degeneration early (Braak and Braak stage III) and consistently. The total number of neurons in the amygdala of our 69- to 102-year-old cases (10.2 million in 1 hemisphere) is comparable to the number of neurons in the left (10.7 million) and right (9.8 million) hemispheres reported by Vereecken et al (99) in control cases of similar age (62–93 years). Regression analysis-based estimates predict a decline in the number of neurons in 4 examined nuclei by 7.2 million in nondemented cases between 25 and 102 years of life and suggest that a 45.8% loss of neurons corresponds to loss of a part of the amygdala neuronal reserve.
The functions of the basal ganglia, including the nigrostriatal system, are motor planning and motor learning, regulation of posture, automatic movements, and ramp signals for smooth guided movements (100). These capabilities are known to deteriorate with age and in individuals diagnosed with Parkinson disease. The estimated decrease in the number of pigmented neurons from 860 000 at 25 years of age to 580 000 at 102 years of age (by 280 000, or 32%) detected in this study of the substantia nigra is similar to the age-associated neuronal losses reported in other studies, including 28.3% (101), 33% (47), 36% (102), and 48% (103). After adjustment of significance levels to maintain a False Discovery Rate of 0.05 for the 15 areas examined, the results for the substantia nigra were slightly short of significance (p = 0.0525) and were considered a trend towered age-associated neuronal loss. The neuronal loss in the substantia nigra is associated with decreases of about 10% (104) to 13% (105) in the level of striatal dopamine per decade of age. These data consistently document a prolonged presymptomatic phase, with clinical signs appearing only when 50% of nigral neurons and 80% of striatal dopamine are lost (106), and suggest that the estimated neuronal reserve in the substantia nigra is ∼50%. These studies of the dopaminergic system revealed the complex deterioration in neuronal reserve with cognitively healthy aging, increasing the risk of clinical decline and Parkinson disease.
The rate and range of neuronal loss in structures free of neurofibrillary degeneration are similar to those detected in the limbic system and basal ganglia of nondemented adults and elderly. In the examined cohort a 48.3% loss of Purkinje cells was seen over the age range of 25–102 years. A significant, that is, 30%–40%, loss of Purkinje cells was reported in the first morphometric studies of the cerebellum in 40- to 90-year-old individuals (107). A similar, 40% loss of Purkinje and granule cells and 28% loss of volume of the cortex was found in the anterior lobe in 19- to 84-year-old individuals examined with current stereological standards (108). The dentate nucleus, which is the relay center for fibers coming from the cerebral cortex (109), loses 40.1% of neurons, whereas the thalamus, which is the target of dentate nucleus axons constituting the dentate-thalamic tract, is affected by the same 40.5% loss of neurons.
The anterior part of the cerebellum regulates motor function, posture, muscle tone, and gait, which are often affected by aging. The posterior lobe is more involved with cognitive functions, including working memory, implicit and explicit learning, memory, and language (110, 111). The unique susceptibility of Purkinje cells to brain ischemia and hypoxia (112) suggests that brain hypoperfusion observed in the elderly might be a significant contributor to Purkinje cell loss. The approximately 40% reduction in the neuronal reserve in the cerebellum and thalamus appears to be a reflection of the reduced adaptive coordination of movements that occurs with age, and even in a subclinical range this may impose limits on everyday performance.
Study Limitations and Closing Remarks
The present study has 2 significant limitations. First, a lack of in-depth neuropsychological evaluations prior to death allows for the presence of subtle cognitive declines that cannot be ruled out, although all cases were clearly free of dementia. Second, the large range in age and overall sample size limited the number of cases within subsamples defined by age and severity of neuropathology. However, in spite of these limitations, the examined elderly reveal basic features of successful aging, including the absence of neurofibrillary degeneration expanding into the neocortex reported in large cohorts with cognitive assessment studies. A review of 11 studies comprising 555 nondemented individuals revealed that only 12 cases (2.2%) were classified as Braak stage V, and only 0.5% (3 subjects) were stage VI (63). These data and the evidence that the highest amounts of neocortical NFT pathology were never observed in the brains of individuals who were cognitively intact (29, 113) support the hypothesis that the key component of aging without cognitive impairment is the lack or limited expansion of neurofibrillary neurodegeneration to the neocortex.
The results of this study of adults and elderly without indications of dementia representing a wide range of chronological age suggest that a significant contributor to successful aging is absence of the topographic expansion of neurofibrillary degeneration to the neocortex and the limited progression of neurofibrillary degeneration in structures affected early. However, unbiased morphometric methods still demonstrated significant neuronal loss in 8 of 15 brain regions and their subdivisions and a surprisingly similar rate of neuronal loss in structures with and without neurofibrillary degeneration. No significant association was seen between neuronal loss, the number and percentage of neurons with NFTs, or amyloid load and age-related neuronal loss. Identification of the mechanisms limiting topographic expansion and preventing neocortical neurofibrillary degeneration and neuronal loss for several decades may help in the design of treatments preventing the transition from preclinical pathology to AD. Measures of significant multiregional neuronal loss indicate that aging is associated with a reduction of brain reserve capacity, increasing the risk of crossing a threshold between nonsymptomatic and symptomatic pathology when the brain is exposed to additional pathology. The reduction of neuronal reserve by age-associated nonneurofibrillary neuronal loss appears to be an underestimated subcomponent of neuronal loss reported in subjects diagnosed with AD.
ACKNOWLEDGEMENTS
The tissue was obtained from the Brain and Tissue Bank for Developmental Disabilities and Aging at the New York State Institute for Basic Research in Developmental Disabilities, Staten Island, NY; the Brain and Tissue Bank for Developmental Disorders of the National Institute of Child Health and Human Development at the University of Maryland; and the Aging and Dementia Research Center at the New York University School of Medicine. The authors thank Dr. Humi Imaki for her contribution to morphometric studies, Mrs. Maureen Marlow for manuscript editing and Mrs. Jadwiga Wegiel, Cathy Wang, and En Wu Zheng for histology and immunocytochemistry.
REFERENCES
- 1. Wan H, Sengupta M, Velkoff VA, et al. 65+ in the United States: 2005 In: U.S. Census Bureau, Current Population Reports, P23-2009. Washington, DC: U.S. Government Printing Office, 2009 [Google Scholar]
- 2. Wan H, Muenchrath MN, 90+ in the United States: 2006–2008. In: U.S. Census Bureau, ed. American Community Survey Reports, ACS-17 Washington, DC: U.S. Government Printing Office, 2011
- 3. Robert L, Fulop T, Longevity and its regulation: Centenarians and beyond In: Robert L, Fulop T. eds. Aging: Facts and Theories. Basel: Karger; 2014:198–211 [DOI] [PubMed] [Google Scholar]
- 4. Rowe JW, Kahn RL.. Successful aging. Gerontologist 1997;37:433–40 [DOI] [PubMed] [Google Scholar]
- 5. Harman D. Aging: Overview. Ann N Y Acad Sci 2001;928:1–21 [DOI] [PubMed] [Google Scholar]
- 6. Braak H, Del Tredici K.. The pathological process underlying Alzheimer’s disease in individuals under thirty. Acta Neuropathol 2011;121:171–81 [DOI] [PubMed] [Google Scholar]
- 7. Braak H, Braak E.. Frequency of stages of Alzheimer-related lesions in different age categories. Neurobiol Aging 1997;18:351–7 [DOI] [PubMed] [Google Scholar]
- 8. Braak H, Braak E.. Neuropathological staging of Alzheimer-related changes. Acta Neuropathol 1991;82:239–59 [DOI] [PubMed] [Google Scholar]
- 9. Jorm AF, Jolley D.. The incidence of dementia: A meta analysis. Neurology 1998;51:728–33 [DOI] [PubMed] [Google Scholar]
- 10. Blansjaar BA, Thomassen R, van Schaick HW.. Prevalence of dementia in centenarians. Int J Ger Psychiatry 2000;15:219–25 [DOI] [PubMed] [Google Scholar]
- 11. Savva GM, Wharton SB, Ince PG, et al. Age, neuropathology and dementia. N Engl J Med 2009;360:2302–9 [DOI] [PubMed] [Google Scholar]
- 12. Deleaere P, He Y, Fayet G, et al. Beta A4 deposits are constant in the brain of the oldest old: An immunocytochemical study of 20 French centenarians. Neurobiol Aging 1993;14:191–4 [DOI] [PubMed] [Google Scholar]
- 13. Den Dunnen WF, Brouwer WH, Bijlard E, et al. No disease in the brain of a 115-year-old woman. Neurobiol Aging 2008;29:1127–32 [DOI] [PubMed] [Google Scholar]
- 14. Mizutani T, Shimada H.. Neuropathological background of twenty seven centenarians brains. J Neurol Sci 1992;108:168–77 [DOI] [PubMed] [Google Scholar]
- 15. Von Gunten A, Ebbing K, Imhof A, et al. Brain aging in the oldest old. Curr Gerontol Geriatrics Res 2010. doi:10.1155/2010/358531 [DOI] [PMC free article] [PubMed] [Google Scholar]
- 16. Bullain SS, Corrada MM.. Dementia in the oldest old. Continuum 2013;19:457–69 [DOI] [PMC free article] [PubMed] [Google Scholar]
- 17. Juva K, Verkkoniemi A, Viramo P, et al. APOEε4 does not predict mortality, cognitive decline, or dementia in the oldest old. Acta Neurologica Scandinavica 2000;54:412–5 [DOI] [PubMed] [Google Scholar]
- 18. Braak H, Del Tredici K.. Are cases with tau pathology occurring in the absence of Aβ deposits part of the AD-related pathological process?. Acta Neuropathol 2014;128:767–72 [DOI] [PubMed] [Google Scholar]
- 19. Ferrer I. Defining Alzheimer as a common age-related neurodegenerative process not inevitably leading to dementia. Prog Neurobiol 2012;97:38–51 [DOI] [PubMed] [Google Scholar]
- 20. James BD, Bennett DA, Boyle PA, et al. Dementia from Alzheimer disease and mixed pathologies in the oldest old. JAMA 2012;307:1798–800 [DOI] [PMC free article] [PubMed] [Google Scholar]
- 21. Elobeid A, Libard S, Leino M, et al. Altered proteins in the aging brain. J Neuropathol Exp Neurol 2016;75:316–25 [DOI] [PMC free article] [PubMed] [Google Scholar]
- 22. Mufson EJ, Malek-Ahmadi M, Perez SE, et al. Braak staging, plaque pathology, and APOE status in elderly persons without cognitive impairment. Neurobiol Aging 2016;37:147–53 [DOI] [PMC free article] [PubMed] [Google Scholar]
- 23. Rogalski EJ, Gefen T, Shi J, et al. Youthful memory capacity in old brains: Anatomic and genetic clues from the Northwestern SuperAging Project. J Cogn Neurosci 2013;25:29–36 [DOI] [PMC free article] [PubMed] [Google Scholar]
- 24. Stern Y. Cognitive reserve in ageing and Alzheimer’s disease. Lancet Neurol 2012;11:1006–12 [DOI] [PMC free article] [PubMed] [Google Scholar]
- 25. Arnold SJ, Dugger BN, Beach TG.. TDP-43 deposition in prospectively followed, cognitively normal elderly individuals: Correlation with argyrophilic grains but not other concomitant pathologies. Acta Neuropathol 2013;126:51–7 [DOI] [PMC free article] [PubMed] [Google Scholar]
- 26. Jellinger KA. Lewy body-related α-synucleinopathy in the aged human brain. J Neural Transm 2004;111:1219–35 [DOI] [PubMed] [Google Scholar]
- 27. Markesbery WR, Jicha GA, Liu H, et al. Lewy body pathology in normal elderly subjects. J Neuropathol Exp Neurol 2009;68:816–22 [DOI] [PMC free article] [PubMed] [Google Scholar]
- 28. Jellinger KA, Attems J.. Challenges of multimorbidity of the aging brain: A critical update. J Neural Transm 2015;122:505–21 [DOI] [PubMed] [Google Scholar]
- 29. Jicha GA, Abner EL, Schmitt FA, et al. Preclinical AD Workgroup staging: Pathological correlates and potential challenges. Neurobiol Aging 2012;33:622e1–e16 [DOI] [PMC free article] [PubMed] [Google Scholar]
- 30. The National Institute on Aging and Reagan Institute Working Group on Diagnostic Criteria for the Neuropathological Assessment of Alzheimer's Disease. Consensus recommendations for the postmortem diagnosis of Alzheimer's disease. Neurobiol Aging 1997;18:1–2 [PubMed] [Google Scholar]
- 31. Braak H, Alafuzoff I, Arzberger T, et al. Staging of Alzheimer disease-associated neurofibrillary pathology using paraffin sections and immunocytochemistry. Acta Neuropathol 2006;112:389–404 [DOI] [PMC free article] [PubMed] [Google Scholar]
- 32. Goedert M, Spillantini MG, Jakes R, et al. Multiple isoforms of human microtubule-associated protein tau: Sequences and localization in neurofibrillary tangles of Alzheimer’s disease. Neuron 1989;3:519–26 [DOI] [PubMed] [Google Scholar]
- 33. Grundke-Iqbal I, Iqbal K, Tung YC, et al. Abnormal phosphorylation of the microtubule associated protein τ (tau) in Alzheimer cytoskeletal pathology. Proc Natl Acad Sci USA 1986;83:4913–7 [DOI] [PMC free article] [PubMed] [Google Scholar]
- 34. Bancher C, Brunner C, Lassmann H, et al. Accumulation of abnormally phosphorylated τ precedes the formation of neurofibrillary tangles in Alzheimer's disease. Brain Res 1989;477:90–9 [DOI] [PubMed] [Google Scholar]
- 35. Kim KS, Miller DL, Sapienza VJ, et al. Production and characterization of monoclonal antibodies reactive to synthetic cerebrovascular amyloid peptide. Neurosci Res Commun 1988;2:121–30 [Google Scholar]
- 36. Kitamoto T, Ogomori K, Tateishi J, et al. Methods in laboratory investigation. Formic acid pretreatment enhances immunostaining of cerebral and systemic amyloids. Lab Invest 1987;57:230–6 [PubMed] [Google Scholar]
- 37. Wegiel J, Flory M, Kuchna I, et al. Brain-region-specific alterations of the trajectories of neuronal volume growth throughout the lifespan in autism. Acta Neuropathol Comm 2014;2:28. [DOI] [PMC free article] [PubMed] [Google Scholar]
- 38. Wegiel J, Flory M, Kuchna I, et al. Stereological study of the neuronal number and volume of 38 brain subdivisions of subjects diagnosed with autism reveals significant alterations restricted to the striatum, amygdala and cerebellum. Acta Neuropathol Comm 2014;2:141. [DOI] [PMC free article] [PubMed] [Google Scholar]
- 39. Schuman CM, Amaral DG.. Stereological analysis of amygdala neuron number in autism. J Neurosci 2006;26:7674–9 [DOI] [PMC free article] [PubMed] [Google Scholar]
- 40. Lorente de No R. Studies on the structure of the cerebral cortex. II. Continuation of the study of the Ammonic system. J Psychol Neurol 1934;46:113–77 [Google Scholar]
- 41. Duvernoy HM, The Human Hippocampus. An Atlas of Applied Anatomy. München: J.F. Bergmann Verlag; 1988:1–166 [Google Scholar]
- 42. Amaral DG, Insausti R, Hippocampal formation In: Paxinos G, ed. The Human Nervous System. San Diego: Academic Press Inc; 1990:711–55 [Google Scholar]
- 43. Insausti R, Tunon T, Sobreviela T, et al. The human entorhinal cortex: A cytoarchitectonic analysis. J Compar Neurol 1995;355:171–98 [DOI] [PubMed] [Google Scholar]
- 44. Rosene DL, Van Hoesen GW, The hippocampal formation of the primate brain In: Jones EG, Peters A, eds. Cerebral Cortex. Vol. 6. Further Aspects of Cortical Functioning, Including Hippocampus. New York: Plenum Press; 1987:345–56 [Google Scholar]
- 45. Vogels OIM, Broere CAJ, Ter Lak HJ, et al. Cell loss and shrinkage in the nucleus basalis Meynerti complex in Alzheimer’s disease. Neurobiol Aging 1990;11:3–13 [DOI] [PubMed] [Google Scholar]
- 46. Fearnley JM, Lees AJ.. Aging and Parkinson’s disease: Substantia nigra regional selectivity. Brain 1991;114:2283–301 [DOI] [PubMed] [Google Scholar]
- 47. Fearnley JM, Lees AJ, Pathology of Parkinson’s disease In: Calne DB, ed. Neurodegenerative Diseases. Philadelphia: Saunders Company; 1993:545–54 [Google Scholar]
- 48. West MJ, Gundersen HJ.. Unbiased stereological estimation of the number of neurons in the human hippocampus. J Comp Neurol 1990;296:1–22 [DOI] [PubMed] [Google Scholar]
- 49. Chatterjee S, Price B, Regression Analysis by Example. New York: John Wiley and Sons, 1977 [Google Scholar]
- 50. Cohen J, Cohen P, Applied Multiple Regression/Correlation Analysis For The Behavioral Sciences, 2nd edn Hillsdale, NJ: Lawrence Erlbaum Associates; 1983 [Google Scholar]
- 51. Benjamini Y, Hochberg Y.. Controlling the false discovery rate: A practical and powerful approach to multiple testing. J Roy Stat Soc B 1995;57:289–300 [Google Scholar]
- 52. Bennett DA, Schneider JA, Arvanitakis Z, et al. Neuropathology of older persons without cognitive impairment from two community-based studies. Neurology 2006;66:1837–44 [DOI] [PubMed] [Google Scholar]
- 53. Crystal H, Dickson D, Fuld P, et al. Clinico-pathologic studies in dementia: Nondemented subjects with pathologically confirmed Alzheimer’s disease. Neurology 1988;38:1682–7 [DOI] [PubMed] [Google Scholar]
- 54. Dickson DW, Crystal HA, Mattiace LA, et al. Identification of normal and pathological aging in prospectively studied nondemented elderly humans. Neurobiol Aging 1991;13:179–89 [DOI] [PubMed] [Google Scholar]
- 55. Hof PR, Giannakopoulos P, Bouras C.. The neuropathological changes associated with normal brain aging. Histol Histopathol 1996;11:1075–88 [PubMed] [Google Scholar]
- 56. Hulette CM, Welsh-Bohmer KA, Murray MG, et al. Neuropathological and neuropsychological changes in “normal” aging: Evidence for preclinical Alzheimer disease in cognitively normal individuals. J Neuropathol Exp Neurol 1998;57:1168–74 [DOI] [PubMed] [Google Scholar]
- 57. Knopman DS, Parisi JE, Salviati A, et al. Neuropathology of cognitively normal elderly. J Neuropathol Exp Neurol 2003;62:1087–95 [DOI] [PubMed] [Google Scholar]
- 58. Nelson PT, Head E, Schmitt FA, et al. Alzheimer’s disease is not “brain aging”: Neuropathological, genetic, and epidemiological human studies. Acta Neuropathol 2011;121:571–87 [DOI] [PMC free article] [PubMed] [Google Scholar]
- 59. Price JL, Davis PB, Morris JC, et al. The distribution of tangles, plaques and related immunohistochemical markers in healthy aging and Alzheimer's disease. Neurobiol Aging 1991;12:295–312 [DOI] [PubMed] [Google Scholar]
- 60. Price JL, McKeel DW Jr, Buckles VD, et al. Neuropathology of nondemented aging: Presumptive evidence for preclinical Alzheimer disease. Neurobiol Aging 2009;30:1026–36 [DOI] [PMC free article] [PubMed] [Google Scholar]
- 61. Ohm TG, Müller H, Braak H, Bohl J.. Close-meshed prevalence rates of different stages as a tool to uncover the rate of Alzheimer's disease-related neurofibrillary changes. Neuroscience 1995;64:209–17 [DOI] [PubMed] [Google Scholar]
- 62. Arriagada PV, Marzloff K, Hyman BT.. Distribution of Alzheimer-type pathologic changes in non-demented elderly individuals matches the pattern in Alzheimer's disease. Neurology 1992;42:1681–8 [DOI] [PubMed] [Google Scholar]
- 63. Nelson PT, Braak H, Markesberry WR.. Neuropathology and cognitive impairment in Alzheimer disease: A complex but coherent relationship. J Neuropathol Exp Neurol 2009;68:1–14 [DOI] [PMC free article] [PubMed] [Google Scholar]
- 64. Harrison TM, Weintraub S, Mesulam M, et al. Superior memory and higher cortical volumes in unusually successful cognitive aging. J Int Neuropsychol Soc 2012;18:1081–5 [DOI] [PMC free article] [PubMed] [Google Scholar]
- 65. West MJ, Coleman PD, Flood DG, et al. Differences in the pattern of hippocampal neuronal loss in normal aging and Alzheimer's disease. Lancet 1994;344:769–72 [DOI] [PubMed] [Google Scholar]
- 66. Von Gunten A, Kövari E, Bussiere T, et al. Cognitive impact of neuronal pathology in the entorhinal cortex and CA1 field in Alzheimer’s disease. Neurobiol Aging 2006;27:270–7 [DOI] [PubMed] [Google Scholar]
- 67. Gomez-Isla T, Hollister R, West M, et al. Neuronal loss correlates with but exceeds neurofibrillary tangles in Alzheimer disease. Ann Neurol 1997;41:17–24 [DOI] [PubMed] [Google Scholar]
- 68. Kril JJ, Patel S, Harding AJ, et al. Neuron loss from the hippocampus of Alzheimer’s disease exceeds extracellular neurofibrillary tangle formation. Acta Neuropathol 2002;103:370–6 [DOI] [PubMed] [Google Scholar]
- 69. Hof PR, Bussiere T, Gold G, et al. Stereologic evidence for persistence of viable neurons in layer II of the entorhinal cortex and the CA1 field in Alzheimer disease. J Neuropathol Exp Neurol 2003;62:55–67 [DOI] [PubMed] [Google Scholar]
- 70. Morsch R, Simon W, Coleman PD.. Neurons may live for decades with neurofibrillary tangles. J Neuropathol Exp Neurol 1999;58:188–97 [DOI] [PubMed] [Google Scholar]
- 71. Bennett DA, Schneider JA, Wilson RS, et al. Neurofibrillary tangles mediate the association of amyloid load with clinical Alzheimer disease and level of cognitive function. Arch Neurol 2004;61:378–84 [DOI] [PubMed] [Google Scholar]
- 72. Giannakopoulos P, Herrmann FR, Bussiere T, et al. Tangle and neuron numbers, but not amyloid load, predict cognitive status in Alzheimer’s disease. Neurology 2003;60:1495–500 [DOI] [PubMed] [Google Scholar]
- 73. Gold G, Kövari E, Corte G, et al. Clinical validity of Aβ-protein deposition staging in brain aging and Alzheimer disease. J Neuropathol Exp Neurol 2001;60:946–52 [DOI] [PubMed] [Google Scholar]
- 74. Gold G, Bouras C, Kövari E, et al. Clinical validity of Braak neuropathological staging in the oldest-old. Acta Neuropathol 2000;99:579–82 [DOI] [PubMed] [Google Scholar]
- 75. Kövari E, Herrmann FR, Bouras C, et al. Amyloid deposition is decreasing in aging brains. Neurology 2014;82:326–31 [DOI] [PubMed] [Google Scholar]
- 76. Von Gunten A, Kövari E, Rivara CB, et al. Stereologic analysis of hippocampal Alzheimer’s disease pathology in the oldest-old: Evidence for sparing of the entorhinal cortex and CA1 field. Exp Neurol 2005;193:198–206 [DOI] [PubMed] [Google Scholar]
- 77. Neltner JH, Abner EL, Jicha GA, et al. Brain pathologies in extreme old age. Neurobiol Aging 2016;37:1–11 [DOI] [PMC free article] [PubMed] [Google Scholar]
- 78. Jernigan TL, Archibald SL, Fenema-Notestine C, et al. Effects of age on tissues and regions of the cerebrum and cerebellum. Neurobiol Aging 2001;22:581–94 [DOI] [PubMed] [Google Scholar]
- 79. Raz N, Rodrigue KM, Kennedy KM, et al. Differential aging of the human striatum: Longitudinal evidence. Am J Neuroradiol 2003;24:1849–56 [PMC free article] [PubMed] [Google Scholar]
- 80. Raz N, Lindenberger U, Rodrigue KM, et al. Regional brain changes in aging healthy adults: General trends, individual differences and modifiers. Cerebral Cortex 2005;15:1676–89 [DOI] [PubMed] [Google Scholar]
- 81. Crary JF, Trojanowski JQ, Schneider JA, et al. Primary age-related tauopathy (PART): A common pathology associated with human aging. Acta Neuropathol 2014;128:755–66 [DOI] [PMC free article] [PubMed] [Google Scholar]
- 82. Jellinger KA, Alafuzoff I, Attems J, et al. PART, a distinct tauopathy, different from classical sporadic Alzheimer disease. Acta Neuropathol 2015;129:757–62 [DOI] [PMC free article] [PubMed] [Google Scholar]
- 83. Duyckaerts C, Braak H, Brion J-P, et al. PART is part of Alzheimer disease. Acta Neuropathol 2015;129:749–56 [DOI] [PMC free article] [PubMed] [Google Scholar]
- 84. Steffener J, Stern Y.. Exploring the neural basis of cognitive reserve in aging. Biochem Biophys Acta 2012;1822:467–73 [DOI] [PMC free article] [PubMed] [Google Scholar]
- 85. Stern Y. Cognitive reserve. Neuropsychologia 2009;47:2015–28 [DOI] [PMC free article] [PubMed] [Google Scholar]
- 86. Whalley LJ, Deary IJ, Appleton CL, et al. Cognitive reserve and neurobiology of cognitive aging. Ageing Res Rev 2004;3:369–82 [DOI] [PubMed] [Google Scholar]
- 87. Price JL, Ko AI, Wade MJ, et al. Neuron number in the entorhinal cortex and CA1 in preclinical Alzheimer disease. Arch Neurol 2001;58:1395–402 [DOI] [PubMed] [Google Scholar]
- 88. Korbo L, West M.. No loss of hippocampal neurons in AIDS patients. Acta Neuropathol 2000;99:529–33 [DOI] [PubMed] [Google Scholar]
- 89. West MJ, Kawas CH, Stewart WF, et al. Hippocampal neurons in pre-clinical Alzheimer’s disease. Neurobiol Aging 2004;25:1205–12 [DOI] [PubMed] [Google Scholar]
- 90. Wegiel J, Kuchna I, Wisniewski T, et al. Vascular fibrosis and calcification in the hippocampus in aging, Alzheimer disease, and Down syndrome. Acta Neuropathol 2002;103:333–43 [DOI] [PubMed] [Google Scholar]
- 91. West MJ. Regionally specific loss of neurons in the aging human hippocampus. Neurobiol Aging 1993;14:287–93 [DOI] [PubMed] [Google Scholar]
- 92. Cahill L, Babinsky R, Markowitsch HJ, et al. The amygdala and emotional memory. Nature 1995;377:295–6 [DOI] [PubMed] [Google Scholar]
- 93. Mori M, Ikeda N, Hirono H, et al. Amygdala volume and emotional memory in Alzheimer’s disease. Am J Psychiatry 1999;156:216–22 [DOI] [PubMed] [Google Scholar]
- 94. Morris JS, Öhman A, Dolan RJ.. Conscious and unconscious emotional learning in the human amygdala. Nature 1998;393:467–70 [DOI] [PubMed] [Google Scholar]
- 95. Adolphs R, Tranel D, Damasio H, et al. Impaired recognition of emotion in facial expression following bilateral damage to the human amygdala. Nature 1994;372:669–72 [DOI] [PubMed] [Google Scholar]
- 96. Davis M. Neurobiology of fear responses; the role of amygdala. J Neuropsychiatr Clin Neurosci 1997;9:382–402 [DOI] [PubMed] [Google Scholar]
- 97. Herzog AG, Kemper TL.. Amygdaloid changes in aging and dementia. Arch Neurol 1980;37:625–9 [DOI] [PubMed] [Google Scholar]
- 98. Braak H, Braak E, Yilmazer D, et al. Amygdala pathology in Parkinson’s disease. Acta Neuropathol 1994;88:493–500 [DOI] [PubMed] [Google Scholar]
- 99. Vereecken THLG, Vogels O, Nieuwenhuys JM.. Neuron loss and shrinkage in the amygdala in Alzheimer’s disease. Neurobiol Aging 1994;15:45–54 [DOI] [PubMed] [Google Scholar]
- 100. Alheid GF, Heimer L, Switzer RC, Basal ganglia In: Paxinos G, ed. The Human Nervous System. San Diego: Academic Press Inc; 1990:483–582 [Google Scholar]
- 101. Rudow G, Brien R, Savonenko AV, et al. Morphometry of the human substantia nigra in ageing and Parkinson’s disease. Acta Neuropathol 2008;115:461–70 [DOI] [PMC free article] [PubMed] [Google Scholar]
- 102. Mann DMA, Yates PO, Marcyniuk B.. Alzheimer’s presenile dementai, senile dementia of Alzheimer type and Down’s syndrome in middle age form age related continuum of pathological changes. Neuropathol Appl Neurobiol 1984;10:185–207 [DOI] [PubMed] [Google Scholar]
- 103. McGeer PL, McGeer EG, Suzuki JS.. Aging and extrapyramidal function. Arch Neurol 1977;34:33–5 [DOI] [PubMed] [Google Scholar]
- 104. Scherman D, Desnos C, Darchen F, et al. Striatal dopamine deficiency in Parkinson’s disease: Role of aging. Ann Neurol 1989;26:551–7 [DOI] [PubMed] [Google Scholar]
- 105. Riederer P, Wuketich S.. Time course of nigrostriatal degeneration in Parkinson’s disease. A detailed study of influential factors in human brain amine analysis. J Neural Transm 1976;38:277–301 [DOI] [PubMed] [Google Scholar]
- 106. Marsden SD. Parkinson’s disease. Lancet 1990;335:948–52 [DOI] [PubMed] [Google Scholar]
- 107. Ellis RS. A preliminary quantitative study of the Purkinje cells in normal, subnormal and senescent human cerebella, with some notes on functional localization. J Comp Neurol 1920;32:1–33 [Google Scholar]
- 108. Andersen BB, Gundersen HJG, Pakkenberg B.. Aging of the human cerebellum: A stereological study. J Comp Neurol 2003;466:356–65 [DOI] [PubMed] [Google Scholar]
- 109. Larsell O, Jansen J, The Comparative Anatomy and Histology of the Cerebellum. The Human Cerebellum, Cerebellar Connections, and Cerebellar Cortex. Minneapolis, MN: University of Minnesota Press; 1972 [Google Scholar]
- 110. Leiner HC, Leiner AL, Dow RS.. Cognitive and language functions of the human cerebellum. Trends Neurosci 1993;11:444–7 [DOI] [PubMed] [Google Scholar]
- 111. Schmachmann JD. Dysmetria of thought: A clinical consequences of cerebellar dysfunction on cognition and affect. Trends Cogn Sci 1998;2:362–70 [DOI] [PubMed] [Google Scholar]
- 112. Cervos-Navarro J, Diemer NH.. Selective vulnerability in brain hypoxia. Crit Rev Neurobiol 1991;6:149–82 [PubMed] [Google Scholar]
- 113. Abner EL, Kryscio RJ, Schmitt FA, et al. “ End-stage” neurofibrillary tangle pathology in preclinical Alzheimer’s disease: Fact or fiction?. J Alzheimers Dis 2011;25:445–53 [DOI] [PMC free article] [PubMed] [Google Scholar]