Abstract
Microscopic imaging at high spatial-temporal resolution over long time scales (minutes to hours) requires rapid and precise stabilization of the microscope focus. Conventional and commercial autofocus systems are largely based on piezoelectric stages or mechanical objective actuators. Objective to sample distance is either measured by image analysis approaches or by hardware modules measuring the intensity of reflected infrared light. We propose here a truly all-optical microscope autofocus taking advantage of an electrically tunable lens and a totally internally reflected infrared probe beam. We implement a feedback-loop based on the lateral position of a totally internally reflected infrared laser on a quadrant photodetector, as an indicator of the relative defocus. We show here how to treat the combined contributions due to mechanical defocus and deformation of the tunable lens. As a result, the sample can be kept in focus without any mechanical movement, at rates up to hundreds of Hertz. The device requires only reflective optics and can be implemented at a fraction of the cost required for a comparable piezo-based actuator.
OCIS codes: (180.0180) Microscopy, (110.0110) Imaging systems, (170.2520) Fluorescence microscopy, (220.1080) Active or adaptive optics, (230.0230) Optical devices
1. Introduction
In optical microscopy maintaining a sample in focus remains a critical challenge: mechanical and thermal fluctuations as well as thermal instability of the microscope body all contribute to focus drifts. These can disrupt routine time lapse imaging, single molecule imaging and super resolution microscopy, even over short periods [1]. To oppose these inevitable fluctuations it is important to use automatic focal plane detection and stabilization systems. A large number of strategies for autofocusing has been developed over the years, and we will reference here only a relevant sub-set.
In general terms, such autofocus systems can be divided among those based on software focusing algorithms which analyze and compare the in focus and out of focus image [2–4], or on optical approaches which measure the actual objective to sample distance [5, 6]. The latter systems typically employ a near-infrared laser or light emitting diode which emits photons that are reflected by the sample interface, typically a glass coverslip, onto an optical detection system. As the reflected light position or pattern is sensitive to any displacement between this interface and optical train, the focal displacement can be quantified. The near-infrared beam can impinge on the glass coverslip at normal incidence, or more advantageously, if the NA of the objective is sufficient, at an angle allowing a larger portion of the incident light to be reflected. In both approaches, the relative position of the optical train to the sample has to be mechanically adjusted. This is generally achieved by a piezoelectric stage or objective actuator, typically expensive and relatively slow. In all cases, relative mechanical movement between the objective and the sample cannot be avoided in order to maintain the focus. Here, we propose an electrically tunable lens (ETL) paired to the microscope objective as an effective focal distance modulator, without requiring any mechanical objective-sample displacement.
ETLs are a type of fluid lenses, where a transparent liquid is contained between two membranes which can be electrically actuated in order to change the shape of the lens surfaces. As a result, the focal distance of the ETL can be modulated continuously with an applied current. By mounting the ETL close to the back focal plane of a microscope objective, -correcting when necessary with negative focal length lenses-, it is possible to achieve axial scans of the optical systems in excess of hundreds of micrometers by applying currents within the 100 mA range to the tunable lens.
Thanks to this property, ETLs coupled to objectives have been demonstrated as effective focal distance modulators in microscopes [7]. This ability has been exploited (i) to achieve fast changes of axial position, i.e. rapid change of plane in multi photon microscopy [8], volumetric imaging [9] or rapid 3D particle tracking [10]; (ii) to slowly correct for sample drifts arising from mechanical or thermal fluctuations, effectively acting as autofocusing devices [11]. In all instances, the instant focal position of the optical system is derived from the value of the tunable lens input. Namely, most systems operate in an open-loop configuration. Although feedback systems have been reported to account for thermal drifts affecting the focal tuning of electrical lenses [7], these are not true closed loop systems as they do not take into account potential mechanical drifts of the optical train relative to the sample.
In the current manuscript, we address this shortcoming: while the performance of our measurements in terms of bandwidth and resolution is dictated by the available commercial device, we provide here for the first time a novel application by describing a true closed-loop autofocus system using a tunable lens. By implementing a closed loop feedback circuit through a totally internally reflected IR laser onto a quadrant photodetector, displacements of the reflected beam relate with high sensitivity to changes in the objective to sample distance. An ETL coupled to the microscope objective readjusts the focal position presenting a fast and cost effective all-optical autofocus solution.
2. Materials and methods
2.1. Materials
ETL (EL-16-40-TC), with a clear aperture of 40 mm and focal power from −2 to +3 diopt. was purchased from Optotune AG, Switzerland. Complete technical information is available on the manufacturer website [12]. The cover glasses are VIS coated in the range of 420–950 nm. The focal power ranges from −2 to 3 diopters. C-Mount adapters, optical components, mirrors and the single mode pigtailed laser diode with a wavelength of 776.7 nm, a fiber type of 780HP and the OEM Laser Diode Driver Evaluation Kit EK2000 were all ordered from Thorlabs, USA. The Quadrant Photodiode (QPD) MTQD5.8PV1-5 from Marktech Electronics has a peak sensitivity wavelength of 940 nm. The electrical detection circuit was custom assembled upon transimpedance, difference and sum amplifiers. Analog signals were generated and acquired through a NI DAQ 6363 Card (National Instruments). Imaging was performed on a custom-made TIRF setup assembled based on the frame of an Olympus IX73 microscope. The sample was mounted on an MS2000 motorized stage from ASI (USA), including a motorized actuator to achieve axial movement of the microscope turret with a step resolution of 50 nm. The lower deck of the microscope body was used to install the optical feedback setup (see experimental setup in Fig. 1(a)). Images were collected using a Photometrics Cascade II 512 EMCCD camera. Camera images including single beads images were analyzed using ImageJ. To determine defocus, a line profile was captured through the center of a bead, and a Gaussian function was fit to the bead profile to extract the standard deviation.
Fig. 1.
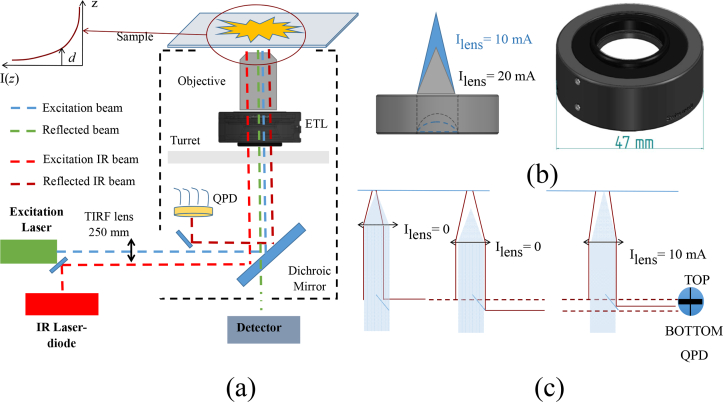
Experimental setup and working principle. a) Experimental setup: an IR laser diode beam enters the microscope through the pigtailed fiber, gets reflected by the mirrors, passes through the ETL (in black, below the objective) and the objective where it gets totally internally reflected (red dashed). The reflected beam gets deflected by mirrors onto the QPD (dark red). The conventional laser excitation of the inverted microscope follows the usual path, reflected by the dichroic mirror (blue dashed), while the fluorescence is transmitted to the detector (green dashed). Inset: exponential decay of the TIR field at the sample. b) Left: ETL illustrating different curvatures and focal points for two different currents. Right: schematics of the ETL with its physical dimension. c) Schematics of the independent effect of current application on the reflected IR beam and the focal position. The combined objective-ETL assembly is illustrated as a thin lens. The reflected IR laser (dark red lines) exits through the lens hitting the QPD in distinct positions depending on the relative physical objective to sample distance (position 1 to 2) and the current applied to the ETL (position 3). The focal position (shaded blue embodies a collimated excitation beam) changes upon application of a current.
The sample was excited using a Cube 488 nm Laser Diode (Coherent). The excitation beam was brought into TIRF by translating a 250 mm lens (Thorlabs) which focuses it in the back focal plane of the 60×, 1.49 NA TIRF objective (Olympus). As a result, the focused excitation spot translates in the back focal plane of the objective away from the optical axis, and the beam exiting the objective tilts until reaching the critical angle at the sample interface. The feedback algorithm was programmed in LabView (National Instruments).
Mitochondrial staining for live cell imaging was achieved using Mitotracker Green from Thermo Fisher Scientific (USA).
2.2. Experimental setup
The autofocus system is based on the coupling of the ETL to the microscope objective; the overall optical setup within a standard inverted fluorescence microscope is represented in Fig. 1(a).
The IR (red dashed) laser beam enters through the side of the lower deck of the Olympus IX73 microscope and is reflected by 0.5 inch mirrors through the periphery of the 1 inch aperture of the filter cube holding the dichroic mirror (Chroma ET 488/561), aligned to the optical axis of the microscope. From here it enters the combined ETL and microscope objective block. The IR beam is then totally internally reflected at the coverslip-sample interface and the reflected beam is collected on the other side of the aperture of the dichroic filter cube and steered onto the QPD. The optics used to steer the probe IR beam are installed in such way to affect minimally the excitation pathway, and are not affecting at all the emission pathway.
Total Internal Reflection (TIR) is the process whereby an electromagnetic wave, such as a laser beam, hits a surface separating two media with different refractive indices at an angle (critical angle) allowing the beam to be entirely reflected by the surface, with no transmitted light besides in a thin region in proximity of the separation surface. For a glass to water interface the critical angle is 61.4 deg. In an objective based configuration the maximum angle of a ray exiting from the objective is related to the NA of the objective by the formula NA = n1 · sin(θ). For NA=1.49, as in our setup, the exit angle is 78.9 deg, way above the critical angle even for a slightly diverging laser beam. The penetration depth of the transmitted beam, also known as evanescent wave, is regulated by the following equation for the intensity:
| (1) |
where d is a parameter which is wavelength λ and incidence angle θ dependent, according to the relationship:
| (2) |
where n1 and n2 are the refractive indices of the media before and after the interface respectively. In our conditions, for λ = 785nm, d is of the order of 100 nm, resulting in a negligible penetration of the probe beam within the sample, as illustrated in the inset of Fig. 1(a). Furthermore, for a 1.49 NA objective, the circular annulus of the back focal plane where a focused beam yields TIR is of the order of 0.3 mm. This allows for a comfortable tolerance in order to achieve TIR. Changes in the position of the reflected beam are quantitatively measured by the voltage output of the quadrant photodetector QPD(V). In particular, if we label the QPD quadrants as follows: top(1), top(2), bottom(1), bottom(2), then the QPD output voltage which we use in our system is given by a combination of the voltage of each individual quadrant (proportional to the incident photon flux) as follows:
| (3) |
where the denominator represents a normalization to the total incident light. An electric circuit converts this signal into a voltage which is then read into the software feedback algorithm, which in turn returns a current output signal to the ETL. The feedback algorithm was programmed in LabView (National Instruments), using a proportional-integral-derivative (PID) controller provided with the standard library of the software.
Figure 1(b) shows the ETL with its dimension and two different focal positions corresponding to distinct currents. Figure 1(c) illustrates the working principle of the lens and the two distinct effects on the reflected probe beam arising from changes in the objective to sample distance or in the application of a current to the lens. Changes in the position of the reflected beam are quantitatively measured by the voltage output of the quadrant photodetector QPD(V). The QPD(V) set-point corresponds to the condition when the sample, for a given current applied to the ETL, is in-focus.
3. Results and discussion
3.1. Calibration of the autofocus
In order to establish the relationship between QPD voltage changes and (i) objective-to-sample physical displacement and (ii) ETL input current, a calibration sample, made using 100 nm diameter fluorescent microspheres (Tetraspeck, Thermofisher Scientific), was employed.
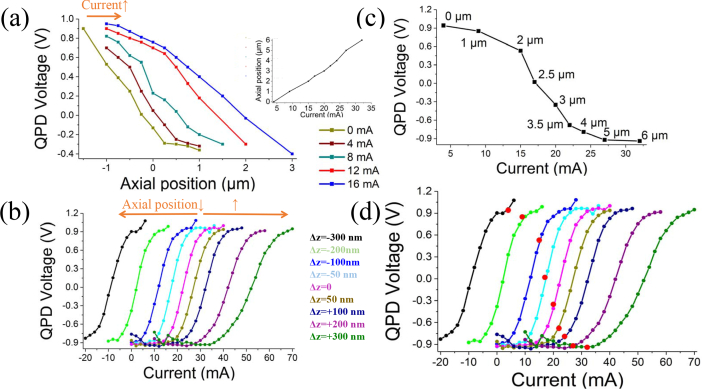
The operation of the autofocus system requires the regulation of the difference between a set-point value and the measured QPD voltage. To convert the difference between the measured QPD voltage and the set-point into a focal change of the ETL, the system requires a calibration curve. However, both physical axial position and current changes (physical lens deformations) give rise to a QPD voltage change. The separate effect of these two factors (QPD vs displacement) and (QPD vs current) is illustrated in Figs. 2(a) and 2(b). Figure 2(a) displays how the QPD voltage changes with the axial displacement for different current values. The inlay in Fig. 2(a) shows the relationship between the axial position and current. Figure 2(b) illustrates a family of curves of QPD values as a function of the current for distinct displacements. For each physical z-displacement, in steps of 50 nm–100 nm, a QPD voltage vs current curve was collected.
Fig. 2.
Acquisition of calibration curves. a) QPD voltage in dependence of axial position for constant input currents to the lens. Inlay: Axial position vs ETL current. b) QPD voltage vs the ETL input current. The orange arrows indicate how the different QPD(V) vs current curves in the family relate to changes of the physical axial position of the sample relative to the objective. They shift to the right for increasing objective to sample separation, and move to the left upon reduction of this separation. c) QPD vs current at each in-focus position. d) Same as b. The red dots represent the in-focus points of each curve, i.e. the value for which the autofocus corrects.
A specific requirement of our implementation is that the set-point prediction must take into account also the changes in QPD voltage which arise whenever a new current is applied to the lens. As Fig. 2(c) illustrates, the QPD voltage has a quasi-linear dependence on the applied current, within a specific current range (in this example 15–24 mA). All together this allows adjusting the set-point value for the QPD both as a function of the displacement and of the instant current applied to the lens.
Figure 2d highlights the current and displacement values for which the sample is in focus (red circular markers). It also indicates that QPD values for physical displacements of less than 750–1000 nm shift linearly as a function of the applied current necessary to bring the sample back into focus. This suggests that it is possible to use a feedback loop with set-point ramping, i.e. where the set-point (QPD target voltage associated to focus) changes linearly as a function of the applied current. The focal position was determined, for each displacement and current value, by bringing individual beads into focus. The parameters of the PID can be adjusted appropriately in the software to achieve the desired response of the feedback loop. The slope of the linear portion of the in-focus curve (V/mA) is used to determine the rate of QPD set-point ramping as a function of the applied current.
3.2. Principle of operation of the autofocus
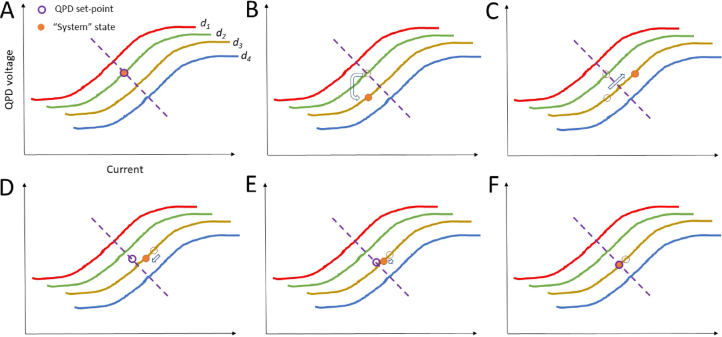
Figure 3 illustrates the working principle of the autofocus system starting from where the QPD set-point voltage and the system state are in agreement at the in-focus point (Panel A). Panel B shows a physical displacement or a drift of the system state whereas the QPD set-point voltage remains the same. Therefore, by increasing the current, the system state shifts back to the set-point (Panel C). However, because of the physical displacement, the sample is not in focus anymore, represented now by the intersection between the dashed line (purple) and the new system displacement curve (gold).
Fig. 3.
Explanation of the working principle of the autofocus. d1 to d4 are distinct axial distances, indicating a family of QPD(V) vs current curves. Panels show how the state of the system (QPD(V), current) changes in response to an axial displacement from an in-focus condition d2 (Panel A) to a position d3. Panel (C) illustrates how, in order to bring back the QPD(V) to its original set-point, a current is applied. In Panel (D) the adaptive set-point changes along the in-focus dashed curve, while the system state moves along the d3 QPD(V)-current curve trying to reach the new set-point. The process iterates in small steps (Panel E) until the sample reaches again the in-focus condition where the set-point and system states overlap (Panel F).
The new set-point moves along the in-focus curve (here symbolized through the dashed line). The current now reduces, as it tries to match the new QPD set-point. This process it iterated (Panels D and E) until the new QPD set-point and the new system state match at the in-focus position (Panel F). The slow rate of ramping of the set-point relative to the current changes can be achieved by working with a moving average of the current applied to the lens.
3.3. Imaging with the autofocus
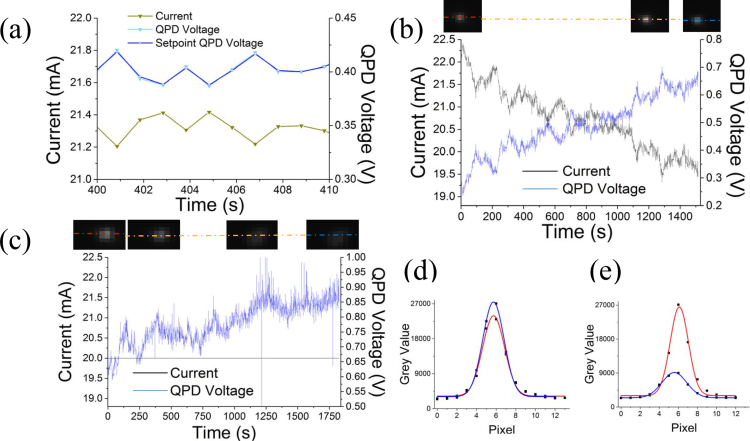
After storing the calibration information, fluorescent beads immobilized on a glass coverslip were imaged to demonstrate the actual performance of the autofocus. Figure 4(a) shows how the current applied to the lens changes (left axis) in order to allow the QPD voltage to follow the QPD set-point voltage (right axis) when the feedback is enabled. In Fig. 4(b), the top shows images of one bead taken at fixed time intervals over 25 minutes. Figure 4(b) bottom shows traces of the QPD voltage and the ETL current as a function of time: the traces illustrate the readjustment that the feedback performs as result of the focal drift.
Fig. 4.
Autofocus system. a) Magnified time course showing the QPD voltage following the QPD set-point voltage. It also shows the input current trace for the lens. b) Images of a bead which is held in focus over time. The lines indicate where the profiles shown in d were collected. Color code corresponds to colors in d. Below: traces of the QPD voltage and input current for the lens with enabled autofocus. c) Represents the same as in b without autofocusing. The images show a loss of focus over time (top). The current is held constant and the QPD voltage is changing as a result of the focal drift. d) Fitting of the bead profiles in b, taken at the beginning and at the end of imaging series. e) Fitting of the bead profiles in c, taken at the beginning and at the end of imaging series.
Figure 4(c) shows a fluorescent bead over a time series of 30 min with disabled feedback. The input current to the lens is constant, while the QPD voltage drifts as a function of mechanical defocus alone. The images of the bead in Fig. 4(c) top show that the microscope loses focus over time. The QPD voltage drifts upwards as the objective displaces from its location. This is quantitatively illustrated in Figs. 4(d) and 4(e), where the line-profiles across the beads with and without enabled feedback are respectively illustrated. The standard deviation of a fitting gaussian curve (as the best approximation to the microscope Point Spread Function) can be used as a quantitative estimate of the focus. We compared the width at time 0 to the width after 25 min with enabled autofocus and 30 min with disabled autofocus. The deviation from the starting width with disabled feedback was 30% whereas the deviation from the starting width with enabled autofocus feedback was 3%, confirming the autofocusing performance of our setup.
Since our system displays a small degree of intrinsic astigmatism, probably due to a minor mechanical misalignment between the ETL and the microscope objective, we quantified the astigmatism of the beads images over time as an additional approach to quantify the defocus. Astigmatism is a well known indicator of axial displacement [13]. Astigmatism was quantified by the cross-correlation coefficient of a two-dimensional Gaussian fit. Cross-correlation vs defocus was calibrated, displaying a linear behavior within a ±1 μm excursion from the focal position, with a coefficient of −0.34 cross-correlation/micrometer. According to this calibration, bead samples observed for 30 minutes with autofocus enabled displayed axial fluctuations below 10 nm, as opposed to defocus values in excess of 50 nm when no autofocus was engaged. To further characterize the performance of the all-optical autofocus, we manually changed the distance between the objective and the sample rapidly, in order to test the ability of the setup to regain focus in response to a sudden perturbation.
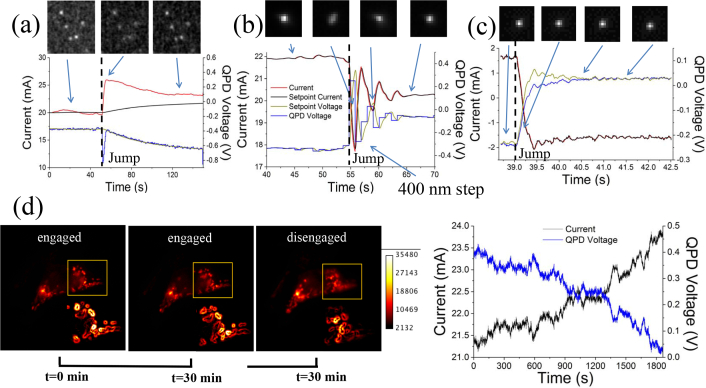
Figures 5(a) and 5(b) show two extreme cases of response of the system to a displacement of the objective of the order of 400–500 nm, when using different constants for the PID. Figure 5(a) shows the response when only a proportional term is used in the PID, and a moving average of the current is used to ramp the set-point. The response shows that the current as well as the QPD voltage converge towards a new in-focus point. Because of the averaging of the current this happens with a long time constant. This process is an experimental embodiment of what is illustrated in Fig. 3. The feedback circuit used to generate the traces displayed in Fig. 5(b) on the other hand uses in addition to the proportional term also an integral term. The moving average of the set-point is significantly reduced in this case. The response to the step is more rapid, including characteristic oscillations as the QPD value converges to the new in-focus value. If the PID parameters are optimized, the system response improves in speed and stability: Fig. 5(c) illustrates the rapid (< 1s) convergence to focus of the system, without sizable oscillations, in response to a 500 nm jump. In this case the PID parameters were set as follows: proportional constant 0.25, integral constant 0.2 and differential constant 0.01. All Figs. 5(a)–5(c) top display the images of the beads before, during and after the jumps. A certain degree of astigmatism of the lens during the jump can be seen in Fig. 5(b). Figure 5(d) shows images of a HEK AD cell labeled with a mitochondria targeted dye, imaged over 30 minutes with enabled autofocus. The left image shows the cell at the beginning of the time series whereas the image in the middle represents the cell after 30 min with enabled autofocus. The rightmost image shows the cell after further 30 minutes with disabled autofocus. The right panel shows how the QPD voltage and the current applied to the lens change as the sample is maintained in focus, thus confirming the viability of the current setup for live-cell imaging applications. We performed edge detection of a region of interest to provide a more quantitative assessment of the degree of sample defocus. In this case, the amplitude of the gradient image is directly proportional to the steepness of the edges.
Fig. 5.
Traces and images of enabled autofocus. a) Top images show fluorescent beads before and after the jump. Below: Traces for the QPD voltage and the current for a low proportional PID value and a moving average of the current used to adjust the set-point. Current and QPD voltage recover slowly after manual displacement of objective of about 500 nm. b) Same as in a, with a proportional term and without the moving average. Graphs show a faster focus recovery. c) Same as in a and b, with optimized PID parameters allowing a faster convergence of the QPD to its set-point (proportional constant 0.25, integral constant 0.2 and differential constant 0.01). d) Hek293AD cells displaying labeled mitochondria, imaged over 30 minutes with enabled autofocus (left and middle), and then for another 30 minutes with disabled autofocus (right). Insets show edge detection in a sub-region of the cell, emphasizing the effect of defocus in the right image. On the right: traces of the current and QPD voltage over time as the cell is maintained in focus.
4. Conclusion
Here, we proposed an original autofocus system which uses an ETL as a means to rapidly alter the position of the focal plane using a reflected IR laser beam as a precise axial position sensor. Our optical assembly fits most commercial microscopes, and is fast and cost-effective compared to autofocus devices based on piezoelectric actuators moving either the objective or the sample.
While total internal reflection is not a strictly necessary feature of the proposed autofocus device, it is advantageous: it allows most of the energy of the IR monitoring beam to be reflected on the sensor (QPD in this case), maximising the signal to noise ratio in the estimate of the objective-to-sample distance. We demonstrate that with enabled feedback the system can compensate rapid changes of the focal position or can maintain a sample in focus over a period of 25–30 min with a minimal focal loss as compared to the case when no feedback is used. Tunable lenses are not aberration free, and are expected to degrade the quality of the image produced by the microscope objective. A thorough characterisation of the aberrations produced by ETLs has been performed by Fuh et al. [14]. The manufacturer discusses only coma as a possible geometry induced aberration in their lenses [12]. In our hands, the dominant aberration observed was astigmatism, as it can be seen in 5(b). This is likely due to a slight mechanical offset between the lens and objective axis, which can be corrected in due course. In the current application, a small degree of astigmatism was useful as it helped to identify more clearly defocus in our bead test samples. More generally, since ETL technology has shown a rapid improvement over the last few years, it is likely that improvements in aberration correction will soon become available.
Acknowledgments
We thank Optotune AG for providing materials and the STEP file. We thank Mr. Roland Wartha (University of Wuerzburg) for his help in building mechanic parts and the electric circuit.
Funding
Deutsche Forschungsgemeinschaft (SFB 688); NIH (Prime Grant No. 5 R01 DA038882-02); University of Wuerzburg.
References and links
- 1.Stephens D. J., Allan V. J., “Light Microscopy Techniques for live cell imaging,” Science 300(5616), 82–87 (2003). 10.1126/science.1082160 [DOI] [PubMed] [Google Scholar]
- 2.Price J. H., Gough D. A., “Comparison of Phase-Contrast and Fluorescence Digital Autofocus for Scanning Microscopy,” Cytometry 16 283–284 (1994). 10.1002/cyto.990160402 [DOI] [PubMed] [Google Scholar]
- 3.Li S., Cui X., Huang W., “High resolution autofocus for spatial temporal biomedical research,” Rev Sci Instrum 84(11), 114302 (2013). 10.1063/1.4829616 [DOI] [PubMed] [Google Scholar]
- 4.Yazdanfar S., Kenny K. B., Tasimi K., Corwin A. D., Dixon E. L., Filkins R. J., “Simple and robust image-based autofocusing for digital microscopy,” Opt. Express 16(12), 8670–8677 (2008). 10.1364/OE.16.008670 [DOI] [PubMed] [Google Scholar]
- 5.Liron Y., Paran Y., Zatorsky N. G., Geiger B., Kam. Z., “Laser autofocusing system for high-resolution cell biological imaging,” Journal of Microscopy 221(2), 145–151 (2006). 10.1111/j.1365-2818.2006.01550.x [DOI] [PubMed] [Google Scholar]
- 6.Pertsinidis A., Zhang Y., Chu. S., “Subnanometre single-molecule localization, registration and distance measurement,” Nature 466, 647–653 (2010). 10.1038/nature09163 [DOI] [PubMed] [Google Scholar]
- 7.Blum M., Bueeler M., Graetzel C., Aschwanden M., “Compact optical design solutions using focus tunable lenses,” Proc. SPIE 8167, 81670W (2011). 10.1117/12.897608 [DOI] [Google Scholar]
- 8.Grewe B. F., Voigt F. F., van’t Hoff M., Helmchen F., “Fast two-layer two-photon imaging of neuronal cell populations using an electrically tunable lens,” Biomed. Opt. Express 8167, 2035–2046 (2011). 10.1364/BOE.2.002035 [DOI] [PMC free article] [PubMed] [Google Scholar]
- 9.Piazza S., Bianchini P., Sheppard C., Diaspro A., Duocastella M., “Enhanced volumetric imaging in 2-photon microscopy via acoustic lens beam shaping,” J. Biophotonics 10, e201700050 (2017). 10.1002/jbio.201700050 [DOI] [PubMed] [Google Scholar]
- 10.Annibale P., Dvornikov A., Gratton. E., “Electrically tunable lens speeds up 3d orbital tracking,” Biomed Opt Express 6(6), 2181–2190 (2015). 10.1364/BOE.6.002181 [DOI] [PMC free article] [PubMed] [Google Scholar]
- 11.Wang Z., Lei M., Yao B., Cai Y., Liang Y., Yang Y., Yang X., Li H., Xiong. D., “Compact multi-band fluorescent microscope with an electrically tunable lens for autofocusing,” Biomed Opt Express 6(11), 4353–4364 (2015). 10.1364/BOE.6.004353 [DOI] [PMC free article] [PubMed] [Google Scholar]
- 12.Optotune Data Sheet , “http://www.optotune.com/products/focus-tunable-lenses,” Optotune; (2017) [Google Scholar]
- 13.Xu J., Therani K.F., Steinberg. P., “Multicolor 3D Super-resolution Imaging by Quantum Dot Stochastic Optical Reconstruction Microscopy,” August 30 2011. ACS Nano 9, 2917–2925 (2015). 10.1021/nn506952g [DOI] [PubMed] [Google Scholar]
- 14.Fuh L., Chen J. K., Chen. P. W., “Characterization of electrically tunable liquid lens and adaptive optics for aberration correction,” Optika 126(24), 5456–5459 (2015). 10.1016/j.ijleo.2015.09.105 [DOI] [Google Scholar]


