

Abstract
Overexpression of the HAL1 gene in yeast has a positive effect on salt tolerance by maintaining a high internal K+ concentration and decreasing intracellular Na+ during salt stress. In the present work, the yeast gene HAL1 was introduced into tomato (Lycopersicon esculentum Mill.) by Agrobacterium tumefaciens-mediated transformation. A sample of primary transformants was self-pollinated, and progeny from both transformed and non-transformed plants (controls) were evaluated for salt tolerance in vitro and in vivo. Results from different tests indicated a higher level of salt tolerance in the progeny of two different transgenic plants bearing four copies or one copy of the HAL1 gene. In addition, measurement of the intracellular K+ to Na+ ratios showed that transgenic lines were able to retain more K+ than the control under salt stress. Although plants and yeast cannot be compared in an absolute sense, these results indicate that the mechanism controlling the positive effect of the HAL1 gene on salt tolerance may be similar in transgenic plants and yeast.
The productivity of crops is greatly affected by salt stress. The progressive salinization of soil, estimated at around 20% of irrigated land (Ghassemi et al., 1995), has made the genetic improvement of salt tolerance an urgent priority for the future of agriculture. In spite of extensive research, few salt-tolerant cultivars have been developed. To date, the development of salt-tolerant plants has been hampered by the difficulty in the genetic dissection of this multigenic trait (see Bohnert et al., 1996) and by the lack of knowledge about the physiological processes that limit growth under salt-stress conditions.
On the basis of what is known about the mechanisms involved in adapting to both osmotic and ionic stress in halotolerant plants, several targets have been proposed to improve salt tolerance in sensitive plants. Targets involve the overproduction of osmolytes to balance osmotic adjustment and/or osmoprotection of cellular components, modification of processes involved in radical scavenging, protection of sensitive cellular activities to turgidity loss and dehydration, and modification of transport systems of Na+ and Cl− in the vacuolar and plasma membranes (Serrano and Gaxiola, 1994; Bohnert et al., 1996). Interestingly, in the last few years significant advances have been made in the identification and isolation of several genes that could potentially be involved in the processes of salt tolerance. It is difficult to imagine that the expression of a single gene in transgenic plants could promote a dramatic enhancement in salt tolerance, leading directly to a new salt-tolerant cultivar. However, the genetic manipulation of crop species with individual transgenes could lead to a slight improvement in tolerance level, which would be sufficient from a breeding point of view. Moreover, the genetic modification of plants with single transgenes is perhaps the best tool at our disposal for the genetic dissection of this complex trait (i.e. by allowing identification of the target genes involved in the process of salt tolerance). Thus, some transgenes, related mainly to the synthesis of osmolytes, have been introduced in tobacco (Tarczynski et al., 1993; Vernon et al., 1993; Kavi Kishor et al., 1995; Lilius et al., 1996; Romero et al., 1997) and Arabidopsis (Hayashi et al., 1997). In addition to the experiments on model species, Xu et al. (1996) reported the expression of a LEA gene in transgenic rice plants, and McKersie et al. (1996) communicated the expression of a Mn-SOD gene in transgenic oat plants. In general, the expression of those transgenes seemed to confer a low tolerance level to osmotic (water deficit) and/or salt (NaCl) stress.
Another interesting alternative might be the introduction of genes that modulate cation transport systems. These genes have been identified in yeast. Overexpression of two genes of Saccharomyces cerevisiae, HAL1 and HAL3, which are involved in the regulation of K+ and Na+ transport, respectively, considerably enhanced salt tolerance in yeast (Serrano and Gaxiola 1994; Serrano, 1996). In addition, shoot apex from transgenic melon plants expressing the HAL1 gene showed a certain level of salt tolerance in vitro (Bordás et al., 1997). More recently, Pardo et al. (1998) reported the production of transgenic tobacco plants with enhanced salt tolerance by the co-expression of a truncated form of the catalytic subunit and the regulatory subunit of yeast calcineurin, a Ca2+-activated protein phosphatase that modulates Na+ and K+ transport in yeast. We report the introduction of the yeast HAL1 gene (using a modified plasmid with enhancer elements) in tomato (Lycopersicon esculentum) and on the evaluation of salt tolerance in progenies from transgenic plants. We have assayed different tests in vitro to select those that discriminate better between salt-sensitive and salt-tolerant plants. Growth and physiological responses were also studied in both transgenic and untransformed plants under stressed and non-stressed conditions. In addition, we have traced back the increased salt tolerance of several transgenic lines to alterations in Na+ and K+ homeostasis and in water content.
RESULTS
Genetic Transformation and Molecular Characterization of the Regenerated Plants
Cotyledon explants of the tomato cv P-73 were infected with Agrobacterium tumefaciens carrying the HAL1 and the nptII genes in the vector plasmid pPM7. Twenty organogenic calli were selected on kanamycin-containing medium, and a total of 23 plants (TG1) were obtained. PCR analysis of 20 plants from independent calli revealed the presence of both genes in 14 plants and the absence of these genes in four of the plants (escapes); plant TG1-15 was positive for HAL1 and negative for nptII, while the opposite was observed in plant TG1-17 (Fig. 1).
Figure 1.
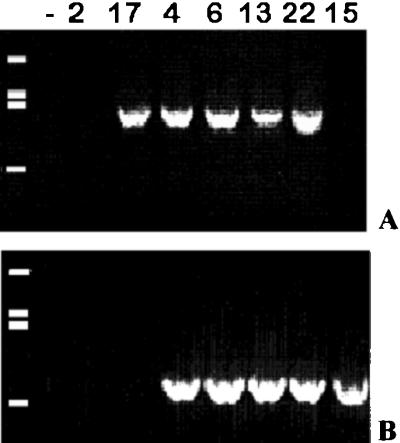
PCR products from DNA from leaves of putative transgenic plants (TG1) of the tomato cv P-73 (genotypes 2, 17, 4, 6, 13, 22, and 15). A, Amplification of a nptII fragment (781 bp). B, Fragment of 888 bp amplified using HAL1 primers. Molecular size standards were 1.9 (top), 1.1, 0.9, and 0.4 kb.
Six PCR (+) plants regenerated from independent calli and a PCR (−) plant used as a control were chosen and analyzed by Southern and northern hybridization. Southern analysis showed integration of different numbers of copies. Thus, two plants appeared to have integrated a single copy of the HAL1 gene (TG1-6 and TG1-20); three plants (TG1-13, TG1-10, and TG1-22) showed two fragments corresponding to two copies; and genotype number 4 (TG1-4) presented four integrated HAL1 copies (Fig. 2A). Northern analysis for the HAL1 gene revealed the presence of mRNA in all transgenic plants assayed (Fig. 2B).
Figure 2.

Southern (A) and northern (B) analysis of the HAL1 gene in six PCR(+) and one PCR(−) tomato plants regenerated after transformation. PCR(+) plants: TG1-4, TG1-6, TG1-13, TG1-10, TG1-22, and TG1-20. PCR(−) plant: TG1-7. In the gel blot, some smearing due to truncated or degraded messages is apparent below the major band at about 1 kb. The arrow on the left marks the position of the HAL1 mRNA. C, Northern analysis of TG2-6 and TG3-4 plants to confirm expression in progeny of primary transformants 4 and 6 used for the physiological experiments.
Reproduction and Segregation Pattern
After molecular characterization, progeny (TG2 and TG3) from a sample of primary transformants (TG1) were obtained and their seeds used in further experiments. The expression of the HAL1 transgene could be detected in these plants (Fig. 2C).
Inheritance of the transgenes was studied in TG2-4 and TG2-6 by testing the ability of cotyledon explants to grow on media with kanamycin. These progeny were chosen because of the different number of copies of the transgene in the TG1 plants and the availability of seeds. In selective conditions (50 μg mL−1 of the antibiotic), explants from the cv P-73 control line were unable to grow, while those derived from the transgenic progeny (TG1-6 and TG1-4) developed calli in the proportion of three tolerant to one sensitive (χ2 value = 0.007; P = 0.95) and 15 tolerant to one sensitive (χ2 value = 0.014; P = 0.90), respectively.
Evaluation for Salt Tolerance
Three different tests were carried out to evaluate the level of salt tolerance in vitro in the TG2-4 population. In these assays, different sources of explants and NaCl concentrations were studied. In the shoot apex test, plant growth was evaluated by measuring rooting capacity, shoot height, number of leaves, and total fresh (FW) and dry (DW) weight of plants after 28 d on culture media with or without NaCl.
Although all NaCl concentrations significantly reduced shoot growth, rooting capability only decreased at 175 mm. At this concentration, the TG2-4 progeny showed higher salt tolerance with 67% of rooted shoots (Table I). In relation to the shoot length and leaf number, no or only slight differences between lines were found. In contrast, irrespective of the level of salt applied (125 or 175 mm), both the FW and DW were significantly higher for shoots from the TG2-4 population. Thus, the extent of the FW reduction was 60% for the control and 37% for the transgenic line at 125 mm NaCl.
Table I.
Effect of salt stress on shoot growth after 28 d of culture on B1 medium supplemented with NaCl
| Line | NaCl | Rooting | Shoot Length | No. of Leaves | Shoot FW | Shoot DW |
|---|---|---|---|---|---|---|
| mm | % | cm | g | |||
| Control | 0 | 100.0 a | 6.13 ± 0.18 a | 6.40 ± 0.19 a | 0.95 ± 0.02 a | 0.07 ± 0.00 a |
| 125 | 95.8 a | 2.81 ± 0.09 a | 3.13 ± 0.15 b | 0.38 ± 0.03 d | 0.03 ± 0.00 d | |
| (−54) | (−51) | (−60) | (−57) | |||
| 175 | 12.5 c | 1.61 ± 0.09 a | 0.91 ± 0.16 d | 0.10 ± 0.02 f | 0.01 ± 0.00 f | |
| (−74) | (−86) | (−89) | (−85) | |||
| TG2-4 | 0 | 100.0 a | 6.51 ± 0.11 a | 6.37 ± 0.14 a | 0.75 ± 0.02 b | 0.06 ± 0.00 b |
| 125 | 95.8 a | 3.06 ± 0.08 a | 3.17 ± 0.12 b | 0.47 ± 0.02 c | 0.04 ± 0.00 c | |
| (−53) | (−50) | (−37) | (−33) | |||
| 175 | 66.6 b | 1.88 ± 0.01 a | 1.91 ± 0.16 c | 0.17 ± 0.02 e | 0.02 ± 0.00 e | |
| (−71) | (−70) | (−77) | (−66) | |||
Lines evaluated: control (cv P-73) and the progeny of transgenic plant 4 (TG2-4). For each line and treatment, values are given as the means of 24 plants ± se. The percentage change in each parameter in media with NaCl, calculated as [(M/m) − 1] × 100, is shown in parentheses, where M and m are the values of the considered parameter in media with and without NaCl, respectively. Means within each column followed by different letters are significantly different according to the LSD test (P ≤ 0.05).
At the cellular level (callus growth), differences between transgenic and control plants were more evident. In the hypocotyl assay, differences in callus growth between hypocotyls of type-1 and type-2 were obtained (Table II). However, regardless of the explant type, significant differences between lines were observed at 125 mm. Thus, at this concentration, the FW of callus derived from the transgenic population increased (+22%, type-1 explants) or was slightly inhibited (−1.5%, type-2 explants), while those from the control suffered dramatic growth inhibition in saline conditions (−31% and −39% for type-1 and type-2 explants, respectively). DW data corroborated this behavior (Table II).
Table II.
Effect of salt stress on hypocotyl growth after 28 d of culture in NB2020 medium supplemented with NaCl
| Line | NaCl (mm) | FW
|
DW
|
||
|---|---|---|---|---|---|
| 1 | 2 | 1 | 2 | ||
| g | |||||
| Control | 0 | 0.340 ± 0.076 c | 0.473 ± 0.067 b | 0.028 ± 0.005 c | 0.038 ± 0.004 c |
| 125 | 0.234 ± 0.025 d | 0.290 ± 0.031 c | 0.024 ± 0.002 d | 0.031 ± 0.002 d | |
| (−31) | (−39) | (−14) | (−18) | ||
| 175 | 0.124 ± 0.016 e | 0.093 ± 0.009 d | 0.015 ± 0.001 e | 0.011 ± 0.001 e | |
| (−64) | (−80) | (−46) | (−71) | ||
| TG2-4 | 0 | 0.391 ± 0.049 b | 0.540 ± 0.057 a | 0.031 ± 0.003 b | 0.043 ± 0.004 b |
| 125 | 0.478 ± 0.035 a | 0.532 ± 0.062 a | 0.045 ± 0.002 a | 0.050 ± 0.004 a | |
| (+22) | (−1.5) | (+45) | (+16) | ||
| 175 | 0.139 ± 0.012 e | 0.098 ± 0.009 d | 0.017 ± 0.001 e | 0.012 ± 0.001 e | |
| (−64) | (−82) | (−45) | (−72) | ||
1, Explants type-1 (nearest to the apex); 2, explants type-2 (lower). Lines evaluated: control (cv P-73) and TG2-4. For each line and treatment, values are given as the mean of 24 plants ± se and the percentage change (in parentheses) is calculated as [(M/m) − 1] × 100, where M and m are the values of the considered parameter in media with and without NaCl, respectively. Means within each column followed by different letters are significantly different according to the LSD test (P ≤ 0.05).
When the growth of inoculates from root calli on media containing NaCl was measured (root callus test), the positive correlation between salt tolerance and the transgenic line was prominent. As shown in Table III, at 125 mm NaCl, the DW of transgenic calli increased (+13%), whereas a reduction (−39%) was observed in the control line. In addition, at 175 mm NaCl, the weight of calli from the transgenic population did not differ significantly from that in non-salt conditions, while the growth of the control calli was strongly inhibited (−45%).
Table III.
Effect of salt stress on the growth of inoculates from root calli after 28 d of culture in NB2020 medium supplemented with NaCl
| Line | NaCl | Inoculate Wt | FW | DW |
|---|---|---|---|---|
| mm | g | |||
| Control | 0 | 0.119 ± 0.005 a | 1.839 ± 0.161 a | 0.104 ± 0.007 b |
| 125 | 0.120 ± 0.005 a | 0.603 ± 0.057 cd | 0.063 ± 0.005 c | |
| (−67) | (−39) | |||
| 175 | 0.117 ± 0.041 a | 0.509 ± 0.074 d | 0.057 ± 0.067 d | |
| (−72) | (−45) | |||
| TG2-4 | 0 | 0.118 ± 0.005 a | 1.691 ± 0.160 a | 0.102 ± 0.008 b |
| 125 | 0.118 ± 0.005 a | 1.242 ± 0.123 b | 0.115 ± 0.018 a | |
| (−27) | (+13) | |||
| 175 | 0.110 ± 0.006 a | 0.771 ± 0.096 c | 0.101 ± 0.021 b | |
| (−54) | (−1) | |||
Lines evaluated: control (cv P-73) and progeny of transgenic plant 4 (TG2-4). For each line and treatment, values are given as the mean of 30 calli ± se. The percentage change, given in parentheses, is calculated as [(M/m) − 1] × 100, where M and m are the values of the considered parameter in media with and without NaCl, respectively. The means within each column followed by different letters are significantly different according to the LSD test (P ≤ 0.05).
A preliminary evaluation in vivo under controlled conditions was also performed. At moderate salt concentrations (75 mm), a similar response to salinity in the original line (cv P-73) and in the transgenic families was found (data not shown). However, at higher salt concentrations (150 mm NaCl), total DW (relative growth) was not significantly reduced (+3%) by salinity in the transgenic population TRG2-4, whereas a growth reduction (−52%) was observed in the control (Table IV). These results agree with those observed in vitro (Tables I–III). In non-stressed conditions, the TG2-4 line showed slower growth than the control both on a FW and a DW basis (Table IV).
Table IV.
Effect of salt stress on the growth of plants after 20 d of culture in a hydroponic system
| Line | NaCl | Shoot Length | No. of Leaves | Shoot FW | Shoot DW |
|---|---|---|---|---|---|
| mm | cm | g | |||
| Control | 0 | 28.75 ± 3.25 a | 8.25 ± 0.47 a | 10.17 ± 2.20 a | 1.40 ± 0.30 a |
| 150 | 17.33 ± 0.71 a | 5.75 ± 0.25 a | 4.70 ± 0.43 b | 0.67 ± 0.04 b | |
| (−40) | (−30) | (−54) | (−52) | ||
| TG2-4 | 0 | 22.80 ± 1.26 a | 7.75 ± 0.47 a | 5.67 ± 0.62 ab | 0.70 ± 0.07 b |
| 150 | 20.22 ± 1.16 a | 6.25 ± 0.31 a | 5.39 ± 0.60 ab | 0.72 ± 0.07 b | |
| (−11) | (−19) | (−5) | (+3) | ||
Lines evaluated: control (cv P-73) and progeny of transgenic plant 4 (TG2-4). For each line and treatment, values are given as the means of eight plants ± se. The percentage change in media with NaCl, calculated as [(M/m) − 1] × 100, shown in parentheses, where M and m are the values of the considered parameter in media with and without NaCl, respectively. Means within each column followed by different letters are significantly different according to the LSD test (P ≤ 0.05).
Results obtained with the above-mentioned test indicated a higher level of salt tolerance in the progeny TG2-4 than in the control. In order to corroborate the effect of the HAL1 gene on salt tolerance, a new experiment including TG2-4 and the progeny of another transgenic plant (TG2-6) was performed. The hypocotyl-derived callus test was used and, as expected, growth of calli (both FW and DW) from the transgenic lines was higher on NaCl-supplemented medium. In contrast, growth from the hypocotyls of the untransformed line was seriously impaired by 125 mm salt (−31% and −33% growth inhibition for FW and DW, respectively; Fig. 3).
Figure 3.

Growth of hypocotyl explants (type-1) after 28 d of culture in NB2020 medium (as described in “Materials and Methods”) supplemented with either 0 or 125 mm NaCl (white and black bars, respectively). Lines evaluated: control (cv P-73) and transgenic progenies (TG2-4 and TG2-6). Each bar corresponds to the mean value calculated from 24 explants of three different lines. Different letters are significantly different according to the LSD test (P ≤ 0.05).
In Vivo Physiological Response
Three transgenic progeny (TG2-4, TG3-4-8, and TG3-4-14) and the control (cv P-73) were grown in hydroponic conditions under salt or non-salt conditions. Water content and ion (Na+ and K+) concentrations were measured in roots and leaves after 15 or 30 d of treatment.
After 15 d of treatment, water content per unit DW did not differ under salt or non-salt conditions among lines in leaves, while in roots it decreased in the TG3-4-14 population (Table V). Nevertheless, in this family, the water content increased in roots and leaves after 30 d of treatment. At this time, root water content had also increased significantly in TG3-4-8.
Table V.
Effect of salt stress on the water content (g g−1 DW) in the different parts of the control and the transgenic families after 15 and 30 d of salt treatment
| Line | NaCl mm | 15 d
|
30 d
|
|||
|---|---|---|---|---|---|---|
| Root | Leaf | Root | Young leaf | Adult leaf | ||
| mm | g g−1 dry wt | |||||
| P-73 | 0 | 23.6 b | 13.9 a | 24.8 cde | 8.9 b | 14.3 b |
| 75 | 24.7 b | 13.1 a | 25.8 bcd | 8.5 b | 14.8 b | |
| TG2-4 | 0 | 25.4 b | 14.6 a | 31.6 a | 8.3 b | 14.8 b |
| 75 | 27.1 ab | 13.6 a | 28.6 ab | 8.0 b | 14.8 b | |
| TG3-4-14 | 0 | 29.8 a | 13.5 a | 23.5 de | 8.8 b | 13.0 b |
| 75 | 24.1 b | 13.6 a | 27.0 bc | 10.3 a | 17.6 a | |
| TG3-4-8 | 0 | 25.0 b | 13.4 a | 16.9 f | 8.4 b | 14.1 b |
| 75 | 26.4 ab | 15.1 a | 22.7 e | 8.5 b | 14.9 b | |
Means within each column followed by different letters are significantly different according to the LSD test (P ≤ 0.05).
In non-stressed conditions, Na+ concentrations were very similar in roots and leaves of the different lines (2.2–2.6 mm). On the other hand, the K+ concentrations of the different lines in these conditions were more variable (90–130 mm in roots and 120–150 mm in leaves). Therefore, to accurately compare variation in ion concentration between lines, the relative ion content was calculated (Fig. 4). After 15 d, the K+ decrease induced by salinity in both leaves and roots was significantly less in the transgenic lines than in the control, especially in roots (Fig. 4A). In contrast, Na+ accumulation was higher in the control than the transgenic lines in both roots and leaves (Fig. 4B). The relative K+ to Na+ ratio, which was higher in the transgenic families, indicated higher K+ retention under saline conditions (Fig. 4C). In plants harvested after 30 d of salt treatment, the results were qualitatively similar to those obtained after 15 d.
Figure 4.

Relative K+ and Na+ concentrations and K+ to Na+ ratio in roots and leaves of the salt-treated plants (with respect to untreated plants) of the control (cv P-73) and transgenic (TG2-4, TG3-4-14, and TG3-4-8) lines after 15 d of 75 mm NaCl treatment. Vertical lines represent ± se. In each plant part, mean values followed by different letters are significantly different according to the LSD test (P ≤ 0.05).
DISCUSSION
In the present study, transgenic tomato plants expressing the HAL1 gene from Saccharomyces cerevisiae were obtained, and TG2-4 and TG2-6 progeny were evaluated first for segregation pattern and then for salt tolerance. The segregation in the progeny TG2-6 was in accordance with a single insertion, as shown by the Southern hybridization for the TG1-6 plant (Fig. 3B). The TG1-4 plant, bearing four copies of the HAL1 gene, showed a segregation pattern that corresponded to two inserted copies. This discrepancy could result from two copies being inserted in two different chromosomes, or from the lack of expression of two inserted copies due to gene silencing, partial integration, or integration at a low expression region of the genome (e.g. heterochromatin). In fact, the inactivation of transgenes is common, particularly when several copies have been integrated (Jones et al., 1985).
In vitro tests were performed for the evaluation of salt tolerance, and differences between the TG2-4 transgenic line and the control were detected. In the in vitro shoot apex test, root inhibition was less pronounced in the transgenic population than in the control. Cano et al. (1998) suggested that rooting parameters are the most useful traits to use for salt tolerance evaluation in tomato when an in vitro shoot apex test is used, which agrees with our results. When evaluating salt tolerance at a cellular level (hypocotyl test), the relative growth (DW) of the transgenic line was higher in medium with 125 mm NaCl than in the same medium without salt. Similar results were obtained using another callus growth assay (root callus test). The increment of DW in medium with NaCl was also observed in calli derived from leaf explants of Lycopersicon pennellii, a species described as salt tolerant (Dehan and Tal, 1978; Tal and Shannon, 1983; Taleisnik, 1987; Saranga et al., 1991), while in the same conditions callus growth from L. esculentum explants decreased (Pérez-Alfocea et al., 1994). Additional experiments performed with another transgenic population (TG2-6) again indicated a higher level of salt tolerance with respect to the control. On the basis of the relative growth rate of leaf-derived calli, Rus (1998) also found greater salt tolerance in these two transgenic populations than in the control line (cv P-73). All these results obtained in vitro showed a positive effect of the HAL1 gene in the transgenic lines.
In the experiments carried out in vivo, a degree of salt tolerance was observed in transgenic lines only at the upper level of salt stress (150 mm). In tomato, plant growth response to salinity can vary with the degree of salt stress and the duration of treatment (Pérez-Alfocea et al., 1993). According to the two-phase salt response, plant growth is initially inhibited by cellular responses to the osmotic effects and later on by the toxic effect produced by excessive salt accumulation in the plant (Munns, 1993). Similar behavior can be obtained in genotypes with different degrees of salt tolerance when only the osmotic phase of growth inhibition is operative (Neumann, 1997). In our experiments, similar growth reductions were observed in transgenic and control plants at moderate salt levels (75 mm NaCl), while under greater salt stress (150 mm), growth reduction was higher in the control. Although more assays in vivo are needed to reach a clear conclusion, the results obtained at 150 mm NaCl seem to indicate that transgenic tomato plants with the HAL1 gene also show a certain degree of salt tolerance in vivo.
In some experiments in vitro and especially in vivo, the TG2-4 line showed slower growth compared with the non-transformed line for some of the scored variables, which is similar to the results obtained by Karakas et al. (1997) for transgenic tobacco plants expressing the mtlD gene. According to these investigators, differences in plant growth under non-stress conditions were ambiguous. In an absolute sense, DWs of both transgenic and control salt-stressed plants were similar. However, these authors concluded that the transgenic plants had improved salt tolerance, as no reduction in plant growth occurred once NaCl was added. Our results may be interpreted in a similar way.
Changes in the physiological response were shown before we were able to detect any growth differences such as those reported by Bolarín et al. (1995). Thus, after only 15 d under moderate salt conditions (75 mm NaCl), the K+ to Na+ ratio showed a tendency to retain more K+ under saline conditions in the transgenic plants. In comparing Na+ concentrations in roots and leaves, a significantly higher Na+ accumulation was found in roots. Pérez-Alfocea et al. (1993) observed that tomato is able to retain ions in roots and to maintain low Na+ concentrations in leaves at moderate salt levels, at which the ionic effect will be less important than the osmotic one. Larger differences between lines in Na+ accumulation could possibly be observed at higher salt levels. Although we cannot compare in an absolute sense plants and yeast, the tendency to retain more K+ and accumulate less Na+ under saline conditions shown by the transgenic populations was in accordance with the result of overexpressing the HAL1 gene in yeast. Thus, overexpression of this gene in yeast confers a high salt tolerance level by reducing K+ loss and decreasing intracellular Na+ from the cells upon salt stress (Ríos et al., 1997).
When yeast cells are grown under highly saline conditions, uptake via TRK1 (the major K+ uptake system in yeast) becomes more selective for K+ over Na+, and Na+ efflux increases because of the enhanced expression of the Na+ extrusion ATPase ENA1 (Schachtman and Liu, 1999). ENA1 has only been identified in yeast, and it is unclear whether such a mechanism is important in higher plants. In contrast, a homolog of TRK1 has been identified in plants (Schachtman and Liu, 1999). The effect of overexpressing the HAL1 gene in yeast is obviously more drastic than that obtained in plants, but the ability to maintain K+ uptake in the presence of external Na+, as shown by the transgenic families (especially TG3), is noteworthy. This ability has been related to salt tolerance in tomato (Pérez-Alfocea et al., 1993) and in the mutant stl2 of Ceratopteris richardii (Vogelien et al., 1996).
The salt tolerance levels of the two populations of transgenic tomato plants assayed in this work were higher than that previously observed in melon (Bordás et al., 1997). This could be due to the effect of the genetic background of the transgene, but could also be explained by the modified plasmid used in this work, which had a duplicated 35S promoter and the alfalfa mosaic virus RNA leader. It should be noted that in melon, only TG1 transgenic plants were evaluated for salt tolerance using a shoot-apex test in vitro. In the present work, the positive effect of the HAL1 gene in salt tolerance could be detected in progeny at both the plant level (in vitro and in vivo) and the cellular level (calli assays and ion concentrations).
Although more studies are necessary before being able to conclude whether the HAL1 gene will prove useful in generating a cultivar with agronomic inter-est, the results obtained in this study indicate that the expression of HAL1 gene promotes a moderate level of salt tolerance both in vitro and in vivo in transgenic tomato plants.
MATERIALS AND METHODS
Agrobacterium tumefaciens Strain, Plants Transformation, and Culture Conditions
The HAL1 open reading frame (ORF) was subcloned as a Nsi I fragment of 0.9 kb into plasmid pSL301 (Invitrogen, Groningen, The Netherlands), and then excised with NotI and SalI and cloned into the NotI and XhoI sites of plasmid pYES2 (Invitrogen). In this way, the HAL1 ORF could finally be recovered as a BamHI fragment and cloned into the corresponding site of pMOG180. This is a pUC18 derivative containing a 0.8-kb EcoRI-HindIII fragment with the cauliflower mosaic virus 35S promoter with double enhancer, the synthetic alfalfa mosaic virus RNA4 leader sequence (found to increase mRNA stability), a BamHI cloning site, and the A. tumefaciens nopaline synthase (nos) gene transcriptional terminator. This plasmid was a generous gift of Dr. P.J.M. van den Elzen (Mogen International NV, Leiden, The Netherlands). The resulting plasmid pPM5 contained an EcoRI-HindIII fragment of 1.75 kb with the reinforced 35S promoter, the HAL1 ORF, and the nos terminator. This fragment was finally subcloned into the EcoRI and HindIII sites of binary plasmid pBIN19 (Bevan, 1984), resulting in plasmid pPM7. The pPM7 was transformed into A. tumefaciens strain LBA4404 (Hoekema et al., 1983) by the method of Höfgen and Willmitzer (1988).
Tomato (Lycopersicon esculentum cv P-73) cotyledon explants were infected with A. tumefaciens as described by Gisbert (1997). After co-cultivation, explants were transferred to IK2550Z10 selection medium consisting of Murashige and Skoog salts (Murashige and Skoog, 1962), 3% (w/v) Suc, 100 μg mL−1 myo-inositol, 1 μg mL−1 thiamine-HCl, RT vitamins (Staba, 1969), 2.5 μg mL−1 indoleacetic acid (IAA), 5 μg mL−1 kinetin, 1 μg mL−1 zeatin, and 0.8% (w/v) agar containing 100 μg mL−1 kanamycin and 350 μg mL−1 carbenicillin. Twenty days after infection, shoots were individually removed from the callusing explants and transferred to bottles containing 30 mL of B1 medium consisting of Murashige and Skoog salts, 0.1 μg mL−1 IAA, 1% (w/v) Suc, 100 μg mL−1 myo-inositol, and 0.8% (w/v) agar. Cultures were incubated in a growth chamber at 24°C to 26°C, with 16 h of light at 120 μmol m−2 s−1 photon flux density from fluorescent tubes (Grolux, Sylvania, Danvers, MA). Regenerated plantlets were acclimatized in pots (25 cm in diameter) with a mixture of peat and vermiculite (3:1) in a growth incubator at 25°C–27°C with 16 h of light at 71 μmol m−2 s−1 photon flux density and 62% relative humidity and then transferred to the greenhouse. Progenies were obtained from those transgenic plants by selfing in controlled conditions.
Molecular Characterization
DNA Preparation and PCR Analysis
PCR was used to detect specific DNA sequences of the two genes transferred: neomycin phosphotransferase (nptII) and HAL1. DNA from 0.5 to 1 g of plant leaves was prepared by the simplified CTAB (cetyl trimethyl ammonium bromide) method of Doyle and Doyle (1990). Yield was 30 to 60 μg. PCR was performed following the method of Taylor (1991). DNA (0.2 μg) was incubated in a final volume of 50 μL with 0.25 μg of forward and reverse primers, 0.2 mm each of dATP, dGTP, dCTP, and dTTP, and 2 units of thermostable DNA polymerase from Thermus brockianus (Dynazyme, Finnzymes OY, Finland). The reaction consisted of 25 cycles with 30 s at 95°C for denaturation, 30 s at 65°C for annealing, and 60 s at 70°C for extension. The HAL1 primers used have been described in Gaxiola et al. (1992) as amplifying a fragment of 888 bp. The forward and reverse primers for the nptII gene were: 5′-AAGATGGATTGCACGCAGGTTC and 5′-GAAGAACTCGTCAAGAAGGCGA, respectively, amplifying a fragment of 781 bp from position 161 to 942 of the sequence (Beck et al., 1982).
Northern and Southern Analysis
Total RNA was extracted from leaf tissue using the method of Ecker and Davis (1987). After electrophoresis on 1% (w/v) agarose gels with 2% (w/v) formaldehyde, RNA was transferred to nylon membranes following the Krockzek and Siebert protocol (1990), and hybridized with the NsiI fragment containing the HAL1 gene labeled with digoxigenin (Boehringer Mannheim, Basel). For Southern analysis, total DNA was digested with EcoRI and separated by electrophoresis in agarose gels. The transfer to nylon membranes and hybridization with the HAL1 probe was performed as described above.
Terminology
Transgenic plants will be named hereafter as TG1 followed by the number given to every particular plant (i.e. TG1-1, TG1-2, etc.). It is presumed that a particular TG1 plant should be hemizygous for the integrated transgene or transgenes, so it is equivalent to a heterozygous F1 plant in the classical genetic analysis. The progeny obtained from a transgenic plant (by self-pollination) will be named as TG2 followed by its code number. In theory, a particular TG2 family should segregate for the copy/copies of the transgene(s) that has been introduced, so that the TG2 progeny are equivalent to the F2 generation in the classical genetic analysis. Progeny obtained by selfing TG2 plants will be named as TG3 followed by the code number of the original TG1 plant and an additional number corresponding to the parental TG2 plant.
Segregation Pattern
Cotyledon explants from transgenic (TG2-4 and TG2-6) and untransformed plants were cultured in Petri dishes on IK2550Z10 medium supplemented with 50 μg mL−1 kanamycin. The expression of the nptII gene was evaluated after 28 d of culture by scoring the ability of explants to produce calli and shoots.
Evaluation for Salt Tolerance in Vitro
Seeds from the original line (control) and from the progeny of TG1-4 and TG1-6 plants were sterilized by immersion in a solution of 25% (w/v) commercial bleach (50 g of active chloride per liter) for 10 min, followed by three rinses in sterile distilled water. Surface-sterilized seeds were germinated in test tubes (25 × 15 mm) containing 20 mL of MG medium (Moreno et al., 1984). After 10 d, shoot-apex, hypocotyl, and root explants were obtained and used to evaluate the effects of salt stress. To this end, three different assays were performed.
In the first assay, the shoot-apex tests, apical shoots (1 cm) were transferred to B1 medium supplemented with 0, 125, or 175 mm NaCl. Twenty-four replicates were used for each treatment. After 28 d, plants were removed from vessels and root and shoot growth was scored (percentage of shoots forming roots, shoot elongation in centimeters, and FW and DW in grams; FW and DW, respectively). DW of the aerial part of the plant was obtained after oven drying at 70°C for 24 h.
In the second assay, the hypocotyl callus growth test, the hypocotyl from each plantlet was cut into two segments (upper, explant type-1 and lower, explant type-2) and transferred separately to NB2020 medium containing Murashige and Skoog salts, 100 μg mL−1 myo-inositol, 1 μg mL thiamine-HCl, RT vitamins, 3% (w/v) Suc, 0.8% (w/v) agar, 2 μg mL−1 N6-benzyladenosine, and 2 μg mL−1 naphthaleneacetic acid, with 0, 125, or 175 mm NaCl. The FW and DW of the calli were scored after 28 d of culture. Twenty-four explants were used per treatment.
In the third assay, the root calli test, root sections from the middle part of the root were placed on NB2020 medium without NaCl. After 30 d of culture, calli from the root explants were cut and weighed. Thirty homogeneous inoculates from these calli were transferred to NB2020 with 0, 125, or 175 mm NaCl. FW and DW were scored after 28 d of culture.
Evaluation for Salt Tolerance in Vivo
A plant culture system that allowed capillary irrigation was used to determine growth in saline conditions.
Seeds of both the TG2-4 progeny and the control line were sown in small pots (6.2 × 7.8 cm) filled with a mixture of peat and vermiculite (3:1). Fifteen days after germination, pots with uniformly growing plants were laid on the lid of a water container (30 × 10 × 17 cm). This lid container was covered with a cloth (12.5 × 51 cm) that was in contact with a mineral water solution (65.3 HCO3−, 14.4 SO42−, 4.6 Cl−, 14.6 SiO22−, 23.2 Ca2+, 2.4 Mg2+, and 6.3 Na+ in μg mL−1) supplemented with 0, 75, or 150 mm NaCl. To achieve adequate irrigation of the plantlets, a washing strip (9.5 × 1 cm) was fed through into the pots and maintained in contact with the humid surface of the cloth that covered the container lid. Fifteen milliliters of copper sulfate (Kasumin-cobre, LAINCO, Valencia, Spain) per liter of solution was added to the water container to prevent bacterial and algal growth. Plants were kept in a growth chamber at 25°C ± 2°C with a 16-h light photoperiod (71 μmol m−2s−1) and 62% relative humidity. After 20 d, the height, number of leaves, and total FW and DW of the aerial part of the plant were scored. Changes in relative growth were also calculated. Eight plants were used per salt treatment.
In Vivo Physiological Response in Saline Conditions
To determine the effect of saline conditions on physiological responses, the original line (cv P-73) and the transgenic offspring TG2-4, TG3-4-14, and TG3-4-8 were used. The experiment was carried out in hydroponic culture under controlled conditions. Salt treatment was applied by adding 75 mm NaCl to the Hoagland number two nutrient solution (Hoagland and Arnon, 1950) when the fifth leaf emerged. Control plants remained in Hoagland solution.
Roots and leaves were harvested after 15 and 30 d of salt treatment, and water content and Na+ and K+ concentrations were determined. Plant growth, measured as the plant DW, was calculated at the end of the experiment. Three replicates (six plants per replicate) per treatment were used.
Water content was estimated by (FW − DW)/DW. Cations were determined in the cell sap according to the method of Kamely and Lösel (1995). Leaf and root samples (4–5 g) were quickly weighed, cut into segments, placed in a 5-mL pipette tip, and stored at −20°C for at least 24 h. The frozen material was thawed and centrifuged at 3,000g for 5 min. The cell sap was collected in 1.5-mL Eppendorf tubes placed over the pipette tip. Samples of sap were dispensed into separate tubes and stored at −20°C until analysis. The Na+ and K+ concentrations were determined by atomic absorption spectrometry. Data are presented for each ion as the relative ion concentration calculated according to (Is/Iu × 100%), where Is corresponds to the ion concentration under saline conditions and Iu is the ion concentration in unstressed conditions.
Statistical Analysis
Significance of salt treatment effects was determined using analysis of variance. Percentage data were subjected to arcsine transformation prior to statistical analysis. Variation among treatment means was analyzed using the LSD procedure.
ACKNOWLEDGMENTS
The authors thank M. Rubio and Dr. Gabino Ríos for assistance. Our thanks to Donnellan-Barraclough for their help with the English.
Footnotes
This work was supported by the European Union (project no. AIR–3 CT94–1508).
LITERATURE CITED
- Beck E, Ludwig G, Auerswald EA, Reiss B, Schaller H. Nucleotide sequence and exact localisation of the neomycin phosphotransferase gene from transposon Tn5. Gene. 1982;19:327–336. doi: 10.1016/0378-1119(82)90023-3. [DOI] [PubMed] [Google Scholar]
- Bevan M. Binary Agrobacterium vectors for plant transformation. Nucleic Acids Res. 1984;12:8711–8721. doi: 10.1093/nar/12.22.8711. [DOI] [PMC free article] [PubMed] [Google Scholar]
- Bohnert HJ, Golldack D, Ishitani M, Rammesmayer GUR, Shen B, Sheveleva E, Jensen RG. Salt tolerance engineering requires multiple gene transfers. Ann NY Acad Sci. 1996;792:115–125. [Google Scholar]
- Bolarín MC, Santa-Cruz A, Cayuela E, Pérez-Alfocea F. Short-term solute changes in leaves and roots of cultivated and wild tomato seedlings under salinity. J Plant Physiol. 1995;147:463–468. [Google Scholar]
- Bordás M, Montesinos C, Dabauza M, Salvador A, Roig LA, Serrano R, Moreno V. Transfer of the yeast salt tolerance gene HAL1 to Cucumis melo L. cultivars and in vitro evaluation of salt tolerance. Transgenic Res. 1997;5:1–10. doi: 10.1023/a:1018453032336. [DOI] [PubMed] [Google Scholar]
- Cano E, Perez-Alfocea F, Moreno V, Caro M, Bolarín MC. Evaluation of salt tolerance in cultivated and wild tomato species through in vitro shoot apex culture. Plant Cell Tissue Organ Cult. 1998;53:19–26. [Google Scholar]
- Dehan K, Tal M. Salt tolerance in the wild relatives of the cultivated tomato: responses of Solanum pennellii to high salinity. Irrig Sci. 1978;1:71–76. [Google Scholar]
- Doyle JJ, Doyle JL. Isolation of plant DNA from fresh tissue. Focus. 1990;12:13–15. [Google Scholar]
- Ecker JR, Davis RW. Plant defence genes are regulated by ethylene. Proc Natl Acad Sci USA. 1987;84:5202–5206. doi: 10.1073/pnas.84.15.5202. [DOI] [PMC free article] [PubMed] [Google Scholar]
- Gaxiola R, De Larrinoa IF, Villalba JM, Serrano R. A novel and conserved salt-induced protein is an important determinant of salt tolerance in yeast. EMBO J. 1992;11:3157–3164. doi: 10.1002/j.1460-2075.1992.tb05392.x. [DOI] [PMC free article] [PubMed] [Google Scholar]
- Ghassemi F, Kakeman AJ, Nix HA. Salinization of Land and Water Resources. Wallingford, CT: CAB International; 1995. p. 526. [Google Scholar]
- Gisbert C. Transformación Genética en Lycopersicon: Introducción de Genes Relacionados con la Tolerancia a la Salinidad en L. esculentum Mill. cv P-73 y de Genes Marcadores en L. pennellii (Corr.) D'Arcy Entrada PE47. PhD thesis. Valencia, Spain: Universidad Politécnica; 1997. [Google Scholar]
- Hayashi H, Alia Mustardy L, Deshnium P, Ida M, Murata N. Transformation of Arabidopsis thaliana with the codA gene for choline oxidase: accumulation of glycinebetaine and enhanced tolerance to salt and cold stress. Plant J. 1997;12:133–142. doi: 10.1046/j.1365-313x.1997.12010133.x. [DOI] [PubMed] [Google Scholar]
- Hoagland DR, Arnon DI. The water-culture method for growing plants without soil. Calif Agric Exp Stn Circ. 1950;347:1–39. [Google Scholar]
- Hoekema A, Hirsch PR, Hooykaas PJJ, Schilperoort RA. A binary plant vector strategy based on separationof vir- and T- region of the Agrobacterium tumefaciens Ti plasmid. Nature. 1983;303:179–180. [Google Scholar]
- Höfgen R, Willmitzer L. Storage of competent cells for Agrobacterium transformation. Nucleic Acids Res. 1988;16:9877. doi: 10.1093/nar/16.20.9877. [DOI] [PMC free article] [PubMed] [Google Scholar]
- Jones JDG, Dunsmuir P, Bedbrook J. High level expression of introduced chimaeric genes in regenerated transformed plants. EMBO J. 1985;4:2411–2418. doi: 10.1002/j.1460-2075.1985.tb03949.x. [DOI] [PMC free article] [PubMed] [Google Scholar]
- Kamely A, Lösel DM. Contribution of carbohydrates and other solutes to osmotic adjustment in wheat leaves under water stress. J Plant Physiol. 1995;145:363–366. [Google Scholar]
- Karakas B, Ozia-Sakins P, Stushnoff C, Suefferheld M, Rieger M. Salinity and drought tolerance of mannitol-accumulating transgenic tobacco. Plant Cell Environ. 1997;20:609–616. [Google Scholar]
- Kavi Kishor PB, Hong Z, Miao G, Hu CA, Verma DPS. Overexpression of Δ-pirroline-5-carboxylate synthetase increases proline production and confers osmotolerance in transgenic plants. Plant Physiol. 1995;108:1387–1394. doi: 10.1104/pp.108.4.1387. [DOI] [PMC free article] [PubMed] [Google Scholar]
- Krockzek RA, Siebert E. Optimisation of northern analysis by vacuum-blotting, RNA transfer visualisation and ultraviolet fixation. Anal Biochem. 1990;184:90–95. doi: 10.1016/0003-2697(90)90017-4. [DOI] [PubMed] [Google Scholar]
- Lilius G, Holmberg N, Bülow L. Enhanced NaCl stress tolerance in transgenic tobacco expressing bacterial choline dehydrogenase. Bio-Technology. 1996;14:177–180. [Google Scholar]
- McKersie B, Bowley S, Harjanto E, Lepriner O. Water-deficit tolerance and field performance of transgenic alfalfa overexpressing superoxide dismutase. Plant Physiol. 1996;111:1177–1181. doi: 10.1104/pp.111.4.1177. [DOI] [PMC free article] [PubMed] [Google Scholar]
- Moreno V, Zubeldia L, Roig LA. A method for obtaining callus cultures from mesophyll protoplast of melon (Cucumis melo L.) Plant Sci Lett. 1984;34:195–201. [Google Scholar]
- Munns R. Physiological processes limiting plant-growth in saline soils: some dogmas and hypotheses. Plant Cell Environ. 1993;16:15–24. [Google Scholar]
- Murashige TR, Skoog F. A revised medium for rapid growth and bioassays with tobacco tissue cultures. Physiol Plant. 1962;15:473–497. [Google Scholar]
- Neumann P. Salinity resistance and plant growth revisited. Plant Cell Environ. 1997;20:1193–1198. [Google Scholar]
- Pardo JM, Reddy MP, Yang SL, Maggio A, Huh GH, Matsumoto T, Coca MA, Painodurzo M, Koiwa H, Yun DJ, Watad AA, Bressan RA, Hasegawa PM. Stress signaling through Ca2+/calmodulin-dependent protein phosphatase calcineurin mediates salt adaptation in plants. Proc Natl Acad Sci USA. 1998;95:9681–9686. doi: 10.1073/pnas.95.16.9681. [DOI] [PMC free article] [PubMed] [Google Scholar]
- Pérez-Alfocea F, Estañ MT, Caro M, Bolarín MC. Response of tomato cultivars to salinity. Plant Soil. 1993;150:203–211. [Google Scholar]
- Pérez-Alfocea F, Guerrier G, Estañ MT, Bolarín MC. Comparative salt responses at cell and whole plant levels of cultivated and wild tomato species and their hybrid. J Hortic Sci. 1994;69:639–644. [Google Scholar]
- Ríos G, Ferrando A, Serrano R. Mechanism of salt tolerance conferred by overexpression of the HAL1 Gene in Saccharomyces cerevisiae. Yeast. 1997;13:515–528. doi: 10.1002/(sici)1097-0061(199705)13:6<515::aid-yea102>3.3.co;2-o. [DOI] [PubMed] [Google Scholar]
- Romero C, Belles JM, Vayá JL, Serrano R, Culiañez-Maciá FA. Expression of the yeast trealose-6-phosphate synthase gene in transgenic tobacco plants: pleiotropic phenotypes include drought tolerance. Planta. 1997;201:293–297. doi: 10.1007/s004250050069. [DOI] [PubMed] [Google Scholar]
- Rus AM. Tolerancia a la salinidad del tomate cultivado y silvestre mediante cultivo de callos. PhD thesis. Murcia, Spain: Universidad de Murcia; 1998. [Google Scholar]
- Saranga Y, Marani A, Zamir D, Rudich J. Breeding tomatoes for salt tolerance: I. Field screening of Lycopersicon accessions for yield and dry matter production. J Am Soc Hortic Sci. 1991;116:1067–1071. [Google Scholar]
- Schachtman D, Liu W. Molecular pieces to the puzzle of the interaction between potassium and sodium uptake in plants. Trends Plant Sci. 1999;4:281–287. doi: 10.1016/s1360-1385(99)01428-4. [DOI] [PubMed] [Google Scholar]
- Serrano R. Salt tolerance in plants 38 microorganisms-toxicity targets and defense responses. Int Rev Cytol. 1996;165:1–52. doi: 10.1016/s0074-7696(08)62219-6. [DOI] [PubMed] [Google Scholar]
- Serrano R, Gaxiola R. Microbial models and salt stress tolerance in plants. CRC Crit Rev Plant Sci. 1994;13:121–133. [Google Scholar]
- Staba EJ. Plant tissue culture as a technique for the phytochemistry. In: Sikel MK, Runcekles YC, editors. Recent Advances in Phytochemistry. Vol. 2. New York: Appleton-Century-Crofts; 1969. pp. 75–106. [Google Scholar]
- Tal M, Shannon MC. Salt tolerance in the wild relatives of the cultivated tomato: responses of L. esculentum, L. cheesmanii, L. peruvianum, Solanum pennellii and F1 hybrids to high salinity. Aust J Plant Physiol. 1983;10:109–117. [Google Scholar]
- Taleisnik EL. Salinity effects on growth and carbon balance in Lycopersicon esculentum and L. pennellii. Physiol Plant. 1987;71:213–218. [Google Scholar]
- Tarczynski MC, Jensen RG, Bohnert HJ. Stress protection of transgenic tobacco by production of the osmolyte mannitol. Science. 1993;259:508–510. doi: 10.1126/science.259.5094.508. [DOI] [PubMed] [Google Scholar]
- Taylor GR. Polymerase chain reaction: basic principles and automation. In: McPherson MJ, Quirke P, Taylor GR, editors. PCR: A Practical Approach. Oxford: IRL Press; 1991. pp. 1–14. [Google Scholar]
- Vernon DM, Tarczynski MC, Jensen RG, Bohnert HJ. Cyclitol production in transgenic tobacco. Plant J. 1993;4:199–205. [Google Scholar]
- Vogelien DL, Hickok LG, Warne TR. Differential effects of Na+, Mg2+, K+, Ca2+ and osmotic stress on the wild type and the NaCl-tolerant mutants stl1 and stl2 of Ceratopteris richardii. Plant Cell Environ. 1996;19:17–23. [Google Scholar]
- Xu D, Duan X, Wang B, Hong B, Ho HD, Wu R. Expression of a late embryogenesis abundant protein gene, HVA1, from barley confers tolerance to water deficit and salt stress in transgenic rice. Plant Physiol. 1996;110:249–257. doi: 10.1104/pp.110.1.249. [DOI] [PMC free article] [PubMed] [Google Scholar]