

Abstract
While long‐term survival rates for early‐stage lung cancer are high, most cases are diagnosed in later stages that can negatively impact survival rates. We aim to design a simple, single biomarker blood test for early‐stage lung cancer that is robust to preclinical variables and can be readily implemented in the clinic. Whole blood was collected in PAXgene tubes from a training set of 29 patients, and a validation set of 260 patients, of which samples from 58 patients were prospectively collected in a clinical trial specifically for our study. After RNA was extracted, the expressions of FPR1 and a reference gene were quantified by an automated one‐step Taqman RT‐PCR assay. Elevated levels of FPR1 mRNA in whole blood predicted lung cancer status with a sensitivity of 55% and a specificity of 87% on all validation specimens. The prospectively collected specimens had a significantly higher 68% sensitivity and 89% specificity. Results from patients with benign nodules were similar to healthy volunteers. No meaningful correlation was present between our test results and any clinical characteristic other than lung cancer diagnosis. FPR1 mRNA levels in whole blood can predict the presence of lung cancer. Using this as a reflex test for positive lung cancer screening computed tomography scans has the potential to increase the positive predictive value. This marker can be easily measured in an automated process utilizing off‐the‐shelf equipment and reagents. Further work is justified to explain the source of this biomarker.
Keywords: early detection, FPR1, blood, small cell lung cancer, non‐small cell lung cancer
Short abstract
What's new?
There have been several lung cancer screening trials evaluating the potential benefit of imaging for improving survival outcomes in lung cancer patients. While low‐dose computed tomography (CT) screening reduces mortality, it yields a 96.4% false‐positive rate. A potential strategy to improve screening may be the identification of additional tools that improve identification of false positives. Using prospectively collected whole blood samples, here the authors show that elevated FPR1 mRNA expression has a 68% sensitivity and 89% specificity. This single biomarker blood test, which can be readily implemented in the clinic, may increase the positive predictive value of detecting lung cancer.
Abbreviations
- ACTB
β‐actin
- cfDNA
cell‐free DNA
- CTC
circulating tumor cells
- FPR1
formyl peptide receptor 1
- HNRNPA1
heterogeneous nuclear ribonucleoprotein A1
- NLST
National Lung Screening Trial
- NSCLC
non‐small cell lung cancer
- SCLC
small cell lung cancer
In absolute numbers, lung cancer has a highest number of cancer‐related deaths in the United States. While the majority of individuals developing lung cancer are current or former smokers, a growing proportion of patients that never smoked are diagnosed with lung cancer.1 Diagnosis in general portends a poor prognosis due to the prevalence of detection at later stages of disease, when curative approaches are less likely. When detected earlier, the survival rates can be improved. Thus, there have been several lung cancer screening trials evaluating the benefit of imaging to improve survival outcomes by increasing the proportion of patients diagnosed with lung cancer at an earlier stage of disease, to allow for a curative approach. Most recently, the National Lung Screening Trial (NLST) found a 96.4% false‐positive rate in the low‐dose computed tomography (CT) group and false‐positive rate 94.5% in the chest radiography group. Despite the high false‐positive rate, low‐dose CT screening reduced mortality by 20%.2 Some key concerns about generalized application of screening CT is adherence to the parameters/metrics for nodule evaluation applied in the NLST, cost, and dealing with false positives. A potential strategy to improve screening may be the identification of additional tools that improve assignment of false positives.
Formyl peptide receptor 1 (FPR1) is a pattern recognition receptor with critical roles in innate immune response, wound repair and angiogenesis.3 FPR1 expression is increased in lung epithelial cells in response to TNF‐α, LPS, scratch injury, mitochondrial antigens and is involved in lung wound closure.4 FPR1 is significantly and recurrently mutated in small cell lung cancer (SCLC),5 and expression is decreased in lung cancer compared to peritumoral tissues.6 FPR1 knockout mice have decreased migration of neutrophils and macrophages after cigarette smoke exposure and demonstrate different expression of inflammatory genes.7 The role of FPR1 appears to be highly context dependent. Silencing of FPR1 enhances the ability of gastric cancer cells to form tumors, suggesting it can act as a tumor suppressor in that tissue type.8 Conversely, high expression of FPR1 is significantly associated with tumor progression in gastric cancer9 and gliomas.10
Recently, several strategies have been developed to perform noninvasive “liquid biopsies,” which are of particular utility for lung cancer patients.11 These methods capture DNA from circulating tumor cells (CTC),12 exosomes or cell‐free DNA (cfDNA) present in the plasma.13, 14
The FPR1 mRNA marker was originally designed to detect neutrophil contamination in experiments designed to detect circulating DNA in plasma samples. It was believed that using the ratio of this marker to a reference gene on total nucleic acid isolates would allow elimination of mishandled samples. Surprisingly, it was found that this marker was more highly expressed on specimens from patients with non‐small cell lung cancer (NSCLC) compared to individuals without cancer. Additional work revealed that this signal was present in whole blood at levels substantially higher than plasma alone and is likely of cellular origin. PAXgene RNA tubes provide an easy method to collect and transport whole blood for mRNA analysis, and the signal was also found with this strategy.15 In our study, we explored FPR1 as a possible single biomarker blood test for detection of lung cancer.
Material and Methods
Study population
Samples were collected both retrospectively and prospectively under IRB‐approved protocols from multiple sites to minimize the risk of handling procedures at a single site unknowingly impacting results. A training set consisted of blood specimens from 17 NSCLC patients and 12 healthy volunteers (HV). Patients were considered nonsmokers if they reported no smoking history, and patients were considered smokers if they reported ≥20 pack‐years of smoking. Pack‐years is defined as number of cigarette packs per day smoked multiplied by the number of years of smoking. For example, smoking 1 pack of cigarettes per day for 20 years or 2 packs of cigarettes per day for 10 years (or any multiple that yields 20) would be 20 pack‐years of smoking.
Lung cancer blood specimens were only included if the patient carried a diagnosis of either NSCLC or SCLC. Specimens from individuals with other cancer types were excluded. The minimal clinical dataset for inclusion in the retrospectively collected specimens (n = 289) was pack‐years smoking history, age and cancer diagnosis. Prospectively collected samples required that patients (n = 58) were surgically operable, ≥50 years old with ≥20 pack‐years of smoking history. Sample identity was blinded from the technicians handling the samples.
Benign samples were defined as coming from patients with a suspicious nodule identified on CT scan and confirmed to be cancer free by the contributing institution's standard of care workup. From a total of 18 benign cases, 7 were determined to be cancer free by futile thoracotomy, 3 by biopsy, 4 by bronchoalveolar lavage and 4 by unspecified means.
Sample collection and transport
All samples were handled as routine clinical specimens and without special handling. For retrospective cases, 2.5 ml of peripheral venous blood was collected in a PAXgene RNA (PreAnalytiX, Hombrechtikon, Switzerland) by the institution's standard method of phlebotomy and then frozen at −80°C within 2.5 hr. The criteria limiting exposure to room temperature to 2.5 hr was added after examining data; all other criteria were established before the study began. Prospective samples were collected in a PAXgene tube via venipuncture or a new IV line, placed in a shipping container including a wet ice pack, shipped overnight and then frozen on nitrogen vapor (–190°C) immediately upon receipt.
Measurement of mRNA
RNA was extracted with the Qiasymphony PAXgene blood RNA kit (Qiagen, Hilden, Germany). Levels of mRNA were quantified via quantitative PCR using a one‐step, closed‐tube QuantiFast Probe RT‐PCR Plus Kit (Qiagen). This closed‐tube assay removes genomic DNA, creates cDNA and then conducts quantitative PCR. The primers and probes used are shown in Supporting Information Table S1, and synthetic standards shown in Supporting Information Table S2. All reactions were conducted in quadruplicate on a single run, and regression was used to determine fitted concentration in terms of unit (U) as defined for each standard. The ratio of fitted FPR1/heterogeneous nuclear ribonucleoprotein A1 (HNRNPA1) or total level of FPR1 alone was examined. We examined expression data from many tissue and cancer types and determined that HNRNPA1 has the lowest overall variability in expression. This in silico experiment was conducted prior to building the test. High level of β‐actin (ACTB) was used as an exclusionary criterion. We found that high levels of ACTB tended to predict incorrect results in rare cases, though a biologic mechanism for this was not ascertained. Assignment of samples to processing batches was randomized, and process batches contained samples from multiple cohorts. All handling was conducted in a CLIA/CAP accredited BSL2 laboratory.
Statistical analysis
A single decision variable, the FPR1/HNRNPA1 ratio, was used. A single threshold can readily be created, and ROC curves were used to explore the effects of different threshold decisions. Potential differences between numerical values were assessed by t‐test, and differences between count data was evaluated by Fisher's exact test. Bonferroni correction for multiple testing was applied. When cohorts appeared to be distributed differently, a Kolmogorov–Smirnov test was used to test this hypothesis. Linear regression and logistic regression were used in an attempt to predict results from clinical data without access to cancer status or results of the FPR1 test.
Results
Training set
The training set consisted of 17 NSCLC specimens and 12 HV. The validation set was divided into 11 cohorts based on diagnosis and smoking history (Table 1). Details of cancer staging for the both sets are displayed in Supporting Information Tables S3 and S4. We selected at threshold of 62 for the FPR1/HNRNPA1 ratio, as this was the lowest whole number value with 100% specificity. Since we did not observe any training samples with an outlier ACTB value, a cutoff of 50 U was set. This represented twice the highest value observed.
Table 1.
Clinical characteristics for all samples
| Cohort | N | Age | Male (%) | Current smoker (%) | PY | COPD (%) | Stage I (%) | Site 1 | Site 2 | Site 3* | Site 4* |
|---|---|---|---|---|---|---|---|---|---|---|---|
| Training set | |||||||||||
| Lung cancer (all types) | 17 | 65 ± 7 | 47 | 71 | 42 ± 18 | ISD | 59 | 17 | |||
| Healthy volunteer | 12 | 63 ± 5 | 42 | 10 | 30 ± 3 | ISD | – | 12 | |||
| Validation set | |||||||||||
| Smoker adenocarcinoma | 69 | 66 ± 9 | 42 | 68 | 51 ± 24 | 32 | 35 | 57 | 5 | 7 | |
| Nonsmoker adenocarcinoma | 17 | 68 ± 9 | 35 | – | – | 12 | 41 | 15 | 2 | ||
| Smoker squamous cell carcinoma | 15 | 66 ± 9 | 67 | 64 | 51 ± 23 | 47 | 31 | 9 | 6 | ||
| Nonsmoker squamous cell carcinoma | 4 | 73 ± 9 | 75 | – | – | 0 | 25 | 2 | 2 | ||
| Smoker NSCLC NOS | 7 | 65 ± 9 | 100 | 50 | 51 ± 24 | 33 | 29 | 4 | 3 | ||
| Smoker SCLC | 17 | 64 ± 9 | 44 | 62 | 53 ± 22 | 38 | 53 | 13 | 4 | ||
| Nonsmoker SCLC | 1 | 55 | 100 | – | – | 0 | 0 | 1 | |||
| Smoker benign | 13 | 68 ± 9 | 38 | ISD | 47 ± 23 | 38 | – | 3 | 10 | ||
| Nonsmoker benign | 5 | 74 ± 7 | 60 | – | – | 0 | – | 5 | |||
| Smoker volunteer | 94 | 64 ± 9 | 52 | 32 | 45 ± 22 | 29 | – | 43 | 26 | 21 | 4 |
| Nonsmoker volunteer | 18 | 62 ± 8 | 50 | – | – | 0 | – | 13 | 4 | 1 | |
| All validation samples | 257 | 65 ± 9 | 50 | 38 | – | 28 | 35 | 155 | 45 | 49 | 8 |
Summary statistics of clinical attributes for each cohort used within the study. Sites 1 and 2 were collected samples retrospectively, while sites 3 and 4 (indicated by *) collected samples prospectively for our study. Summary statistics were based on the patients with a given field available. If less than half of patients had a given field available, insufficient data (ISD) was recorded.
Abbreviations: N, number; PY, pack‐years of smoking; COPD, chronic obstructive pulmonary disease; NSCLC, non‐small cell lung cancer; NOS, not otherwise specified; SCLC, small cell lung cancer.
Summary statistics for the study population are shown in Table 1. Patients occasionally chose not to volunteer data for a given field, but all data were available for most patients. Information on whether the individual was a smoker or nonsmoker and the number of pack‐years was mandatory. The set of normal specimens used within the training set was not screened by the same standard for age and smoking history.
Validation set
The validation set was extracted and analyzed by qPCR after the rules were finalized in the training set. Figure 1 shows the distribution of the FPR1/HNRNPA1 ratio for each cohort. In all cases, the distribution is skewed upward in the malignant cases. A total of two cases (0.78%) were excluded based on our predefined ACTB exclusionary criteria. One was a nonsmoker HV and the other was a smoker with NSCLC. Both would have been incorrectly classified without this metric. There was no apparent difference in the FPR1 ratio related to cancer stage.
Figure 1.
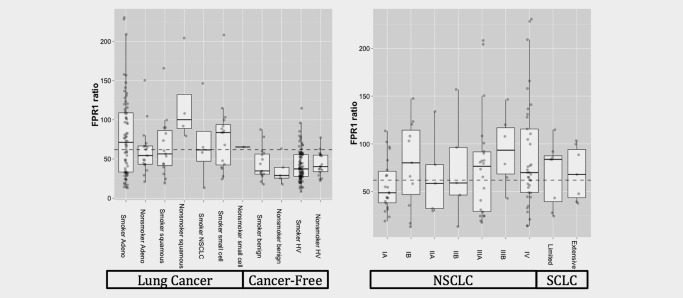
FPR1 ratio boxplots. Boxplots of FPR1 ratio obtained from each cohort (left) and each tumor stage (right). The dotted line represents the cutoff for calling a positive determined in the training set. Abbreviations: Adeno, adenocarcinoma; Hv, healthy volunteers; NSCLC, non‐small cell lung cancer.
The nonsmoker squamous cell lung carcinoma appears to be distributed differently from the other cancers, but there are only four cases in this cohort. While smoker benign cases appear to be skewed slightly higher than nonsmoker benign cases, there was no significant difference identified by the Kolmogorov–Smirnov test (p = 0.91).
The ROC curves obtained from the training set are shown in Supporting Information Figure S1, and ROC curves for the entire validation set and prospective samples only are shown in Figure 2. Using the predefined threshold for FPR1/HNRNPA1 ratio, the ROC curves for the validation set appear to be reasonable with a sensitivity of 55% and a specificity of 87%. When only the specimens from the prospective clinical trial were classified, a 68% sensitivity and 89% specificity were observed. The increase in sensitivity was statistically significant by Fisher's exact test (p = 0.018).
Figure 2.
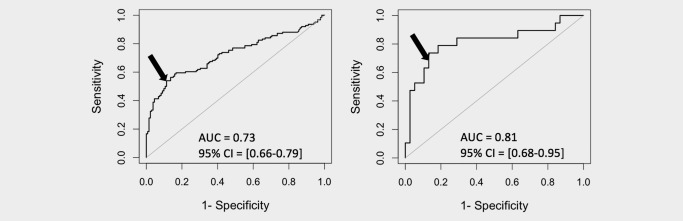
ROC plots. ROC plots for all validation samples (left) and prospective samples only (right). The arrow indicates the position on the ROC curve represented by the predetermined threshold of 62.
We conducted an analysis to determine the effect of time between collection and refrigeration/freezing. When we examined retrospective samples, we found that samples stored at room temperature for longer than the specified 2.5 hr tended to obtain a negative cancer classification result regardless of cancer status. Prospective samples were refrigerated without delay, which may explain the higher sensitivity.
Multiple strategies were taken to ensure the FPR1 was an independent measure of cancer status and not simply a measure correlated to other clinical attributes that also correlate to cancer status. The factors most likely to correlate to cancer status were determined to be age and smoking pack‐years. Neither statistical tests or review of scatterplots showed any relationship between either of these factors and the FPR1 ratio.
There was no significant correlation between FPR1 ratio and lung cancer stage, major lung cancer histology, cancer‐free status (HV vs. benign) or current smoking status (Table 2). Gender did have a significant impact on FPR1/HNRNPA1 ratio but did not affect the overall classification accuracy (positive vs. negative). The bar graphs in Figure 3 reveal that men with lung cancer tend to have a FPR1/HNRNPA1 ratio skewed to higher values, but this does not affect the overall sensitivity of the test (p = 0.11 by Fisher's exact test).
Table 2.
Statistical tests for relationships between clinical attributes and FPR1 ratio
| Attribute | FPR1/HNRNPA1 ratio p‐value | Correct classification p‐value |
|---|---|---|
| Stage I vs. other stages | 0.14 | 0.61 |
| NSCLC vs. SCLC | 0.64 | 0.44 |
| HV vs. benign | 0.47 | 1.00 |
| Current vs. former smoker | 0.75 | 0.55 |
| Smoker vs. nonsmoker | 0.70 | 0.90 |
| COPD vs. non‐COPD | 0.17 | 1.00 |
| Male vs. female | 0.0021a | 0.23 |
FPR1 ratios were compared by t‐test, and the outcome of the test (positive or negative) was compared by Fisher's exact test.
Remains statistically significant after Bonferroni correction.
Abbreviations: NSCLC, non‐small cell lung cancer; SCLC, small cell lung cancer; HV, healthy volunteer; COPD, chronic obstructive pulmonary disease.
Figure 3.
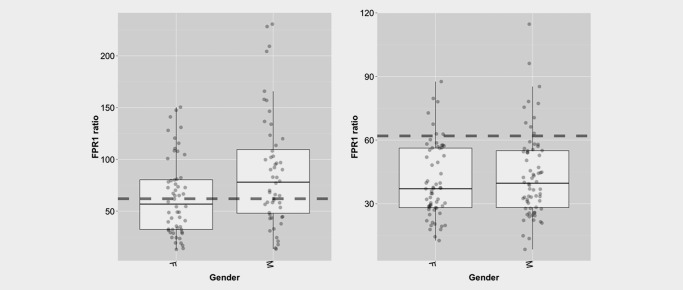
Relationship between FPR1 ratio and gender. Boxplots demonstrating the relationship between FPR1 ratio and gender for malignant cases (left) and cancer‐free cases (right).
To assure that no combination of clinical variables could account for the FPR1 ratio, we created a linear regression model using age, pack‐years smoking, COPD and gender (Fig. 4). This model could not predict FPR1 and yielded a Pearson's r 2 of 0.0369. A similar attempt was used to predict cancer status using logistic regression. The 95% confidence interval for AUC straddled 0.5, indicating that a model built from clinical attributes had no predictive value.
Figure 4.
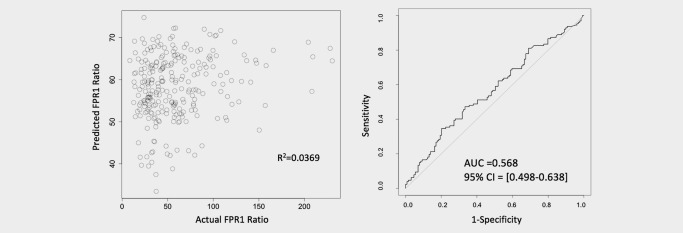
Linear and logistic regression curves. Attempts to predict the FPR1 ratio by linear regression (left) and predict cancer status by logistic regression (right) were unsuccessful when clinical attributes of age, pack‐years of smoking history, COPD status and gender were used as predictors. This indicates that neither the FPR1 ratio nor its predictive power is related to these clinical attributes.
Discussion
Early detection of lung cancer can substantially improve clinical outcomes.
The ratio of FPR1/HNRNPA1 can predict whether a patient has lung cancer based on 2.5 ml of blood. The accuracy was not affected by clinical attributes, and no difference in sensitivity was found between early‐stage and advanced lung cancer. Other groups have explored the utility of blood and nonblood‐based biomarkers for lung cancer screening. A representative list include using gene expression of peripheral blood mononuclear cells,16 serum proteins,17 microRNAs,18 immunoassay,19 methylation,20 exhaled volatile organic compounds21 and urine protein biomarkers.22 Unlike other blood‐based lung cancer detection methods, the FPR1 ratio has been demonstrated to detect both NSCLC and SCLC.
The FPR1/HNRNPA1 ratio showed high specificity but low sensitivity. These characteristics make it useful in screening indeterminate nodules found during CT scans. These nodules are typically not biopsied immediately and are observed in follow‐up CT scans. A false negative would not change clinical decision making, and the low false‐positive risk may justify conducting a biopsy expeditiously rather than waiting. Patients with indeterminate nodules 4–10 mm in size would be ideal candidates for this test, because the nodules are large enough to biopsy, but are small enough they are not typically biopsied soon after discovery. Clinical benefit would be realized if a potential lung cancer were detected before advancing to a later stage.
Clinical diagnostics are different from research studies. Complicated preanalytical handling procedures are common in research studies, often involving multiple steps of pipetting, centrifugation and shipping at cryogenic temperatures. The FPR1 test requires a simple blood draw followed by shipping with an ice pack. Reduced handling steps simplify handling in the clinic and decrease influence of preanalytical variables. Scalability is also a critical concern in the conversion of a research assay into a clinical one. The FPR1 assay is fully automated on the QiaSymphony SP/AS robot, minimizing analytical variables and increasing scalability.
A single variable classifier is preferable to a multiple variable classifier as there is less risk for over fitting the training data.23 It is easy to create a model that fits random variance rather than underlying predictors of a condition when many variables are used, but using a single variable classifier substantially reduces this risk. The use of multiple source sites, prospective collection and the training/validation set strategy we used further reduces this risk.
Prospective collected samples performed better than archived retrospectively collected samples. This was driven by increased sensitivity, while specificity remained the same. One may initially suggest that this is driven by the fact that the prospective trial only included smokers, but our analysis found no significant correlation between smoking history and FPR1 levels or accuracy. The better performance of prospective samples is likely due to the additional controls around the collection methodology. While many of the retrospective samples were stored at room temperature for 2 hr or more, the prospective ones were immediately either placed at +4°C or placed in a shipping container with an ice pack. Review of samples stored at room temperature for longer periods of time than our study allowed revealed they tended to obtain results similar to cancer‐free specimens. A study that involved deliberately exposing healthy volunteers' blood to various time periods at room temperature did not detect any change in the FPR1 ratio over time. It is known that some mRNAs are not fully preserved by PAXgene tubes.24 It is possible that the source of the cancer‐specific marker is degraded or experienced expression changes during long periods at room temperature. It was noted that when the ROC curves for all specimens and prospective specimens were compared, the “bend” near the selected cutoff appears similar in both. The difference could be readily explained by assuming that approximately 25% of the retrospectively collected samples from lung cancer patients were distributed similar to samples from patients without cancer due to the previously described stability effects. For higher specificity, one could use a higher threshold with a minor decrease in specificity. In contrast, there does not appear to be much ability to increase sensitivity without severely impacting specificity.
FPR1 is known to be involved in immune responses, as well as, wound healing in the lungs.3 Further research is needed to determine whether these functions are related to the increased FPR1 mRNA levels found in blood. Immunotherapies are becoming more important in the treatment of cancers.25 The possible relationship between circulating FPR1 and immune response can be investigated as a possible predictor of immune therapy response. Future studies may also include collection of blood spots rather than using an entire PAXgene tube.
Conclusion
FPR1 is a blood‐based marker potentially useful for the early detection of lung cancer. FPR1 has accuracy comparable to the best publications to date but is unique because it is a single marker as opposed to a panel. The described method uses a Taqman‐style PCR assay and is suitable for clinical testing. Our study is also unique in aspects of sample collection, which can easily be done in the current medical infrastructure. For the entire validation set, we observed 55% sensitivity for both SCLC and NSCLC with 87% specificity. In prospectively collected whole blood samples, the sensitivity and specificity improved to 68% and 89%, respectively. Additional work is justified to explore the use of the FPR1 marker to evaluate patients with indeterminate lung nodules, particularly those between 4 and 10 mm.
Supporting information
Supporting Figures
Supporting Figure Legend
Supporting Table
Acknowledgements
The authors wish to acknowledge the efforts of the participating sites, including the Expression Project for Oncology (expO) and International Genomics Consortium, as well as consenting patients and volunteers that helped support this research. Additionally, the Arizona Innovation Challenge award provided by the Arizona Commerce Authority was critical to support the biospecimen collection and processing required for our study. Finally, Dr. Pass was supported for sample collection by a grant from the Early Detection Research Network, NCI. Funding: This work was supported by Viomics. A portion of Viomics' budget resulted from the Arizona Innovation Challenge award by the Arizona Commerce Authority. No award number is applicable.
Conflict of interest: Dr. Morris reports stock and personal fees from Viomics, during the conduct of the study; personal fees and stock from Paradigm Diagnostics, outside the submitted work; In addition, Dr. Morris has a patent PCT/US2013/020383 issued. Dr. Vachani reports grants from Viomics, during the conduct of the study; grants from Jannsen Research and Development, grants from MagArray, Inc, grants from Integrated Diagnostics, grants from Veracyte, Inc, outside the submitted work. Dr. Pass and Dr. Rom report grants from Viomics, during the conduct of the study. Dr. Weiss reports other from Viomics, during the conduct of the study; personal fees from Merck, personal fees from Novartis, personal fees from Paradigm, personal fees from Medscape, personal fees from Blend Therapeutics, personal fees from Pharmatech, personal fees from Amgen, personal fees from Pfizer, personal fees from IDEA Pharma, personal fees from Ignyta, personal fees from GLG Council, personal fees and ownership interest from Circulogene Theranostics, has received travel reimbursement from NantWorks, has received travel reimbursement from Cambridge HealthTech Institute, has received travel reimbursement from Tesaro; and has a patent for methods and kits to predict prognostic and therapeutic outcome in SCLC issued, outside the submitted work. Dr. Hogarth has served in an advising capacity to Viomics and has received stock options as compensation, during the conduct of the study. Mr. Shelton reports stock and personnel fees from Viomics, during the conduct of the study; personal fees and stock from Paradigm Diagnostics, outside the submitted work. David Mallery report stock from Viomics, during the conduct of the study; personal fees and stock from Paradigm Diagnostics, outside the submitted work. Mr. Mallery has a patent PCT/US2013/020383 issued. All remaining authors have declared no conflicts of interest.
References
- 1. Planchard D, Besse B. Lung cancer in never‐smokers. Eur Respir J 2015;45:1214–7. [DOI] [PubMed] [Google Scholar]
- 2. National Lung Screening Trial Research Team , Aberle DR, Adams AM, et al. Reduced lung‐cancer mortality with low‐dose computed tomographic screening. N Engl J Med 2011;365:395–409. [DOI] [PMC free article] [PubMed] [Google Scholar]
- 3. Prevete N, Liotti F, Marone G, et al. Formyl peptide receptors at the interface of inflammation, angiogenesis and tumor growth. Pharmacol Res 2015;102:184–91. [DOI] [PubMed] [Google Scholar]
- 4. Shao G, Julian MW, Bao S, et al. Formyl peptide receptor ligands promote wound closure in lung epithelial cells. Am J Respir Cell Mol Biol 2011;44:264–9. [DOI] [PMC free article] [PubMed] [Google Scholar]
- 5. George J, Lim JS, Jang SJ, et al. Comprehensive genomic profiles of small cell lung cancer. Nature 2015; 524:47–53. [DOI] [PMC free article] [PubMed] [Google Scholar]
- 6. Cattaneo F, Guerra G, Parisi M, et al. Expression of formyl‐peptide receptors in human lung carcinoma. Anticancer Res 2015;35:2769–74. [PubMed] [Google Scholar]
- 7. Cardini S, Dalli J, Fineschi S, et al. Genetic ablation of the Fpr1 gene confers protection from smoking‐induced lung emphysema in mice. Am J Respir Cell Mol Biol 2012;47:332–9. [DOI] [PubMed] [Google Scholar]
- 8. Prevete N, Liotti F, Visciano C, et al. The formyl peptide receptor 1 exerts a tumor suppressor function in human gastric cancer by inhibiting angiogenesis. Oncogene 2015;34:3826–38. [DOI] [PubMed] [Google Scholar]
- 9. Cheng T‐Y, Wu M‐S, Lin J‐T, et al. Formyl peptide receptor 1 expression is associated with tumor progression and survival in gastric cancer. Anticancer Res 2014;34:2223–9. [PubMed] [Google Scholar]
- 10. Yang Y, Liu Y, Yao X, et al. Annexin 1 released by necrotic human glioblastoma cells stimulates tumor cell growth through the formyl peptide receptor 1. Am J Pathol 2011;179:1504–12. [DOI] [PMC free article] [PubMed] [Google Scholar]
- 11. Lin C‐C, Huang W‐L, Wei F, et al. Emerging platforms using liquid biopsy to detect EGFR mutations in lung cancer. Expert Rev Mol Diagn 2015;15:1427–40. [DOI] [PMC free article] [PubMed] [Google Scholar]
- 12. Hanssen A, Loges S, Pantel K, et al. Detection of circulating tumor cells in non‐small cell lung cancer. Front Oncol 2015;5:207. [DOI] [PMC free article] [PubMed] [Google Scholar]
- 13. Brock G, Castellanos‐Rizaldos E, Hu L, et al. Liquid biopsy for cancer screening, patient stratification and monitoring. Transl Cancer Res 2015;4:280–90. [Google Scholar]
- 14. Oellerich M, Schütz E, Beck J, et al. Using circulating cell‐free DNA to monitor personalized cancer therapy. Crit Rev Clin Lab Sci 2017;54:205–18. [DOI] [PubMed] [Google Scholar]
- 15. Chai V, Vassilakos A, Lee Y, et al. Optimization of the PAXgene™ blood RNA extraction system for gene expression analysis of clinical samples. J Clin Lab Anal 2005;19:182–8. [DOI] [PMC free article] [PubMed] [Google Scholar]
- 16. Showe MK, Vachani A, Kossenkov AV, et al. Gene expression profiles in peripheral blood mononuclear cells can distinguish patients with non‐small cell lung cancer from patients with nonmalignant lung disease. Cancer Res 2009;69:9202–10. [DOI] [PMC free article] [PubMed] [Google Scholar]
- 17. Sin DD, Tammemagi CM, Lam S, et al. Pro‐surfactant protein B as a biomarker for lung cancer prediction. J Clin Oncol 2013;31:4536–43. [DOI] [PMC free article] [PubMed] [Google Scholar]
- 18. Li M, Zhang Q, Wu L, et al. Serum miR‐499 as a novel diagnostic and prognostic biomarker in non‐small cell lung cancer. Oncol Rep 2014;31:1961–7. [DOI] [PubMed] [Google Scholar]
- 19. Doseeva V, Colpitts T, Gao G, et al. Performance of a multiplexed dual analyte immunoassay for the early detection of non‐small cell lung cancer. J Transl Med 2015;13:55. [DOI] [PMC free article] [PubMed] [Google Scholar]
- 20. Weiss G, Schlegel A, Kottwitz D, et al. Validation of the SHOX2/PTGER4 DNA methylation marker panel for plasma‐based discrimination between patients with malignant and nonmalignant lung disease. J Thorac Oncol 2017;12:77–84. [DOI] [PMC free article] [PubMed] [Google Scholar]
- 21. Phillips M, Bauer TL, Cataneo RN, et al. Blinded validation of breath biomarkers of lung cancer, a potential ancillary to chest CT screening. PLoS ONE 2015;10:e0142484. [DOI] [PMC free article] [PubMed] [Google Scholar]
- 22. Nolen BM, Lomakin A, Marrangoni A, et al. Urinary protein biomarkers in the early detection of lung cancer. Cancer Prev Res 2015;8:111–9. [DOI] [PMC free article] [PubMed] [Google Scholar]
- 23. Kågedal B, Lindqvist M, Farnebäck M, et al. Failure of the PAXgene™ blood RNA system to maintain mRNA stability in whole blood. Clin Chem Lab Med 2005;43:1190–2. [DOI] [PubMed] [Google Scholar]
- 24. Venet D, Dumont JE, Detours V, et al. Most random gene expression signatures are significantly associated with breast cancer outcome. PLoS Comput Biol 2011;7:e1002240. [DOI] [PMC free article] [PubMed] [Google Scholar]
- 25. Weiss GJ, Waypa J, Blaydorn L, et al. A phase Ib study of pembrolizumab plus chemotherapy in patients with advanced cancer (PembroPlus). Br J Cancer 2017;117:33–40. [DOI] [PMC free article] [PubMed] [Google Scholar]
Associated Data
This section collects any data citations, data availability statements, or supplementary materials included in this article.
Supplementary Materials
Supporting Figures
Supporting Figure Legend
Supporting Table