

Abstract
A grand challenge of systems biology is to predict the kinetic responses of living systems to perturbations starting from the underlying molecular interactions. Changes in the nutrient environment have long been used to study regulation and adaptation phenomena in microorganisms1–3 and they remain a topic of active investigation4–11. Although much is known about the molecular interactions that govern the regulation of key metabolic processes in response to applied perturbations12–17, they are insufficiently quantified for predictive bottom-up modelling. Here we develop a top-down approach, expanding the recently established coarse-grained proteome allocation models15,18–20 from steady-state growth into the kinetic regime. Using only qualitative knowledge of the underlying regulatory processes and imposing the condition of flux balance, we derive a quantitative model of bacterial growth transitions that is independent of inaccessible kinetic parameters. The resulting flux-controlled regulation model accurately predicts the time course of gene expression and biomass accumulation in response to carbon upshifts and downshifts (for example, diauxic shifts) without adjustable parameters. As predicted by the model and validated by quantitative proteomics, cells exhibit suboptimal recovery kinetics in response to nutrient shifts owing to a rigid strategy of protein synthesis allocation, which is not directed towards alleviating specific metabolic bottlenecks. Our approach does not rely on kinetic parameters, and therefore points to a theoretical framework for describing a broad range of such kinetic processes without detailed knowledge of the underlying biochemical reactions.
We focus on growth transitions between carbon substrates that can be co-utilized21 or those that are closely related and hence readily switchable, avoiding prolonged growth arrests or heterogeneous growth characteristics8,9,11 for which even the steady-state behaviours are poorly characterized. We first studied nutrient upshifts by growing a wild-type Escherichia coli K-12 strain (NCM3722) in minimal medium, with succinate as the sole carbon substrate. During exponential growth, a second, co-utilized carbon substrate21 (gluconate) was added (Fig. 1 and Methods). The time course of optical density at 600 nm (OD600 nm) of the cell culture (a proxy for cell mass M, Extended Data Fig. 1a), was measured throughout the transition (Fig. 1a); faster growth occurred soon after the shift. Ribosome content (reported by RNA abundance16) increased faster than cell mass, as is well known3, whereas catabolic protein content (reported by LacZ expression induced in medium with isopropyl β-D-1-thiogalactopyranoside, IPTG15) took several hours to adapt. Eventually, all these quantities grew at the same rate, as is required for balanced growth. The instantaneous growth rate, λ = dlnM/dt, slowly converged to its final value λf over the course of several hours (Fig. 1b, and Extended Data Fig. 2a for longer times). Biomass synthesis flux, J = dM/dt, responded rapidly: the final rate of increase was reached within 30 min of the upshift (Fig. 1c). A similar fast response is observed for the synthesis of new RNA and LacZ (Fig. 1d, e), with expression levels (slope of the data) approaching the final value (slope of the dashed lines) within one mass-doubling after the upshift.
Figure 1. Nutrient up- and downshifts.
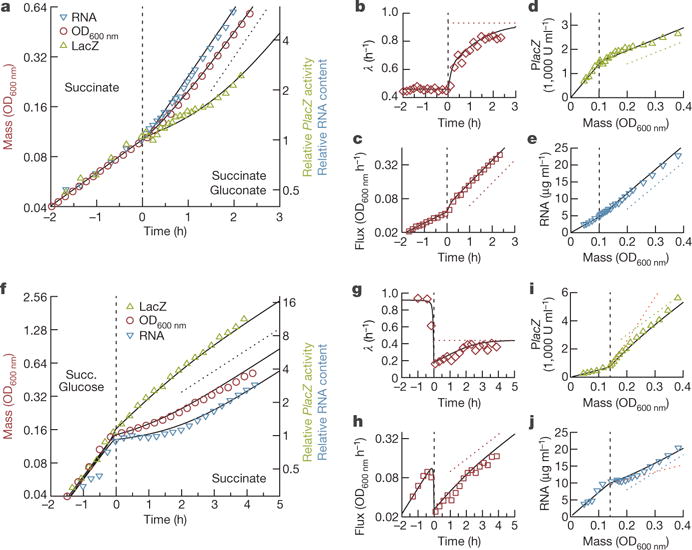
E. coli K-12 grown in minimal medium (and IPTG to induce LacZ) are shifted by the addition of a second nutrient or by the depletion of a nutrient. a–e, Upshift upon addition of a second nutrient: 20 mM succinate (present continuously), 20 mM gluconate (present only after t = 0). f–j Downshift upon depletion of a nutrient: 20 mM succinate (present continuously), 0.03% glucose (depleted around t = 0). a, f, Optical density (OD600 nm, red circles), RNA abundance (RNA amount per culture volume, blue inverted triangles), and LacZ activity per culture volume, both relative to t = 0 (green triangles), are plotted versus time. The slope of the dotted line indicates final growth rates (upshift, λf = 0.98 h−1; downshift, λf = 0.45 h−1). b, g, Instantaneous growth rate λ(t) (red diamonds). Red dotted lines indicate λf. c, h, Time derivative of OD600 nm (biomass flux, red squares). The slope of the dotted line indicates λf. d, e, i, j, Absolute LacZ activity and RNA abundance plotted versus OD600 nm. The slopes of the green and blue lines indicate final expression levels (defined in fractions of the total protein, see Supplementary equation (8) in Supplementary Note 2); the slopes of the orange lines indicate predicted expression levels immediately after the shift. The data are highly repeatable, see Extended Data Fig. 2. In all panels, the black curves are fit-parameter-free predictions of the FCR model, obtained as outlined in Methods.
Next, we characterized the kinetics of nutrient downshifts, resulting from the depletion of a nutrient component in the medium as in Monod’s study of diauxic growth1. Wild-type cells were grown on saturating amounts of succinate and small amounts of glucose (Fig. 1f): as glucose is co-utilized with succinate21, cells first used both carbon substrates and switched to succinate-only after glucose was depleted. At this point, the instantaneous growth rate λ(t) decreased sharply (Fig. 1g). During the recovery, RNA and LacZ (Fig. 1i, j) showed decreased and increased expression levels (slope of the data), respectively, eventually settling to the final level (slope of the dashed lines). Both the upshift and the downshift are highly repeatable (Extended Data Fig. 2b) and similar behaviour has been observed for eight other substrate pairs for upshifts (Extended Data Fig. 3) and four other substrate pairs for downshifts (Extended Data Fig. 4), covering a wide range of initial and final growth rate combinations.
The recovery processes shown in Fig. 1 are controlled by regulatory interactions. Despite an abundance of molecular knowledge, particularly regarding the regulation of ribosome synthesis by guanosine tetraphosphate (ppGpp)13,14,16,17 and the regulation of carbon catabolism by the cAMP–cAMP receptor protein (cAMP–CRP) signalling system12,15, quantitative characterization of the dynamics of these regulatory processes is lacking. Models that do not include the dynamics of gene regulation are incapable of consistently describing the different types of recovery kinetics after different nutrient shifts (Supplementary Note 1 and Extended Data Fig. 5). Here we introduce a coarse-grained kinetic model that quantitatively incorporates the regulation of catabolism and protein synthesis, despite the lack of kinetic parameters describing the molecular processes. We assume that the kinetics of growth recovery is limited by the abundances of a number of key internal metabolites, including ketoacids and amino acids11,22, which we coarse-grain into a single pool of ‘central precursors’, as these metabolites are connected by rapid reversible reactions23. As illustrated in Fig. 2, this precursor pool is filled by carbon influx JC (equation (1) in Fig. 2) and depleted by ribosomes during protein synthesis. Because the translational activity of the ribosomes, σ(t), defined mathematically as the average translation rate24, is set by the precursor pool, we assume it adjusts on a coarsegrained time scale such that the flux of protein synthesis JR balances the carbon influx JC (equations (2a) and (2b) in Fig. 2).
Figure 2. Model of FCR.
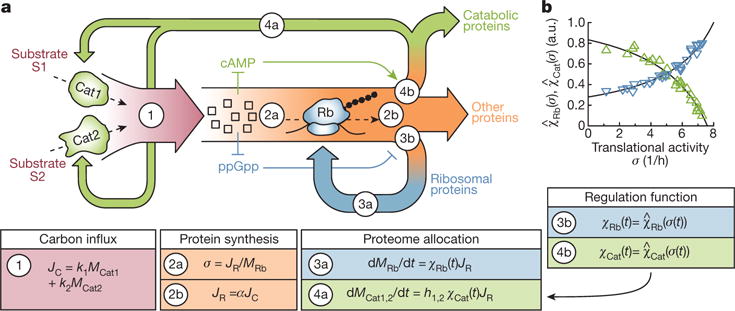
a, Flux balance and allocation of protein synthesis. Carbon substrates S1 and S2 are imported by uptake proteins Cat1 and Cat2 of abundances MCat1 and MCat2 at rates k1 and k2, respectively. Changes in the external concentrations of these substrates result in changes in the carbon influx JC (red, equation (1)), which supplies a pool of central precursors (squares). These precursors are consumed by the ribosomes (Rb) for protein synthesis, the flux of which JR (orange, equation (2b), with α being a conversion factor from carbon to protein) must balance the changes in the carbon influx at a coarse-grained timescale. Attaining this protein synthesis flux for a given number of ribosomes (of abundance MRb) requires changes in the translational activity σ as defined in equation (2a). Molecularly, changes in σ are attributed to changes in the precursor pool16,24. Parts of the protein synthesis flux are allocated to the expression of catabolic and ribosomal proteins, MRb and MCat1,2 (equations (3a) and (4a)). This allocation is determined by the global regulation functions χRb(t) and χCat(t), set molecularly by the precursor pool via ppGpp (blue arrows)13,16 and the cAMP–CRP system (green arrows)15, respectively, as well as the substrate-specific regulation h1,2 (Supplementary Note 3). b, The forms of the regulatory functions and (black lines) can be determined from the known steady-state measurements (Extended Data Fig. 1c, d) as derived in Supplementary Note 2.2d–f. The central simplifying assumption of the model is that the time-dependence of the regulation functions during growth transition is determined solely through the changes in σ, as expressed explicitly in equations (3b) and (4b).
The allocation of protein synthesis is dictated by gene-regulatory functions: an increase in the precursor pool upregulates the synthesis of ribosomes (blue, equation (3a) in Fig. 2) via the function χRb(t), which is controlled by ppGpp signalling13,14,16,17. Concomitantly, the synthesis of catabolic proteins (green, equation (4a) in Fig. 2) is repressed via χCat(t) and controlled by the cAMP–CRP signalling system12,15. Hence both regulatory functions depend on the precursor pool, which also sets the translational activity σ. These observations led us to formulate our key approach, which closes the model equations and renders them independent of molecular details: we use the translational activity σ(t) to set the regulatory functions χRb(t) and χCat(t) via the steady state relations, and . The latter are shown in Fig. 2b and are obtained from the previously characterized ‘growth laws’15,18 (Extended Data Fig. 1c–g). This is stated explicitly in equations (3b) and (4b) in Fig. 2 and amounts to a quasi-steady state assumption (Supplementary Notes 3 and 4). By construction, the resulting coarsegrained model does not attempt to address very rapid kinetic processes, for example, ribosomal oscillation during upshift to rich medium25. However, it describes the kinetics of cell growth and gene expression on slower timescales, for example, from around ten minutes until the attainment of the new steady state, provided that the growth transitions do not involve prolonged periods of growth arrest8, which would invalidate the quasi-steady-state approximation.
We refer to this model of gene regulation as flux-controlled regulation (FCR), because the key dynamic variable σ(t), which controls gene expression via the regulatory functions χRb and χCat (equations (3a) and (4a) in Fig. 2), is set by the condition of flux balance (equations (2a) and (2b) in Fig. 2). Combining all the equations shown in Fig. 2 (detailed in Supplementary Note 4.1), we obtain a single nonlinear differential equation describing the kinetics after the shift (t > 0):
| (5) |
where and are the regulatory functions given in Fig. 2b. equation (5) can be solved analytically (Supplementary Note 4.2). The timescale of this logistic-like equation is set by the rate μf, which characterizes the maximal carbon uptake rate in the post-shift medium; its value can be fixed through its relation with the steady-state growth rate λf in the post-shift medium, μf ≡ λf/(1 − λf/λC), where λC = 1.17 h−1 is a known, strain-specific constant of the growth laws (Extended Data Fig. 1d and Supplementary Note 2.3). The time courses of mass M(t), ribosomes MRb(t), and all other quantities introduced in Fig. 2 can be obtained analytically from the FCR model (Supplementary Note 4.4 and Methods). For many macroscopic observables, a second timescale set by λf emerges after the dynamics of equation (5) have relaxed, due to slow growth-mediated dilution of the inherited proteome.
The solution also requires the specification of the initial condition σ(0), the translational activity directly after a shift. For upshifts, this depends on the abundance of the uptake system Cat2 (for the newly added substrate) at the time of the upshift, as a sudden increase in carbon influx due to pre-expressed Cat2 leads to an abrupt increase in σ(0). Many uptake systems are not expressed in the absence of their cognate substrates, so that biomass flux J(t) and σ(t) are continuous, and the solution of equation (5) is able to describe the entire upshift kinetics without any adjustable parameters (Fig. 1a–e and Extended Data Fig. 3, black panels).
In some instances, we observe an abrupt jump in biosynthesis flux J(t) at the instant of upshift (see, for example, Extended Data Fig. 6), possibly owing to the expression of Cat2 during pre-shift growth. Such pre-expression can be accommodated in the FCR model by changing the initial condition σ(0) (Extended Data Fig. 6, black lines). By synthetically pre-expressing Cat2 during pre-shift growth, the magnitude of the abrupt jump of flux J(t) at the moment of the shift can be systematically varied, even to the extent at which the instantaneous growth rate transiently overshoots that of the post-shift state (Extended Data Fig. 7a, b). For these cases, the FCR model quantitatively predicts the magnitude of the flux jump, as verified in Extended Data Fig. 7d.
The same FCR model quantitatively captures the very different dynamics of downshifts between co-utilized carbon substrates (Fig. 1f–j and Extended Data Fig. 4, black lines). Here, Monod kinetics with established Michaelis constants were used to model carbon substrate depletion (Supplementary Note 4.2a), again without adjustable parameters. The magnitude of the drop of flux and growth rate after substrate depletion is determined by the expression level of Cat2, which is downregulated during growth on both substrates compared to substrate S2 only (Supplementary Note 4.2d and Supplementary equation (57)). The FCR model was further expanded to capture the growth shift between hierarchically used carbon substrates, specifically the paradigmatic glucose-lactose diauxie1 (Fig. 3). Here, inducer exclusion26 prevents the uptake of lactose and the expression of the lac operon as long as glucose is present and taken up. Without invoking the details of how precisely inducer exclusion is removed, we introduced the switch-on time of the lac operon as the lone fitting parameter (Supplementary Note 3.2g) and find that the FCR model accurately describes the glucose–lactose diauxie also (Fig. 3, black lines).
Figure 3. Diauxic shift between hierarchically used carbon substrates.
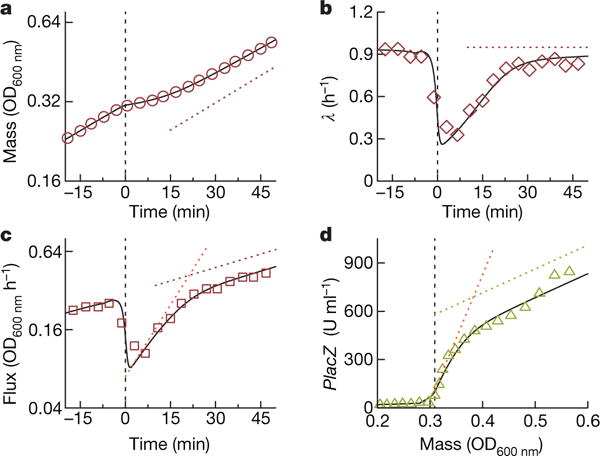
a, E. coli K-12 grown on 0.03% glucose and 0.2% lactose. Initially, only glucose is used1. Around time t = 0 glucose was depleted and lactose uptake and metabolism were activated. The dotted red line indicates the growth rate on lactose only, λf = 0.95 h−1. b, The instantaneous growth rate λ(t) dropped abruptly after glucose depletion, followed by a rapid recovery to λf (dotted horizontal line). c, After glucose depletion, biomass flux increased at an increased rate, before settling to the final rate. The slope of the red dotted line indicates λf, the slope of the orange dotted line indicates μf d, Lactose catabolic enzyme LacZ (green triangles) is tightly repressed before the shift (98 U ml−1 at OD600 nm), then increases rapidly after the shift, before settling at the final expression level indicated by the slope of the green dotted line (1,557 U ml−1 at OD600 nm, obtained from steady-state growth in lactose only). The dotted orange line, with slope μf/λf × 1,557 U ml−1 OD600 nm = 7,866 U ml−1 OD600 nm, is the predicted response immediately after shift according to Supplementary equation (18) of Supplementary Note 2. The black curves are full predictions of the FCR theory using the timepoint of lac operon activation as the single fitting parameter (see Supplementary Note 3.2g).
The quantitative agreement of the model output with the measured observables is remarkable, given the simplicity of the model, and especially the lack of free parameters. As discussed in Extended Data Fig. 8, upshifts and downshifts show different recovery kinetics, despite being controlled by the same underlying regulatory strategy. In upshifts, the reallocation of protein synthesis quickly settles (Extended Data Fig. 8a, dashed lines), and recovery is dominated by growth-mediated relaxation of the abundances of catabolic proteins and ribosomes towards their final states. In downshifts, the phase of active reallocation of protein synthesis spans the entire recovery (Extended Data Fig. 8b, dashed lines). Owing to their different adaptation, upshifts are dominated by the timescale λf−1, whereas downshifts are dominated by μf−1 (Supplementary Note 6 and Extended Data Fig. 9), explaining why the diauxic shift of Fig. 3 (μf = 5.1 h−1) relaxes fivefold faster than the upshift of Fig. 1 (λf = 0.98 h−1). In both shifts, the regulatory functions do not slide along the steady-state lines, despite being derived from them (Supplementary Note 2; compare the black and the coloured lines in Extended Data Fig. 8c).
The complete recovery after nutrient shifts is surprisingly slow, considering that the number of desired proteins needed to overcome the metabolic bottleneck is small; for example, Cat2 for upshift and Cat1 for downshift comprise no more than a few per cent of the entire proteome. They should thus take only a few per cent of the doubling time to synthesize, if cells direct protein synthesis exclusively to the limited number of bottleneck proteins, as proposed by recent theories of optimal growth transition strategies27,28. Instead, according to the FCR model, cells adopt a regulatory strategy featuring coordinated global remodelling of the proteome well beyond the adjustment of a few specific proteins, but including, for example, a large number of anabolic and catabolic proteins unrelated to the specific sugars in the medium. Indeed, the FCR model makes quantitative predictions for the proteome remodelling dynamics: classifying the proteome according to the steady-state response under carbon limitation19, we group proteins increasing, decreasing or not changing under carbon limitation by C↑, C↓, and C− ‘sectors’, respectively. Because catabolic proteins belong to C↑ and ribosomes belong to C↓19, the dynamics of these proteome sectors, allocated by the regulatory functions χC↑ and χC↓., are specified in the FCR model by the regulatory functions χCat(t) and χRb(t) according to the relation equations (6a) and (6b) in Extended Data Fig. 8d, with all constants fixed by the steady-state proteome partitioning (Supplementary Note 5). The dynamics of the sectors C↑ and C↓, manifested by changes in the total mass fractions of all proteins in these sectors denoted by φC↑(t) and φC↓(t), are then prescribed by equations (7a) and (7b), shown in Extended Data Fig. 8d. The resulting sector dynamics for upshifts and downshifts are qualitatively sketched in Extended Data Fig. 8e and f, respectively.
We tested these predictions by extending the quantitative mass spectrometry approach19 to the kinetic regime. Figure 3a shows the time-dependent changes in the abundance of hundreds of proteins during the up- and downshifts presented in Fig. 1. We observe that the dynamic response of the proteins is in line with their steady-state categorization: after a carbon downshift, C↑ proteins increased (green) and C↓ proteins decreased (red), whereas the opposite occurred in upshift. The majority of C− proteins showed little to no response to nutrient shifts. The change of protein abundance is dominated by protein expression and growth-mediated dilution, as degradation plays a negligible role during the transition (Extended Data Fig. 10). We estimated the total abundances of proteins belonging to each of these three sectors (see Methods), and plotted their time dependences following up- and downshift (Fig. 4b, c). Their dynamics closely follow the model predictions (lines) throughout the transitions. The same approach was applied to characterize the total abundances of proteins belonging to various major metabolic pathways or functional groups (Fig. 4d and Methods). The dynamics of these groups in upshifts and downshifts largely followed the model predictions too, except for motility proteins, which clearly exhibited a delay under nutrient downshift.
Figure 4. Proteome composition during recovery.
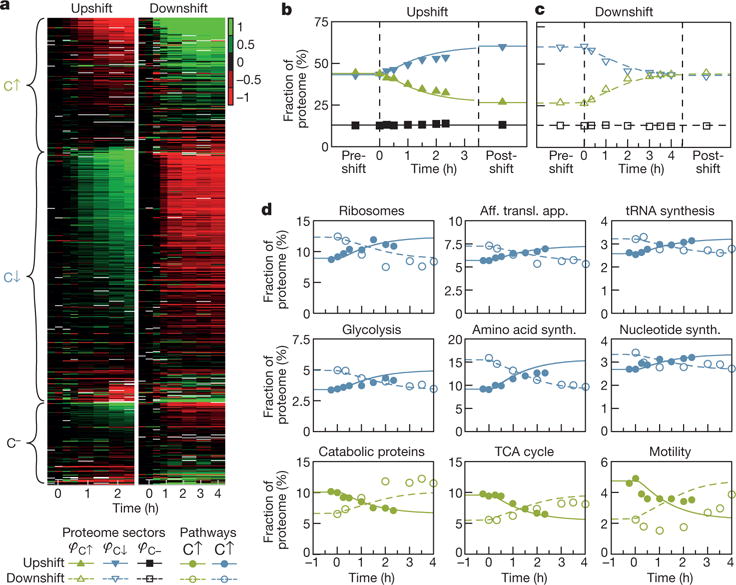
a, Expression of individual proteins during the up- and downshift of Fig. 1, relative to the pre-shift steady state (colour scale: log2). Proteins are grouped according to their steady-state response (see Methods) to decreasing growth rate by carbon limitation: C↑ (increase; green), C↓ (decrease; blue) and C− (no response; black)19. b, c, Absolute proteome fractions of the protein sectors φC↑, φC↓ and φC− (symbols) and fit-parameter-free prediction (lines), derived under the assumption that all proteins in sectors C↑, C↓ and C− follow simple rules of global allocation (Extended Data Fig. 9 and Supplementary Note 5). d, Mass fraction of individual pathways or protein groups during upshift (solid lines and symbols) and downshift (dashed lines and open symbols). Colours denote sector affiliation. All biosynthetic pathways follow the theoretical prediction assuming co-regulation. Motility expression (bottom right) is a clear exception, showing a 2 h delay increase during recovery from downshifts, when compared to the expected increase in expression (dashed line). TCA, tricarboxylic acid.
The quantitative matches of the model predictions with the proteome data without adjustable parameters suggest that much of the proteome is indeed co-regulated, governed by a single dynamic control variable as assumed in the model throughout the growth shifts. In our model, this dynamic variable is the translational activity σ(t), which is itself a proxy for the central metabolite pool (for example the ketoacids and amino acids) as illustrated in Fig. 2a. Because, molecularly, the control is exerted via the messengers cAMP12,15 and ppGpp13,14,16,17, our results suggest that these two signalling pathways are tightly coupled via the central metabolite pool15,22, which is the proposed driver of global regulatory control. Notably, even pathways not known to be directly regulated by cAMP or ppGpp, for example amino acid synthesis, are seen to follow the predicted global response following carbon shifts, possibly due to competition for transcriptional or translational resources16,17.
Despite the central regulatory roles of these signals, the growth transition kinetics are not sensitive to the kinetic details of these signalling pathways, as evidenced by the predictive power of the FCR model that does not explicitly include signalling. Rather, the kinetics are governed by the slower timescales of global reallocation of protein synthesis and growth-mediated dilution. The observed resource-allocation strategy maintains global coordination of the proteome, instead of sequentially prioritizing the expression of various bottlenecks27,28. This conservative control strategy may be more robust by confining the metabolic bottleneck to the central precursors, which drive global regulatory control (Fig. 2a). Quantitative understanding of proteome-remodelling kinetics is a prerequisite for predicting cellular dynamics, such as the dynamics of genetic circuits or growth in response to stresses, making the framework established here foundational in understanding a broad spectrum of other kinetic phenomena.
METHODS
No statistical methods were used to predetermine sample size. The experiments were not randomized and the investigators were not blinded to allocation during experiments and outcome assessment.
Growth medium
All growth media used in this study were based on N—C— minimal medium29, containing K2SO4 (1 g), K2HPO4·3H2O (17.7 g), KH2PO4 (4.7 g), MgSO4·7H2O (0.1 g), and NaCl (2.5 g) per litre. The medium was supplemented with 20 mM NH4Cl as the nitrogen source, and various carbon sources. 1 mM IPTG was added to media when necessary to fully induce the native lac operon, or 0.1 mM IPTG was added to induce the PLlac-O1 promoter driving XylR for titratable expression of dctA in strain NQ537. The expression of the Pu promoter was activated by the regulator XylR upon induction by 3-methylbenzyl alcohol (3MBA), added at indicated concentrations. Extended Data Fig. 1h, i include steady-state growth rates supported by the medium for all carbon sources used.
Culture procedure
Each experiment was carried out in three steps: seed culture, pre-culture and experimental culture. Cells taken from −80 °C glycerol stock were seeded on an LB Agar plate before the experiment. A single colony was picked and grown on fresh LB in a shaken water bath at 37 °C and 250 r.p.m. Media in the pre-culture were chosen to be identical to the experimental culture. Inoculation of the pre-culture with washed seed culture was chosen such that the pre-culture grown overnight were still growing exponentially on the morning of the experiment. Cells were kept for at least ten doublings (at least five for growth rates below 0.4 h−1) in the pre-culture at 37 °C, shaken at 250 r.p.m. Inoculation into pre-warmed experimental culture in the morning was chosen such that cells spent at least an additional 3 doublings at 37 °C with shaking at 250 r.p.m. in the experimental culture before growth was measured.
For small culture volumes, 5 ml of experimental culture was grown in 20 mm × 150 mm glass test tubes. For larger volumes, 25 ml (100 ml) was grown in 125 ml (500 ml) baffled Erlenmeyer flasks. At each time point, a 200-μl sample was extracted and the optical density was measured using a 1 mm path length Starna Sub-Micro cuvette at 600 nm in a ThermoScientific Genesys 20 spectrophotometer.
High-precision optical density data shown in Fig. 1 were obtained using a flow-cell set-up. An experimental culture, 25 ml in volume, was shaken at 37 °C and 250 r.p.m. in a 125 ml baffled Erlenmayer flask in an air incubator. A peristaltic pump was used to circulate medium through a flow-cell cuvette. OD600 nm was measured using an LED light source (592 nm) and a photodetector controlled by a microcontroller. All instruments and tubing were kept at 37 °C inside the air incubator.
Strains
All strains used in this study are derived from wild-type E. coli K-12 strain NCM372230 and are summarized in Extended Data Fig. 1j. Titratable dctA expression strain was constructed as described previously15. In brief, the region containing the km gene and Pu promoter was PCR-amplified from plasmid pKDPu and integrated into the chromosome of E. coli strain NQ351 upstream of dctA (− 1 to − 182 bp relative to translational start point of dctA), by using the λ Red system31. The resulting km-Pu-dctA in the above strain was transferred into strain NQ386 containing PLlac-O1-xylR by P1 transduction, resulting in strain NQ530. To construct a titratable lacZ expression strain, km-Pu-lacZ in Supplementary equation (40) was transferred into strain NQ386 by P1 transduction, resulting in strain NQ537. Strains NQ381 and NQ399 have been described previously16. A dctA knockout was transferred from JW3496-1 to NCM3722 via P1 transduction to yield strain NQ1324.
β-galactosidase quantification
The β-galactosidase quantification is based on the Miller assay32 and used as described previously15.
Total RNA quantification
The RNA quantification method is based on the method used as described previously33 with modifications as described15.
Total protein quantification
Total protein was quantified using a commercial microBCA assay. In summary, 1 ml samples were collected via centrifugation and stored at −80 °C until the analysis. For the analysis, cells were washed again and resuspended in N—C— medium and diluted 1:10. Next, 200 μl of diluted sample and 200 μl of microBCA working reagent were incubated at 60 °C in a water bath. After 1 h, samples were put on ice, cell debris was removed via centrifugation and absorbance at 592 nm was recorded. Each analysis was calibrated individually using bovine albumin serum standards.
Dry mass quantification
150 ml cell culture was grown in baffled 250 ml flasks to an OD600 nm of about 0.5 at 37 °C in a water-bath shaker. Triplicates of 50 ml cell culture were subsequently collected, cooled by shaking in an ice–water bath, and concentrated via centrifugation. Supernatants were recorded at every step and subtracted from the OD600 nm reading. The resulting pellet was transferred to 1.5 ml tubes and dried at 80 °C overnight. The resulting mass of the pellet was determined with a high-precision balance.
Growth transition mass spectrometry protocol
We used quantitative mass spectrometry to analyse the kinetic series of the up- and downshift shown in Fig. 1. Over approximately two doublings, we collected two pre-shift and six logarithmically spaced post-shift samples for each kinetic transition, each containing the equivalent biomass of 1 ml liquid culture at OD600 nm = 1, collected by centrifugation at 17,000g for 2 min. To enable light/heavy relative quantitation using mass spectrometry, we prepared a 15N stable-isotope labelled reference containing a 1:1 (w/w) mixture of steady-state glucose and succinate-minimal medium cultures grown in the presence of 15NH4Cl.
After resuspension in pure water, 100 μl of the mixed 15N reference containing the equivalent of 1 ml liquid culture at OD600 nm = 1 cell biomass was added to each sample cell pellet previously stored at −20 °C. Subsequent sample processing, including TCA precipitation, cysteine reduction, alkylation, tryptic digestion, and desalting procedures, was performed as previously described24.
Tryptic peptides were separated on an Eksigent NanoLC Ultra system coupled to a Sciex 5600 TripleTOF system and analysed in data-dependent shotgun mode (250 ms MS1 scan, followed by 40 cycles of 150 ms MS2 scans)24. Each sample was injected twice, yielding two technical replicates.
As described previously24, vendor WIFF-format instrument data files were converted to profile and centroid MZML formats using Sciex software. Using the Trans-Proteomic Pipeline34, centroided mzML files were converted to mzXML and searched using X!Tandem35 against a custom E. coli database (derived from UniProt organism 83333). The MS2 search results were combined into raw and consensus spectral libraries using SpectraST.
MS1 intensity envelopes containing 14N (light) - and 15N (heavy)-labelled ions were fit using a least-squares Fourier transform convolution algorithm19 implemented using isodist36 as implemented in the Perl program massacre37. Relative 14N/15N ratios were corrected for unbalanced 15N-reference pipetting by the quotient of the cumulative light (sample) and heavy (reference) X!Tandem spectral counts for E. coli peptides on a per-sample basis. Absolute protein expression (that is, the fraction of the total protein mass that is a specific protein) was estimated by spectral counting of X!Tandem peptide–spectrum matches.
For each upshift and downshift, the time series of ‘absolute expression data’ can be represented in the form of an expression matrix Em,n, with the time series (n = 1…8) along the columns, and the number of proteins, m, as rows.
Proteins previously classified to increase, decrease or show no response under carbon limitation19 were classified as the C↑, C↓ and C− sectors. 24 proteins not detected previously19 were classified according to the nearest distance of their linear response (average of both upshift and downshift) and the average linear response of proteins belonging to each sector.
Data shown in Fig. 4a use relative expression data, which were obtained by normalizing the ‘absolute expression data’ to the pre-shift expression data (average of one data point at t = −15 min, and a second data point immediately before the shift). If both pre-shift entries were empty, data could not be normalized and were removed from the analysis. Additionally, to focus on high-quality expression data, rows (protein) with more than four empty entries were removed, yielding a total of m = 647 proteins, which are provided in Supplementary Table 1. Data were log2 transformed and plotted as a heat map in Fig. 4a.
Data shown in Fig. 4b, c use ‘absolute expression data’ (that is, absolute mass fractions of proteins). Single-protein data are provided in Supplementary Table 2. The abundance of a sector X at time entry n, φX,n, was calculated by summing protein expression pm,n over all entries m, under the condition that protein m is an element of the sector X, and is provided in Supplementary Table 3. Protein groups were calculated analogously to the protein sectors; the mass fraction of all protein groups was approximately 60% of the proteome. Data are provided in Supplementary Table 4. Classifications of proteins (sectors and groups) are provided in Supplementary Table 1.
Pulse-labelling mass spectrometry protocol
Cells were grown in N—C— medium with 10 mM 14NH4Cl as the sole source of nitrogen. At the time of glucose exhaustion (downshift) and gluconate addition (upshift), cells were 15N-isotopically labelled by adding a pulse of 15NH4Cl to 10 mM. The pulse allows the differentiation of protein made pre-shift (14N) from protein made post-shift (50% 15N). We collected two pre-shift and six post-shift samples (1 OD600 nm × ml total biomass) for each series. A 15N-isotopically enriched reference was prepared as a 1:1 (w/w) mixture of steady-state succinate- and glucose-minimal-medium cultures grown in the presence of 15NH4Cl and added to each sample as above.
Data acquisition and processing were performed as described in ‘Growth transition mass spectrometry protocol’.
MS1 intensity envelopes containing 14N-labelled (pre-shift) ions, 50% 15N (post-shift) ions, and 100% 15N-labelled (constant reference) ions were quantified using isodist36 to fit a three-species model, including the 50% 15N-labelled envelope.
Application of the FCR model to specific growth shifts
The FCR model is built on the steady-state growth laws (Supplementary equations (9) and (12)), shown in Extended Data Fig. 1c, d and discussed in Supplementary Note 2), which serve as the general input to the model, independent of specific growth shifts. The constants appearing in the linear growth laws (φRb,0, γ, λC) fix the parameters appearing in the regulatory functions and (Supplementary equations (28) and (29)), which enter the central equation of the translational activity σ(t) in equation (5) (or Supplementary equation (43)). Additionally, the FCR model requires growth-shift-specific parameters: the initial growth rate λi, and the final growth rate λf. The final growth rate λf fixes the parameter μf (appearing in equation (5)), which describes the quality of the post-shift nutrient, via the growth laws (Supplementary equation (17)).
The initial condition of the translational activity σ(0), as defined in Supplementary equation (50), is determined by the type of shift, and can lead to markedly different transition kinetics. For upshifts without pre-expression between co-utilized carbon sources, the initial condition σ(0) equals the pre-shift value σi, determined by the pre-shift growth rate, λi see Supplementary equation (52). For upshift with pre-expression, the initial condition σ(0) requires fitting of the pre-expression level, see Supplementary equation (54). For downshifts between co-utilized carbon substrates, the initial condition σ(0) is set by the carbon influx of the remaining substrate, which can be calculated from the initial and final growth rates, λi, and λf, and the growth laws, see Supplementary equation (56). For downshifts between hierarchically used carbon substrates, the initial condition σ(0) requires fitting one parameter.
Pre-shift growth of all variables is determined by the initial growth rate λi and the growth laws, see Supplementary equations (58)–(64). Post-shift growth is calculated from the time-dependent solution of σ(t) (obtained analytically as Supplementary equation (49)); the solution is used to derive the general analytical solutions for all other dynamic quantities, including the abundance of ribosomes (MRb(t), Supplementary equation (66)) catabolic protein (MCat(t), Supplementary equation (73)), biomass synthesis (JR(t), Supplementary equation (68)), biomass (M(t), Supplementary equation (76)), and growth rate (λ(t), Supplementary equation (77)); see Supplementary Note 4.4 for the derivation of these results. If carbon uptake is substrate-limited (Supplementary equations (19) and (20)), as occurs when the concentration of a substrate is reduced to very low levels, then the model can only be solved numerically (Supplementary Note 4).
Data availability
The data that support the findings of this study are available from the corresponding author upon reasonable request.
Extended Data
Extended Data Figure 1. Growth laws.
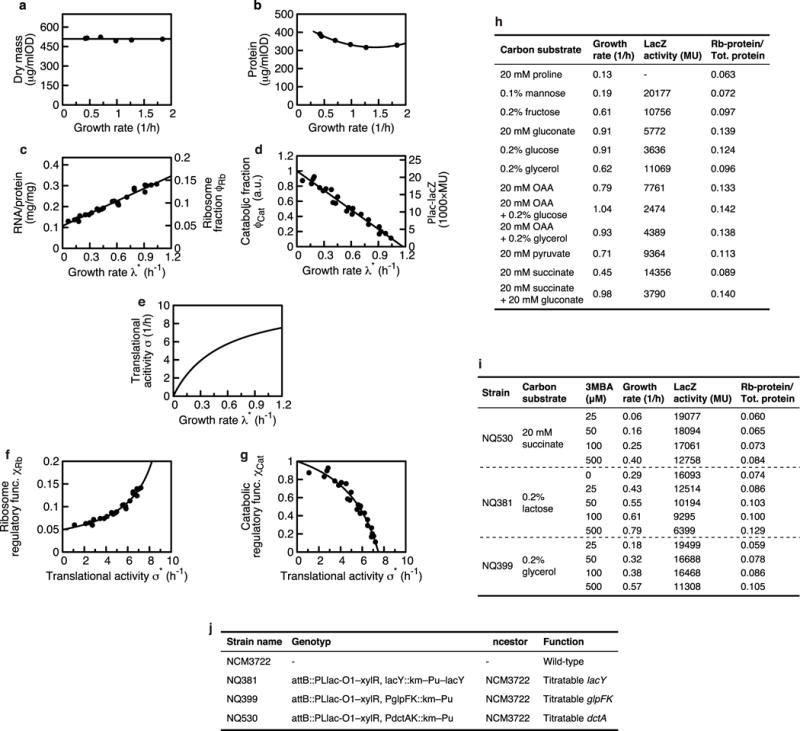
a, Dry mass per optical density OD600 nm is independent of the growth rate in the investigated conditions with an average of 509 μg dry weight per ml × OD600 nm value (black line). b, Protein mass per optical density OD600 nm shows a slight dependence on growth rate (black line: guide to the eye), in accordance with the increase of RNA and DNA in the cell at higher growth rates38. Because the change is small in the range of growth rates of the up- and downshifts presented, we take the conversion from dry mass to total protein to be constant throughout the shifts presented. Dry mass and total protein data taken from ref. 39. c, Ribosomal proteome fraction of the cell at steady-state growth at rate λ*, using RNA or protein as a reporter. The data are fitted with the linear relation with φRb,0 = (0.049 ± 0.02) and γ = (11.02 ± 0.44) h−1. d, Catabolic proteins were measured with LacZ (induced with 1 mM IPTG) as a reporter and measuring Miller units (MU) (right axis; see ref. 32 for MU). The linear relation was fitted with with and λC = (1.17 ± 0.05)h−1. e, The translational activity σ* is calculated from (c) as . f, g, Regulatory functions and , functions of the translational activity σ*, are calculated by substituting λ* by σ* from the fits in c and d (see Supplementary equations (28) and (29)). h, i, Tables show all data plotted in c and d. Data in h were measured by growth on different carbon substrates, data in i were measured by growth of strains with titratable transporter expression, see list of strains in j.
Extended Data Figure 2. Long-term dynamics and repeatability.
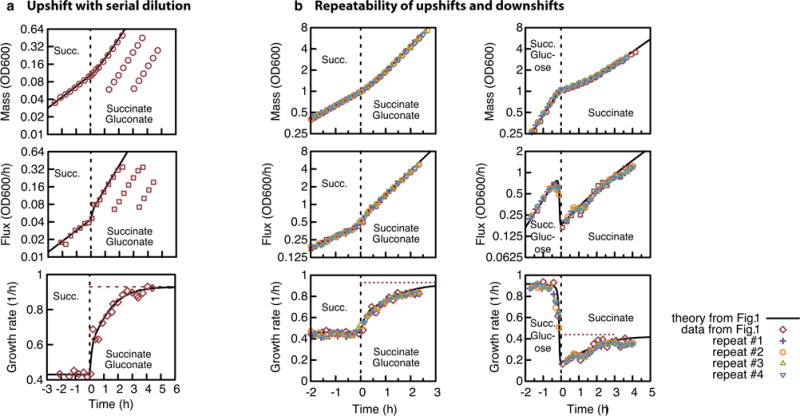
a, Serial dilution experiment of the upshift of Fig. 1 (succinate, add gluconate). The top graph shows optical density OD600 nm as a measure of biomass M(t), the middle graph shows biomass flux J(t), and the bottom graph shows the growth rate λ(t) = J(t)/M(t). Shortly after the upshift, the cell culture was diluted 4- and 16-fold in fresh medium, grown in parallel to the original culture, and the optical density was recorded for the diluted cultures once they reached an optical density of around 0.05. As the growth rate is independent of the cell density, data from the original and the diluted cultures collapse, showing that for longer times the growth rate reaches its final level (dashed line). b, Repeatability. Biomass (top), flux (middle) and growth rate (bottom) for (left to right) the upshift from Fig. 1a–e and the downshift shown in Fig. 1f–j. Theory (black line) and data (red diamonds) are identical to Fig. 1. Four independent repeats (purple, orange, green and blue) are plotted on top of the data shown in Fig. 1.
Extended Data Figure 3. Upshifts from succinate and pyruvate.
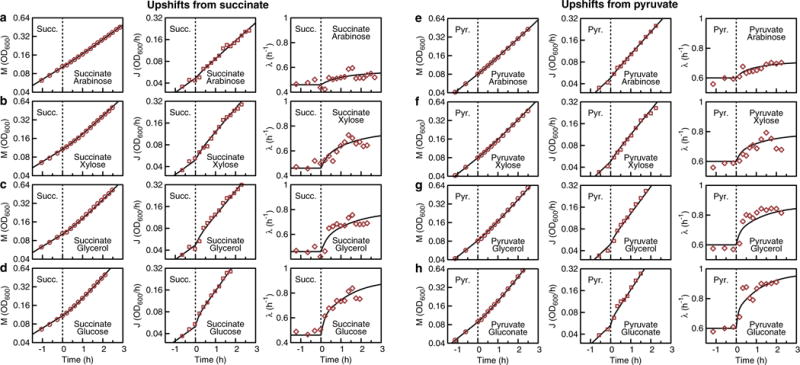
a–h, NCM3722 grown exponentially on 20 mM succinate (succ.) or 20 mM pyruvate (pyr.) as the sole carbon substrate. At t = 0 a second, subsequently co-utilized carbon substrate was added: 0.2% arabinose (a, e); 0.2% xylose (b, f); 0.2% glycerol (c, g); 0.2% glucose (d); 20 mM gluconate (h). The left panels show optical density OD600 nm (a measure of biomass M(t), red circles), the middle panels show the derivative of OD600 nm (a measure for biomass flux J(t), red squares), and the right panels show growth rate (λ(t) = J(t)/M(t), red diamonds). Theory lines for M(t), J(t) and λ(t) were calculated using Supplementary equations (76), (70) and (77), using the initial condition Supplementary equation (52) for upshift without pre-expression. Initial and final growth rates were measured during steady-state growth on the respective carbon substrates.
Extended Data Figure 4. Downshift with co-utilized carbon substrates.
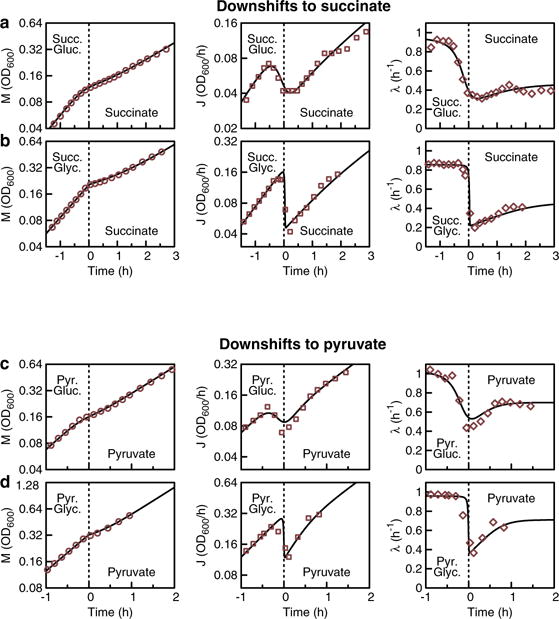
a–d, NCM3722 grown exponentially on 20 mM succinate (succ.) (a, b) or 20 mM pyruvate (pyr.) (c, d), combined with either 0.56 mM gluconate (gluc.) (a, c) or 1.11 mM glycerol (glyc.) (b, d). At around t = 0, gluconate or glycerol were depleted. The left panels show optical density OD600 nm (a measure of biomass M(t), red circles), middle panels show the derivative of OD600 nm (a measure for biomass flux J(t), red squares), and right panels show the growth rate (λ(t) = J(t)/M(t), red diamonds). Theory lines for M(t), J(t) and λ(t) were calculated solving the differential equation for the translational activity σ(t) (Supplementary equation (22)), and those defining the internal fluxes and protein content (Supplementary equations (19)–(21) and (22)–(24)) numerically. The uptake of the depleting substrate (glycerol or gluconate) was calculated from Supplementary equation (20), using the Michaelis constants Km = 212 μM (gluconate40) and Km = 5.6 μM (glycerol41). Since gluconate transport has a low affinity, it depletes slowly (see a and c), which is accurately described by our modelling of catabolism. Initial and final growth rates were measured during steady-state growth on the respective carbon substrates.
Extended Data Figure 5. Performance of models of growth kinetics without gene regulation.
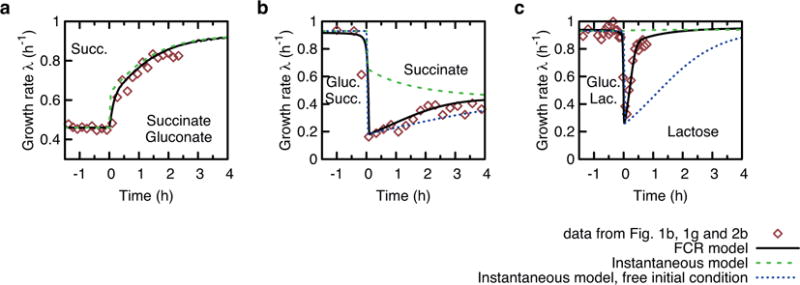
a–c, This figure shows the result of three nutrient shifts discussed in the main text: Succinate-gluconate upshift from Fig. 1b (a); Succinate–glucose downshift from Fig. 1g (b); Glucose–lactose diauxie shift from Fig. 3b (c). Experimental data are shown as red symbols. Among existing models of growth transition, the one proposed by Dennis and Bremer allows for predicting growth transitions of upshifts42. This model assumes that the flux jumps instantaneously to the final state without a regulatory scheme (see Supplementary Note 1 for a review). Predictions of this model, referred to here as the ‘instantaneous model’ are shown as the green dashed lines in all panels. Although the instantaneous model works well for upshifts (panel a), for which it was developed42, it fails to describe downshifts (panels b and c), because it cannot describe a flux decrease. The instantaneous model cannot be fixed by matching the flux after glucose depletion (blue dotted lines in panels b and c), as it underestimates the recovery rate owing to a lacking regulatory scheme (Supplementary Note 1). By contrast, the FCR model introduced in this work, based on an active reallocation of protein synthesis during growth transitions, predicts the correct recovery rates (black solid lines) consistently for both up- and downshifts.
Extended Data Figure 6. Upshift from mannose.
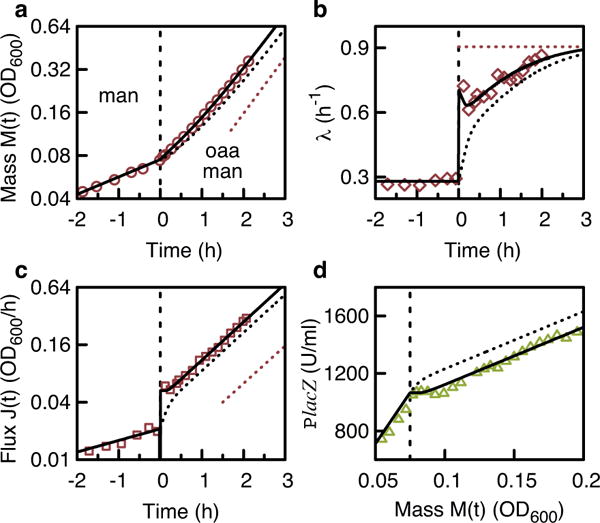
a–c, NCM3722 grown exponentially on 0.1% mannose as the sole carbon substrate. At t = 0 (dashed line) oxaloacetic acid (OAA), subsequently co-utilized, is added. Optical density OD600 nm (a measure of biomass M(t), red circles) (a), the derivative of OD600 nm (a measure of biomass flux J(t), red squares) (b), growth rate (λ(t) = J(t)/M(t), red diamonds) (c). d, Expression of the catabolic proteins reporter LacZ is transiently repressed after the shift (vertical dashed line). Dotted black lines show solutions of the theory using the initial condition for no pre-expression (Supplementary equation (52)), which does not coincide with the experimental data (symbols). Using the initial condition for pre-expression (Supplementary equation (54)) and fitting the pre-expression level, the theory (black lines) describes the data very well, including the transient repression of LacZ in d. LacZ activity units U are defined as MU × OD600 nm.
Extended Data Figure 7. Effect of pre-expression on upshift kinetics.
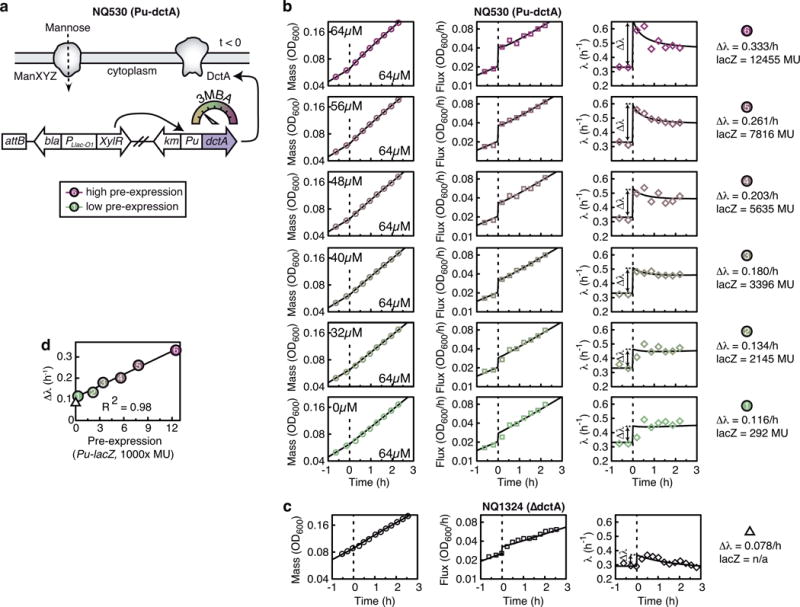
a, E. coli NQ530 grown exponentially in mannose minimal medium with different levels of succinate transporter (DctA) pre-expressed via the titratable Pu promoter (regulator: XylR, inducer: 3MBA). At time t = 0, medium was supplemented with 20 mM succinate and DctA expression is set to a common level for all upshifts. b, Biomass M(t) (OD600 nm), biomass flux J(t) (derivative of OD600 nm) and growth rate λ(t) for different levels of pre-expression (3MBA concentration indicated in panels). DctA preexpression positively affects post-shift growth. The biomass flux J(t) (middle) shows a saltatory increase followed by exponential growth at final rate λf. For cultures with a high level of pre-expression, the instantaneous growth rate λ(t) (right) transiently overshot before relaxing to the final value λf. The increase is transient because the DctA level in the synthetic construct eventually decreases below the pre-expression level. The kinetic theory quantitatively captures the upshift kinetics for all pre-expression levels, when using the initial condition σ(0) as the single fit parameter (solid lines). (c) NQ 1324 (ΔdctA) shows a small increase in growth rate upon upshift, despite the succinate transporter DctA being knocked out. Final growth rate is not significantly increased over steady-state growth on mannose alone. Steady-state growth rate on succinate alone was barely detectable for NQ1324 (λ ≲ 0.02/h). e, Validation of theoretical prediction. The magnitude of saltatory increase in growth rate Δλ (indicated in the right panels of b, c) depends linearly on the preexpression levels. The saltatory increase of the dctA knockout shown in c is indicated by a triangle.
Extended Data Figure 8. Proteome remodelling.
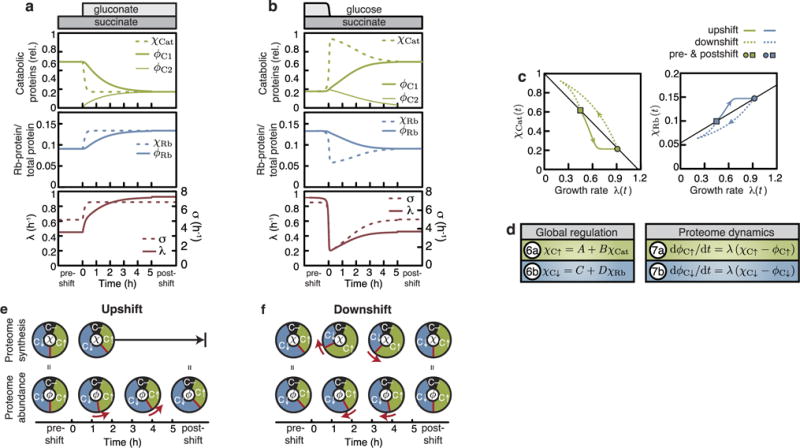
a, b, Regulatory functions χ and protein fractions φ of catabolic proteins (relative to maximal expression), ribosomes (absorbance in mg RNA per mg protein) as well as growth rate λ(t) and translational activity σ(t) during growth shifts for the upshift and downshift of Fig. 1. Soon after upshift the regulatory functions of catabolic proteins χCat(t) and ribosomes χRb(t), driven by the translational activity σ(t) (green, blue and red dashed lines), have relaxed to the final state (a). A new proteome is thus synthesized at the final ratio, leading to a slow convergence to the final state by growth-mediated dilution. The shortfalls of carbon influx after glucose depletion lead to an upregulation of χCat(t) and a downregulation of χRb(t), driven by the translational activity σ(t) (green, blue and red dashed lines) (b). c, The regulatory functions χCat(t) and χRb(t), set by the translational activity σ(t), plotted versus growth rate λ(t). Thin black lines show the steady-state growth laws (Extended Data Fig. 1c, d and Supplementary Note 2). Despite the regulatory functions being derived from the growth laws (black lines), they diverge considerably during growth transitions, as they are controlled by the translational activity σ(t), and not the growth rate λ(t). d, Assuming co-regulation of the proteome sectors C↑ and C↓ with catabolic and ribosomal proteins (equations (6a) and (6b)), the dynamics of the proteome sectors can be described (equations (7a) and (7b); see Supplementary Note 5 for details). e, f, Graphical synopsis of the proteome remodelling of a and b, as predicted by equations (6a), (6b), (7a) and (7b). Red boundary and arrows show dynamics. In upshifts regulatory functions χ rapidly relax to their final states; in downshifts regulatory functions initially overshoot and relax slowly to their final states (see Supplementary Note 6 for extended discussion).
Extended Data Figure 9. Biphasic relaxation kinetics.
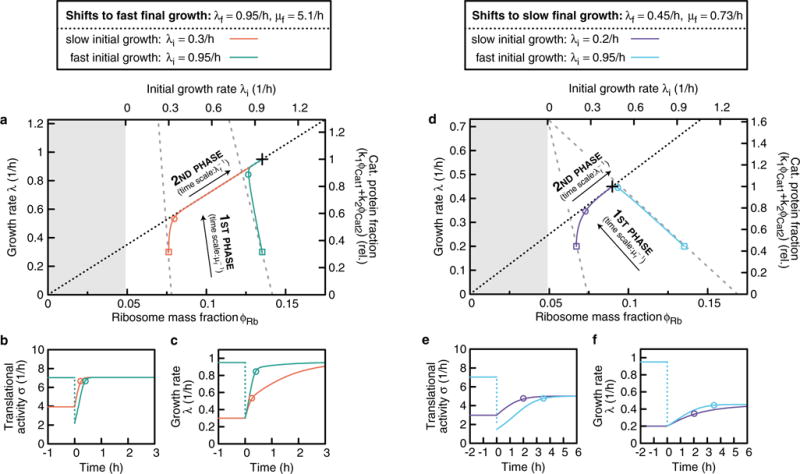
The figure shows the relaxation kinetics for growth shifts, as obtained from the FCR model. a-c, An upshift from slow growth λi = 0.3 h−1 (orange) and a downshift from fast pre-shift growth λi = 0.95 h−1 (green) is seen, both with the same growth rate directly after the shift, λ(0) = 0.3 h−1, and the same fast final growth rate λf = 0.95 h−1. d–f, An upshift from slow growth λi = 0.2 h−1 (orange) and a downshift from fast pre-shift growth λi = 0.95 h−1 (green) is seen, with λ(0) = 0.2 h−1, and the same slow growth rate λf = 0.95 h−1. a, d, The trajectories of the recovery in the space of growth rate (left y-axis), which is proportional to the catabolic protein fraction (right y-axis), and ribosome fraction φRb(t) (bottom x-axis). The initial condition φRb(0) depends on the pre-shift growth rate λi (top x-axis). The trajectories start at the points (φRb(0), λ(0)), indicated by coloured squares, and end at the final state (φRb,f, λf), marked with a black cross. As detailed in Supplementary Note 6, the kinetics are biphasic and can be understood using a simple geometric construction, which yields the dotted and dashed lines (see Supplementary Note 6.2). First, a relaxation associated with a timescale μf−1 (Supplementary equation (116)), along the grey dashed lines, during which protein synthesis contains more catabolic proteins and fewer ribosomes than the final composition of the proteome. The end of this kinetic phase is indicated by circles in all panels. Second, a slow motion along the diagonal dashed line on the timescale λf−1 (Supplementary equation (120)). Along this line, the translational activity, σ(t) = λ(t)/φRb(t), has relaxed to the final state (see b, e), where σ(t) has relaxed after the ‘circles’. As a result, the regulatory functions have relaxed to the final state too, and protein synthesis contains the same amount of catabolic proteins and ribosomes as in the final state. During this second phase, the proteome gradually adapts due to growth-mediated dilution of inherited proteins. c, f, The growth rate almost fully adapts during the first phase (from t = 0 to the circle) for the downshifts (green, cyan), but not for the upshifts (orange, purple). This difference is because of the high ribosome abundance in downshifts, which allows increased expression of catabolic proteins, and thus almost entirely avoids the slow phase, and is more prominent for shifts to fast final growth (a–c), than to slow final growth (d–f).
Extended Data Figure 10. Protein degradation.
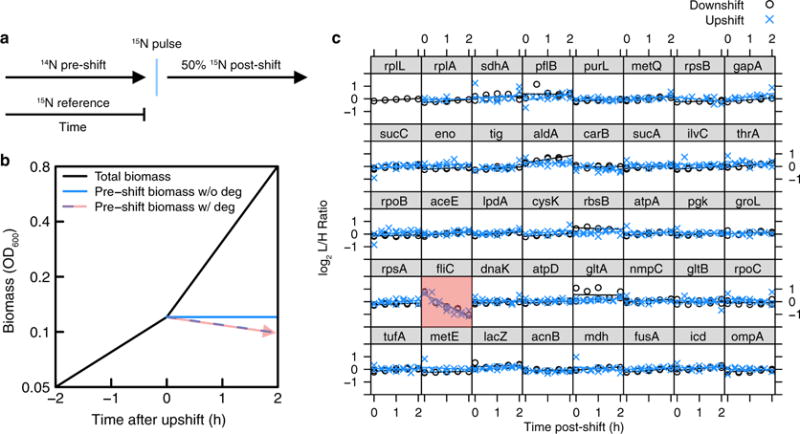
a, Pulse-labelling allows the differentiation of pre-pulse and post-pulse protein mass. We added concentrated 15NH4Cl into the culture at the moment of gluconate upshift or a few minutes before glucose exhaustion during the downshift. Comparing to a third isotope species (spiked-in 15N-reference culture) allows tracking the levels of pre-shift proteins over time. b, A schematic showing the levels of total cellular protein (black) and cellular protein existing at pulse time (blue) as the culture is instantaneously upshifted. Stable protein levels are characterized by a zero-slope line (blue solid line), whereas degrading or exported cellular proteins exhibit a negative-slope line (blue dashed line, red arrow). c, The post-shift levels of 40 cellular proteins of highest mass fraction were quantified using the pulse-labelling approach. Light (L, 14N) over heavy (H, 15N) relative protein levels are plotted as a function of time. These proteins span diverse biological functions, cellular localization, size and structure. Together, they account for 35-40% of the total protein mass detected throughout the shift (estimated by summing their mass abundances listed in Supplementary Table 2 for each condition). With the exception of flagellin (fliC, red box), we did not observe decreasing protein levels for either the upshift or downshift series on the 2-h timescale for large-abundance proteins, which we could confidently quantify. Flagellin is exported to the cell periphery by a dedicated transport system, and probably shed into the medium during steady-state growth. As shed proteins are not collected at the same efficiency as proteins in cells, the decline of pre-labelled FliC serves as a positive control for the method.
Supplementary Material
Acknowledgments
We are grateful to E. Mateescu for initiating this work and to J. Hasty and R. Young for discussions. This work is supported by the National Institutes of Health (NIH; grant 1R01GM109069) and by the Simons Foundation (grant 330378) through T.H., by the NIH (grant 1R01GM118850) through J.R.W., and by the German Research Foundation via the Excellence Cluster ‘Nanosystems Initiative Munich’ and the priority program SPP1617 (grant GE1098/6-2) through U.G.
Footnotes
Online Content Methods, along with any additional Extended Data display items and Source Data, are available in the online version of the paper; references unique to these sections appear only in the online paper.
Supplementary Information is available in the online version of the paper.
Author Contributions
D.W.E., S.J.S., U.G. and TH. designed this study. Growth shifts were performed by D.W.E. and S.J.S. and analysed by S.J.S., D.W.E. and T.H. Quantitative mass spectrometry analysis was performed by V.P. and analysed by S.J.S., VP and J.R.W. D.W.E., S.J.S., U.G. and T.H. developed the model and all authors participated in writing the paper and the Supplementary Information.
Author Information
The authors declare no competing financial interests. Readers are welcome to comment on the online version of the paper.
Publisher’s note: Springer Nature remains neutral with regard to jurisdictional claims in published maps and institutional affiliations.
References
- 1.Monod J. The phenomenon of enzymatic adaptation and its bearings on problems of genetics and cellular differentiation. Growth. 1947;11:223–289. [Google Scholar]
- 2.Kjeldgaard NO, Maaløe O, Schaechter M. The transition between different physiological states during balanced growth of Salmonella typhimurium. J Gen Microbiol. 1958;19:607–616. doi: 10.1099/00221287-19-3-607. [DOI] [PubMed] [Google Scholar]
- 3.Dennis PP, Bremer H. Regulation of ribonucleic acid synthesis in Escherichia coli: An analysis of a shift-up. J Mol Biol. 1973;75:145–159. doi: 10.1016/0022-2836(73)90535-4. [DOI] [PubMed] [Google Scholar]
- 4.Thattai M, Shraiman BI. Metabolic switching in the sugar phosphotransferase system of Escherichia coli. Biophys J. 2003;85:744–754. doi: 10.1016/S0006-3495(03)74517-2. [DOI] [PMC free article] [PubMed] [Google Scholar]
- 5.Kussell E, Leibler S. Phenotypic diversity, population growth, and information in fluctuating environments. Science. 2005;309:2075–2078. doi: 10.1126/science.1114383. [DOI] [PubMed] [Google Scholar]
- 6.Acar M, Mettetal JT, van Oudenaarden A. Stochastic switching as a survival strategy in fluctuating environments. Nat Genet. 2008;40:471–475. doi: 10.1038/ng.110. [DOI] [PubMed] [Google Scholar]
- 7.Boulineau S, et al. Single-cell dynamics reveals sustained growth during diauxic shifts. PLoS One. 2013;8:e61686. doi: 10.1371/journal.pone.0061686. [DOI] [PMC free article] [PubMed] [Google Scholar]
- 8.Kotte O, Volkmer B, Radzikowski JL, Heinemann M. Phenotypic bistability in Escherichia coli’s central carbon metabolism. Mol Syst Biol. 2014;10:736. doi: 10.15252/msb.20135022. [DOI] [PMC free article] [PubMed] [Google Scholar]
- 9.van Heerden JH, et al. Lost in transition: start-up of glycolysis yields subpopulations of nongrowing cells. Science. 2014;343:1245114. doi: 10.1126/science.1245114. [DOI] [PubMed] [Google Scholar]
- 10.Venturelli OS, Zuleta I, Murray RM, EI-Samad H. Population diversification in a yeast metabolic program promotes anticipation of environmental shifts. PLoS Biol. 2015;13:e1002042. doi: 10.1371/journal.pbio.1002042. [DOI] [PMC free article] [PubMed] [Google Scholar]
- 11.Link H, Fuhrer T, Gerosa L, Zamboni N, Sauer U. Real-time metabolome profiling of the metabolic switch between starvation and growth. Nat Methods. 2015;12:1091–1097. doi: 10.1038/nmeth.3584. [DOI] [PubMed] [Google Scholar]
- 12.Kolb A, Busby S, Buc H, Garges S, Adhya S. Transcriptional regulation by cAMP and its receptor protein. Annu Rev Biochem. 1993;62:749–795. doi: 10.1146/annurev.bi.62.070193.003533. [DOI] [PubMed] [Google Scholar]
- 13.Potrykus K, Cashel M. (p)ppGpp: still magical? Annu Rev Microbiol. 2008;62:35–51. doi: 10.1146/annurev.micro.62.081307.162903. [DOI] [PubMed] [Google Scholar]
- 14.Lemke JJ, et al. Direct regulation of Escherichia coli ribosomal protein promoters by the transcription factors ppGpp and DksA. Proc Natl Acad Sci USA. 2011;108:5712–5717. doi: 10.1073/pnas.1019383108. [DOI] [PMC free article] [PubMed] [Google Scholar]
- 15.You C, et al. Coordination of bacterial proteome with metabolism by cyclic AMP signalling. Nature. 2013;500:301–306. doi: 10.1038/nature12446. [DOI] [PMC free article] [PubMed] [Google Scholar]
- 16.Scott M, Klumpp S, Mateescu EM, Hwa T. Emergence of robust growth laws from optimal regulation of ribosome synthesis. Mol Syst Biol. 2014;10:747. doi: 10.15252/msb.20145379. [DOI] [PMC free article] [PubMed] [Google Scholar]
- 17.Hauryliuk V, Atkinson GC, Murakami KS, Tenson T, Gerdes K. Recent functional insights into the role of (p)ppGpp in bacterial physiology. Nat Rev Microbiol. 2015;13:298–309. doi: 10.1038/nrmicro3448. [DOI] [PMC free article] [PubMed] [Google Scholar]
- 18.Scott M, Gunderson CW, Mateescu EM, Zhang Z, Hwa T. Interdependence of cell growth and gene expression: origins and consequences. Science. 2010;330:1099–1102. doi: 10.1126/science.1192588. [DOI] [PubMed] [Google Scholar]
- 19.Hui S, et al. Quantitative proteomic analysis reveals a simple strategy of global resource allocation in bacteria. Mol Syst Biol. 2015;11:784. doi: 10.15252/msb.20145697. [DOI] [PMC free article] [PubMed] [Google Scholar]
- 20.Basan M, et al. Overflow metabolism in Escherichia coli results from efficient proteome allocation. Nature. 2015;528:99–104. doi: 10.1038/nature15765. [DOI] [PMC free article] [PubMed] [Google Scholar]
- 21.Hermsen R, Okano H, You C, Werner N, Hwa T. A growth-rate composition formula for the growth of E. coli on co-utilized carbon substrates. Mol Syst Biol. 2015;11:801. doi: 10.15252/msb.20145537. [DOI] [PMC free article] [PubMed] [Google Scholar]
- 22.Chubukov V, Gerosa L, Kochanowski K, Sauer U. Coordination of microbial metabolism. Nat Rev Microbiol. 2014;12:327–340. doi: 10.1038/nrmicro3238. [DOI] [PubMed] [Google Scholar]
- 23.Reitzer L. Nitrogen assimilation and global regulation in Escherichia coli. Annu Rev Microbiol. 2003;57:155–176. doi: 10.1146/annurev.micro.57.030502.090820. [DOI] [PubMed] [Google Scholar]
- 24.Dai X, et al. Reduction of translating ribosomes enables Escherichia coli to maintain elongation rates during slow growth. Nat Microbiol. 2016;2:16231. doi: 10.1038/nmicrobiol.2016.231. [DOI] [PMC free article] [PubMed] [Google Scholar]
- 25.Gausing K. Ribosomes: Structure, Function and Genetics. Univ. Park Press; 1980. pp. 693–718. [Google Scholar]
- 26.Postma PW, Lengeler JW, Jacobson GR. Phosphoenolpyruvate: carbohydrate phosphotransferase systems of bacteria. Microbiol Rev. 1993;57:543–594. doi: 10.1128/mr.57.3.543-594.1993. [DOI] [PMC free article] [PubMed] [Google Scholar]
- 27.Pavlov MY, Ehrenberg M. Optimal control of gene expression for fast proteome adaptation to environmental change. Proc Natl Acad Sci USA. 2013;110:20527–20532. doi: 10.1073/pnas.1309356110. [DOI] [PMC free article] [PubMed] [Google Scholar]
- 28.Giordano N, Mairet F, Gouzé JL, Geiselmann J, de Jong H. Dynamical allocation of cellular resources as an optimal control problem: novel insights into microbial growth strategies. PLoS Comput Biol. 2016;12:e1004802. doi: 10.1371/journal.pcbi.1004802. [DOI] [PMC free article] [PubMed] [Google Scholar]
- 29.Csonka LN, Ikeda TP, Fletcher SA, Kustu S. The accumulation of glutamate is necessary for optimal growth of Salmonella typhimurium in media of high osmolality but not induction of the proU operon. J Bacteriol. 1994;176:6324–6333. doi: 10.1128/jb.176.20.6324-6333.1994. [DOI] [PMC free article] [PubMed] [Google Scholar]
- 30.Soupene E, et al. Physiological studies of Escherichia coli strain MG1655: growth defects and apparent cross-regulation of gene expression. J Bacteriol. 2003;185:5611–5626. doi: 10.1128/JB.185.18.5611-5626.2003. [DOI] [PMC free article] [PubMed] [Google Scholar]
- 31.Datsenko KA, Wanner BL. One-step inactivation of chromosomal genes in Escherichia coli K-12 using PCR products. Proc Natl Acad Sci USA. 2000;97:6640–6645. doi: 10.1073/pnas.120163297. [DOI] [PMC free article] [PubMed] [Google Scholar]
- 32.Miller JH. Experiments in Molecular Genetics. Cold Spring Harbor Laboratory Press; 1972. [Google Scholar]
- 33.Benthin S, Nielsen J, Villadsen J. A simple and reliable method for the determination of cellular RNA content. Biotechnol Tech. 1991;5:39–42. [Google Scholar]
- 34.Deutsch EW, et al. A guided tour of the Trans-Proteomic Pipeline. Proteomics. 2010;10:1150–1159. doi: 10.1002/pmic.200900375. [DOI] [PMC free article] [PubMed] [Google Scholar]
- 35.Craig R, Beavis RC. TANDEM: matching proteins with tandem mass spectra. Bioinformatics. 2004;20:1466–1467. doi: 10.1093/bioinformatics/bth092. [DOI] [PubMed] [Google Scholar]
- 36.Sperling E, Bunner AE, Sykes MT, Williamson JR. Quantitative analysis of isotope distributions in proteomic mass spectrometry using least-squares Fourier transform convolution. Anal Chem. 2008;80:4906–4917. doi: 10.1021/ac800080v. [DOI] [PMC free article] [PubMed] [Google Scholar]
- 37.Sykes MT, Sperling E, Chen SS, Williamson JR. Quantitation of the ribosomal protein autoregulatory network using mass spectrometry. Anal Chem. 2010;82:5038–5045. doi: 10.1021/ac9028664. [DOI] [PMC free article] [PubMed] [Google Scholar]
- 38.Schaechter M, Maaløe O, Kjeldgaard NO. Dependency on medium and temperature of cell size and chemical composition during balanced grown of Salmonella typhimurium. J Gen Microbiol. 1958;19:592–606. doi: 10.1099/00221287-19-3-592. [DOI] [PubMed] [Google Scholar]
- 39.Basan M, et al. Inflating bacterial cells by increased protein synthesis. Mol Syst Biol. 2015;11:836. doi: 10.15252/msb.20156178. [DOI] [PMC free article] [PubMed] [Google Scholar]
- 40.Tong S, Porco A, Isturiz T, Conway T. Cloning and molecular genetic characterization of the Escherichia coli gntR, gntK, and gntU genes of GntI, the main system for gluconate metabolism. J Bacteriol. 1996;178:3260–3269. doi: 10.1128/jb.178.11.3260-3269.1996. [DOI] [PMC free article] [PubMed] [Google Scholar]
- 41.Voegele RT, Sweet GD, Boos W. Glycerol kinase of Escherichia coli is activated by interaction with the glycerol facilitator. J Bacteriol. 1993;175:1087–1094. doi: 10.1128/jb.175.4.1087-1094.1993. [DOI] [PMC free article] [PubMed] [Google Scholar]
- 42.Dennis PP, Bremer H. Differential rate of ribosomal protein synthesis in Escherichia coli B/r. J Mol Biol. 1974;84:407–422. doi: 10.1016/0022-2836(74)90449-5. [DOI] [PubMed] [Google Scholar]
Associated Data
This section collects any data citations, data availability statements, or supplementary materials included in this article.
Supplementary Materials
Data Availability Statement
The data that support the findings of this study are available from the corresponding author upon reasonable request.