Abstract
The Xenopus tadpole retinotectal circuit, comprised of the retinal ganglion cells (RGCs) in the eye which form synapses directly onto neurons in the optic tectum, is a popular model to study how neural circuits self-assemble. The ability to carry out whole cell patch clamp recordings from tectal neurons and to record RGC-evoked responses, either in vivo or using a whole brain preparation, has generated a large body of high-resolution data about the mechanisms underlying normal, and abnormal, circuit formation and function. Here we describe how to perform the in vivo preparation, the original whole brain preparation, and a more recently developed horizontal brain slice preparation for obtaining whole cell patch clamp recordings from tectal neurons. Each preparation has unique experimental advantages. The in vivo preparation enables the recording of the direct response of tectal neurons to visual stimuli projected onto the eye. The whole brain preparation allows for the RGC axons to be activated in a highly controlled manner, and the horizontal brain slice preparation allows recording from across all layers of the tectum.
Keywords: Neuroscience, Issue 133, Whole cell patch clamp recording, Xenopus tadpoles, retinotectal circuit, brain preparations, neural circuit function, electrophysiology
Introduction
The retinotectal circuit is the major component of the amphibian visual system. It is comprised of the RGCs in the eye, which project their axons to the optic tectum where they form synaptic connections with postsynaptic tectal neurons. The Xenopus tadpole retinotectal circuit is a popular developmental model to study neural circuit formation and function. There are many attributes of this tadpole's retinotectal circuit that render it a powerful experimental model1,2,3. One major attribute, and the focus of this article, is the ability to carry out whole cell patch clamp recordings from tectal neurons, in vivo or using a whole brain preparation. With an electrophysiology rig outfitted with an amplifier that supports voltage- and current-clamp recording modes, whole cell patch clamp recordings allow a neuron's electrophysiology to be characterized at high resolution. As a result, whole cell patch clamp recordings from tectal neurons across the key stages of retinotectal circuit formation have provided a detailed and comprehensive understanding of the development and plasticity of intrinsic4,5,6,7 and synaptic8,9,10,11 properties. Combining whole cell patch clamp tectal neuron recordings, the ability to express genes or morpholinos of interest in these neurons12, and a method to assess visual guided behavior via an established visual avoidance test13 promotes the identification of links between molecules, circuit function, and behavior.
It is important to note that the type of high resolution data acquired from whole cell patch clamp recordings is not possible using newer imaging approaches such as the genetic calcium indicator GCaMP6, because although using calcium indicators permits the imaging of calcium dynamics across large populations of neurons simultaneously, there is no direct or obvious way that the specific electrical parameters can be obtained by measuring delta fluorescence in the somata, and there is no way to voltage clamp the neuron to measure current-voltage relationships. Clearly these two distinct approaches, electrophysiological recordings and calcium imaging, possess non-overlapping strengths and generate different types of data. Thus, the best approach depends on the specific experimental question being addressed.
Here, we describe our method for acquiring whole cell patch clamp recordings from neurons of the tadpole optic tectum using an in vivo preparation, whole brain preparation, and a newer modified whole brain preparation that was developed in our lab14. In the Representative Results section, we demonstrate the experimental advantages of each preparation and the different types of data that can be obtained. The limits and strengths of the different preparations, as well as tips for troubleshooting, are included in the Discussion section.
Protocol
All methods described here have been approved by the Institutional Animal Care and Use Committee (IACUC) of the University of Wyoming. All procedures, including electrophysiological recordings, are carried out at room temperature, approximately 23 °C. All methods described here are optimized for recording tectal neurons from tadpoles between developmental stage 42 and 49 (staged according to Neiuwkoop and Faber15).
1. In Vivo Preparation
- Anesthetize the tadpole.
- Place the tadpole in a small Petri dish containing Steinberg's solution with 0.01% MS-222 for approximately 5 min. NOTE: MS-222 aka "Tricaine" is a common fish and amphibian anesthetic. The tadpoles are raised in the Steinberg's solution in mM: 0.067 KCl, 0.034 Ca(NO3)2•4H2O, 0.083 MgSO4•7H2O, 5.8 NaCl, 4.9 HEPES.
- Ensure the tadpole is deeply anaesthetized (non-responsive and no longer swimming) before proceeding to step 2.
- Secure the anesthetized tadpole to a submerged silicone block on the floor of the dissecting/recording dish.
- Use a disposable transfer pipette to move the anaesthetized tadpole to a dissection/recording dish containing external recording solution (115 mM of NaCl, 2 mM of KCl, 3 mM of CaCl2, 3 mM of MgCl2, 5 mM of HEPES, 1 mM of glucose; adjust pH to 7.25 using 10 N of NaOH, osmolarity 255 mOsm).
- To minimize spontaneous muscle twitches, add the acetylcholine receptor blocker, tubocurarine (100 µM) to the external solution. (Typically, this is done by using a 200 µL pipette to add 100 µL of a 10 mM tubocurarine stock to 10 mL of external solution).
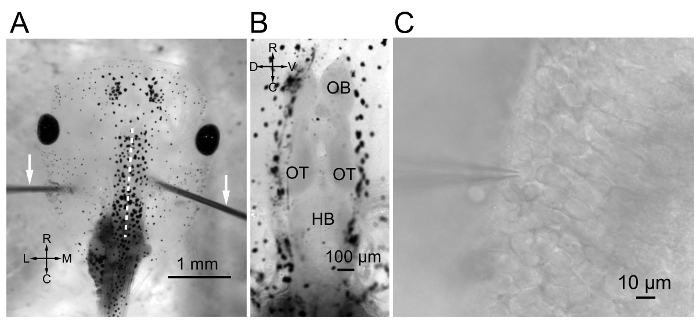
- Using insect pins, secure the tadpole, dorsal side up, to a submerged block of silicone elastomer (such as Sylgard 184, see Materials Table for details), which has been glued to the dissecting dish floor. Note: The placement of the pins is critical: place them on either side of the brain, sufficiently caudal to avoid impaling the afferent RGC axons that project from the eye and enter the brain just anterior to the optic tectum (Figure 1A).
- Fillet the brain along the midline.
- For a clear view of the brain, remove the skin overlying the brain by making a superficial incision along the midline using a sterile 25-G needle.
- Fillet the brain along the same midline axis by inserting the needle into the neural tube and pulling gently upward (dorsally) such that the dorsal portion of the tube is cleanly cut (severed) while leaving the floor plate intact (Figure 1B). NOTE: It is important that the floor plate of the neural tube be left intact because the afferent sensory inputs enter the tectum via the floor plate.
- Remove the transparent ventricular membrane that covers the tectal neurons.
- Move the recording dish to the electrophysiology rig and use a broken glass pipette tip to remove the ventricular membrane overlying the tectal neuron cell bodies. Break the tip by lightly dragging it across a delicate task wiper.
- Screw the pipette into the pipette holder and lower it down to the optic tectum via the micromanipulator.
- Use the broken pipette to peel the ventricular membrane away from the tectum. NOTE: It is not necessary to remove the membrane from the entire tectum; a small window will suffice and provide access to plenty of neurons.
Obtain the whole cell patch clamp recordings. NOTE: The approach from this point forward is similar to carrying out whole cell patch clamp recordings from mouse brain slices as described in Segev, et al.16(Figure 1C).
- Record the tectal neuron responses to a whole field flash of light projected onto the retina.
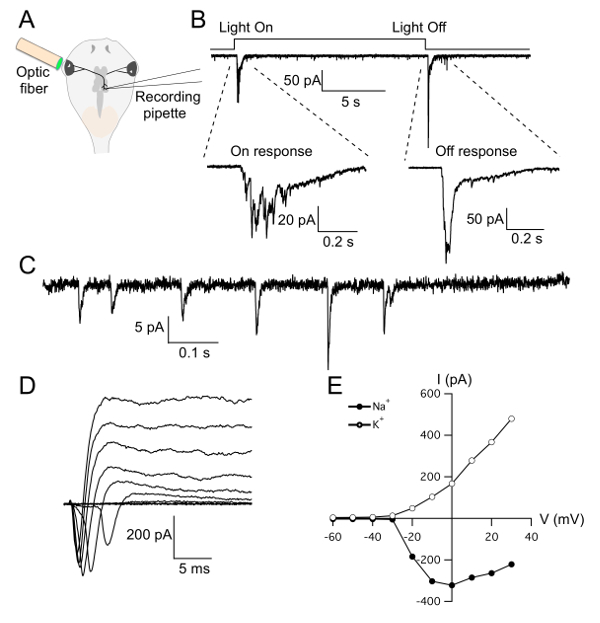
- To project a whole field flash of light onto the retina, place an optic fiber adjacent to the tadpole's eye. At the other end of the optic fiber is an LED in line with a variable resistor that allows for the light luminance to be controlled. Trigger the LED by the digital output of the amplifier. In this way, whole field flashes of varying intensities of light can be recorded (Figure 4A).
2. Whole Brain Preparation
Perform steps 1.1 to 1.3. Note: There is no need for tubocurarine in the external solution for this preparation.
- Isolate the brain.
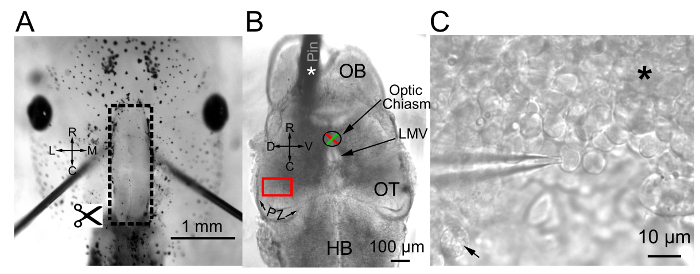
- Use a 25-G needle to sever the hindbrain (Figure 2A).
- To isolate the whole brain from the tadpole, gently run the needle underneath the brain, in a caudal-to-rostral direction to sever all lateral and ventral connective tissue and nerve fibers.
- Secure the brain to a block of silicone elastomer.
- Once completely freed, secure the brain to a block of silicon elastomer by placing one pin through one of the olfactory bulbs and another pin through the hindbrain (Figure 2B). This is the optimal configuration for recording from tectal neurons.
Move the dish containing the pinned whole brain preparation from the dissecting scope to the electrophysiology rig. Remove the ventricular membrane using a broken glass pipette as described in step 1.4.
- Place a bipolar stimulating electrode on the optic chiasm (where the axon tracts from each eye cross at the midbrain) to directly activate the RGC axons.
- Place the bipolar stimulating electrode rostral, and almost adjacent to, the large middle ventricle. The optic chiasm is located immediately rostral to the large middle ventricle (Figure 2B).
- Gently lower the stimulating electrode down onto the optic chiasm such that a small dent is formed in the tissue. The bipolar electrode is driven by a pulse stimulator which allows the strength of stimulation to be precisely controlled.
Perform the whole cell patch clamp recording (Figure 2C) as described by Segev, et al.16
3. Horizontal Brain Slice Preparation
Perform steps 2.1 to 2.3.
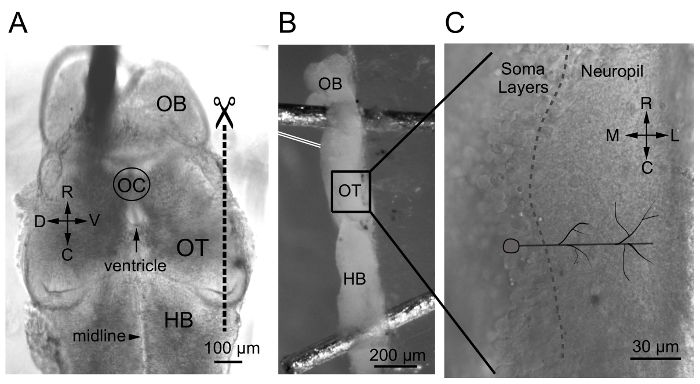
Use a razor blade to excise the most lateral fourth (which in vivo corresponds to the most dorsal fourth) of one side of one optic tectum. This cut is made parallel to the rostral-caudal plane as shown in Figure 3A.
Re-pin the brain to the side of the silicone elastomer with the sliced side facing up (so that the somata and neuropil can be directly accessed for recording) and the ventricular surface of the brain facing away from the silicone elastomer block (Figure 3B) (so that a bipolar electrode can be placed on the optic chiasm).
Perform the whole cell patch clamp or local filed potential recording (Figure 3C) as described by Segev, et al.16
Representative Results
To record light-evoked responses a whole field flash of light is projected onto the retina while the resulting response is recorded from individual tectal neurons (Figure 4A). This particular protocol is designed to measure both the response of the neuron to the light turning on ("On" response) and then turning off 15 s later to measure the "Off response." Tectal neurons typically exhibit robust On and Off responses (shown here recorded in voltage clamp mode, with the neuron clamped to -60mV to measure synaptic current (Figure 4B)). The amount of synaptic drive received by any one neuron can be quantified by recording spontaneous synaptic events (Figure 4C). Current-voltage relationships (I-V curves) can be generated from the same neuron by stepping the neuron to increasingly depolarized potentials and recording the resulting voltage-activated Na+ and K+ currents, referred to as "mixed current recordings" (Figure 4D, E). It has been well established that for these amphibian neurons, peak Na+ and K+ currents can be quantified via mixed current recordings because the peaks do not temporally overlap with one another4,7.
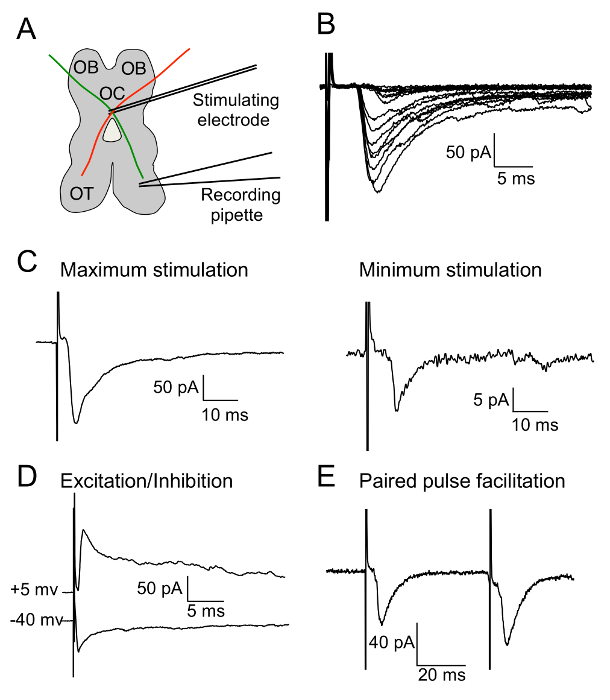
Direct activation of RGC axons at the optic chiasm bypasses all upstream computation and processing of visual stimuli that take place in the eye, and allows for studying the synaptic transmission between presynaptic RGC axons and postsynaptic tectal neurons in its most pure and reduced form. Tectal neuron responses to RGC activation are generated from RGCs stimulated by light or directly using a bipolar stimulating electrode consisting of two components: a monosynaptic component (the direct synaptic input from activated RGCs) and a polysynaptic component (the local recurrent network activity feeding back onto the neuron being recorded). In the case of the light evoked responses, the monosynaptic and polysynaptic components overlap with one another by some undeterminable amount. This temporal overlap limits what can be concluded about synaptic transmission between the retina and optic tectum. Using a whole brain preparation and activating the RGC axon tract directly via an electrode placed on the optic chiasm (Figure 5A), however, produces a mono- and polysynaptic component that are essentially non-overlapping in time. The stimulating strength of the bipolar electrode can be adjusted. As the stimulating strength is increased, there is a greater number of RGC axons activated (Figure 5B). A minimal stimulation protocol determines the synaptic strength of an individual RGC axon onto an individual tectal neuron; a maximal stimulation protocol reflects the total, or maximum, synaptic input from all the RGC axons combined (Figure 5C). The proper ratio of excitatory to inhibitory synaptic input (E:I ratio) received by an individual tectal neuron is critical for normal visual function18. Figure 5D shows an example of the RGC-evoked excitatory and inhibitory current traces recorded from an individual tectal neuron. The probability of the transmitter release from RGC presynaptic axon terminals is measured by paired pulse recordings. For this, the postsynaptic tectal neuron is recorded in the voltage clamp mode to measure synaptic currents, while the RGC axons are activated successively, separated by a 50 ms time interval (Figure 5E).
Whole cell patch clamp recordings can be carried out from tectal neurons residing in any somatic layer. Similar to the whole brain preparation, RGC axons can be activated by placing a bipolar recording electrode on the optic chiasm (Figure 6A). All recordings carried out in the whole brain preparation can also be performed using this horizontal brain slice preparation. Figure 6B shows an example trace of an RGC-evoked response recorded from a neuron in the superficial layer. This preparation also allows for the spatial pattern of RGC synaptic input onto the tectal dendrites to be measured. For this, RGC-evoked field potentials are recorded every 10 µm along the medial-lateral axis (i.e., the distal-proximal axis) of the neuropil (Figure 6C). This generates a high-resolution profile of the pattern of functional RGC input. The field potentials can then be transformed into current source densities by calculating the second spatial derivative14 and the current source densities can in turn be transformed into an image plot. The image plot in Figure 6C shows that the strongest RGC input targets the more distal area of the neuropil.
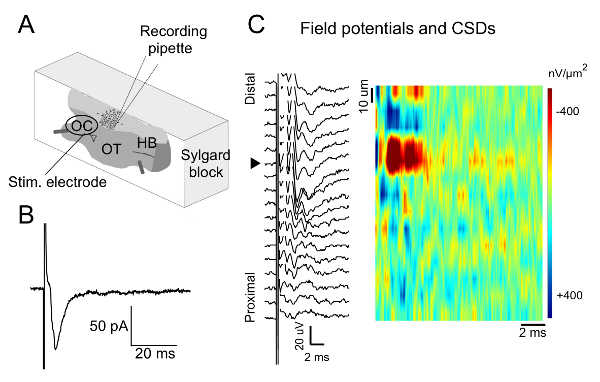
Figure 1. In vivo preparation procedures. (A) Tadpole pinned down on a piece of silicone elastomer. Pins are indicated by the white arrows. Note the more caudal pin positioning to avoid impaling the optic tracts. The white dashed line indicates the midline. (B) Zoomed-in view of the entire brain after cutting along the dorsal midline and removing overlaying skin. (C) Whole-cell patch-clamp recording in vivo. (L: Lateral. M: Medial. R: Rostral. C: Caudal. D: Dorsal. V: Ventral. OB: Olfactory Bulb. OT: Optic Tectum. HB: Hindbrain). Please click here to view a larger version of this figure.
Figure 2. Whole brain preparation procedures. (A) After the brain is filleted along the midline, the hindbrain is severed. (B) The entire brain is dissected out and pinned down to the silicone elastomer. The white asterisk indicates the pin in the left olfactory bulb. The red box indicates the middle third of the tectum, i.e., the target area for recording. (C) Whole cell patch clamp recording using whole brain preparation. The black asterisk indicates the area of un-scraped ventricular membrane where cells cannot be accessed for recording. Where the membrane has been successfully removed, the somata appear more distinct and defined. The arrow indicates an unhealthy neuron. (PZ: Proliferative Zone. LMV: Large Medial Ventricle. OB: Olfactory Bulb. OT: Optic Tectum. HB: Hindbrain. L: Lateral. M: Medial. R: Rostral. C: Caudal. D: Dorsal. V: Ventral). Please click here to view a larger version of this figure.
Figure 3. Horizontal brain slice preparation procedures. (A) The most lateral portion of one side of the optic tectum will be sliced (indicated by the dashed line) after whole brain preparation. (B) Horizontal brain slice preparation after being pinned down to the side of the silicone elastomer. Double white lines represent a stimulating electrode placed on the optic chiasm. (C) Zoomed-in view of the soma layers and neuropil using a horizontal brain slice preparation. Dashed curve indicates the boundary between soma layers and neuropil. This figure has been modified from Hamodi, et al.14 (L: Lateral. M: Medial. R: Rostral. C: Caudal. D: Dorsal. V: Ventral. OB: Olfactory Bulb. OC: Optic Chiasm. OT: Optic Tectum. HB: Hindbrain). Please click here to view a larger version of this figure.
Figure 4. Recordings from an in vivo preparation. (A) Schematic showing the typical configuration of an in vivo recording. (B) Light evoked responses including light on and light off responses. Inset traces are zoomed-in view of on- and off-response, respectively. (C) Spontaneous excitatory postsynaptic currents recorded. (D) Na+ and K+ currents in response to voltage clamp steps from -60 mV to 30 mV from a single neuron. (E) IV plots generated from traces in (D). All recordings were done with the neuron held at -60 mV except in (D) to generate IV-plots; neurons are stepped to increasingly more depolarized potentials, in 10 mV increments, to activate voltage-dependent currents. Please click here to view a larger version of this figure.
Figure 5. Recordings from a whole brain preparation. (A) Schematic showing the typical configuration of whole brain recording including a stimulating electrode placed on the optic chiasm (green and red lines represent RGC axons). (B) Overlaying traces of the RGC responses to changes of RGC stimulation strength. (C) Maximum stimulation response (left) and minimum stimulation response (right). (D) An RGC-evoked excitatory and inhibitory response onto a single neuron. (E) Paired pulse facilitation of the RGC-evoked response of an individual neuron. (OB: Olfactory Bulb. OC: Optic Chiasm. OT: Optic Tectum). All recordings were done with the neuron held at -60 mV except in (D) to measure the excitatory and inhibitory inputs: the excitatory input is recorded by holding the neuron at the reversal potential of γ-Aminobutyric acid (GABA)-mediated chloride currents (-45 mv); the inhibitory input by holding the neuron at the reversal potential of α-amino-3-hydroxy-5-methyl-4-isoxazolepropionic acid (AMPA)-mediated currents (+5 mv). Please click here to view a larger version of this figure.
Figure 6. Recordings from a horizontal brain slice preparation. (A) Schematic showing the configuration of a horizontal brain slice preparation. Note that although the stimulating electrode remains at the optic chiasm, the recording pipette is now positioned to access cells across all the tectal layers exposed by the horizontal brain slice preparation. (B) An RGC response from a neuron residing in the superficial layer of the tectum. (C) Recorded field potentials across the neuropil and the converted current source densities (CSDs) shown by image plot heat maps. (OC: Optic Chiasm. OT: Optic Tectum. HB: Hindbrain). Please click here to view a larger version of this figure.
Discussion
All methods described in this work are optimized for recording tectal neurons from tadpoles between developmental stage 42 and 49 (staged according to Neiuwkoop and Faber15). By stage 42, the tadpoles are sufficiently large and sufficiently developed so that the insect pins can be placed on either side of brain for in vivo recordings and for carrying out the whole brain dissection. At earlier stages, when the tadpoles are essentially two-dimensional (i.e., flat), the approaches described here are not optimal.
Due to the ease in which tectal neurons can be accessed and recorded in whole cell configuration, this model circuit has been a hotbed for fundamental discoveries about how neural circuits form while functioning - and function while forming19. Here we have described how to acquire whole cell patch clamp recordings from tectal neurons, including how to perform the tadpole in vivo and whole brain preparations, the different recording configurations, and examples of the different types of data. The following is a discussion of the strengths and limitations of each preparation, followed by tips for achieving high-quality whole cell recordings.
Xenopus tadpoles begin displaying visual avoidance behaviors by stage 47/48, approximately 7 - 8 days post-fertilization3,13. This means that even at these relatively early stages of development, the retinotectal circuit is functioning and capable of processing visual stimuli. Fundamental questions regarding the development and plasticity of the retinotectal circuit have been directly addressed using the in vivo preparation to record tectal neuron responses to visual stimuli projected onto the retina. In vivo recordings in the tadpole are relatively straightforward compared to the equivalent recording configuration in mammals due to the relative simplicity of the nervous system and lack of a skull. Because individual tectal neuron somas can be visualized in vivo, sealing onto a given neuron and achieving whole cell patch clamp recording configuration is essentially equivalent to carrying out whole cell patch clamp recording in rodent slice preparations. Tadpoles typically survive for several hours on the rig (which can be readily assessed by monitoring the heart beat). One limitation inherent of the tadpole in vivo preparation is that only tectal neurons residing in the deep somatic layer of the optic tectum, the layer that is immediately adjacent to the large middle ventricle, are accessible for recording (Figure 1). This means that tectal neurons residing in the outer somatic layers of the tectum have been largely unexplored in vivo.
The experimental advantage of the whole brain preparation is that it isolates the brain from the peripheral sensory receptors in the eyes and skin, eliminating all spurious sensory-driven activity. While no longer capable of being driven by visual stimuli, the RGC axonal inputs that target the tectum are still present in the whole brain preparation and they can be directly activated in a highly controlled manner via a bipolar stimulating electrode (FHC) placed on the optic chiasm where the two sets of RGC axon tracts enter the brain. The first reported use of the whole brain preparation was in 1996, in an important study by Wu et al.8, in which RGC axons were activated using a bipolar stimulating electrode such that the authors could quantify the strength of individual RGC axons onto postsynaptic tectal neurons, and in doing so made fundamental discoveries about the progression of synapse maturation. As with the in vivo preparation, the whole brain preparation allows access to only those neurons residing in the deep layer, adjacent to the ventricular membrane.
Although the optic tectum is composed of approximately nine cell body layers17, all previous electrophysiology studies have focused on the deep layer tectal neurons because the traditional whole brain and in vivo preparations (described above) allow access only to the neurons of the deep layer. In order to access tectal neurons across all somatic layers, from deepest to most superficial as well as the entire neuropil where RGC axons form synaptic connections with tectal neuron dendrites, we developed a modified whole brain preparation, referred to as "the horizontal brain slice preparation" (Figure 314). As with the whole brain preparation, the horizontal brain slice preparation maintains the RGC axons within the brain and they can be controlled by placing a bipolar stimulating electrode on the optic chiasm.
Overall, the preparations are designed to optimize visualization of and access to tectal neuron somata to carry out whole cell patch clamp recording. Direct access to the soma is essential for quality whole cell patch clamp recordings: access to the inside of the neuron requires the formation of a very strong (>1 × 10⁹ Ω) seal between the pipette and the neuron's plasma membrane, which requires direct contact of the pipette tip onto that membrane. Hence, sufficient removal of the ventricular membrane is key for successful recording. Also, key for successful RGC-evoked recordings is the correct placement of the bipolar stimulating electrode onto the optic chiasm. Essentially all tectal neurons receive direct synaptic input from the RGC axons. If no RGC-evoked response is observed, then this is most likely due to incorrect placement of the bipolar electrode such that it is not on the optic chiasm and not contacting the optic nerves. This can be corrected by simply re-positioning the stimulating electrode. Failure to observe RGC-evoked responses after re-positioning the bipolar electrode could mean that the RGC axon projection was accidentally severed during the dissection. In this case, it is necessary to start over with a new preparation. Finally, failure to observe an RGC-evoked response could be due to recording from a cell that is not a common tectal neuron. For instance, glia typically do not display the normal RGC-evoked monosynaptic response displayed by tectal neurons, and neither do the large mesencephalic neurons that have been found, albeit at very low numbers, residing in the optic tectum20. The likelihood of recording from one of these non-tectal cells is very low due to the sheer number of tectal neurons. Of course, quality recordings also require the tectal neurons to be healthy. Characteristics of a healthy tectal neuron are a compact round or oval-shaped soma that is light-colored and without blemishes. Once whole cell recording configuration has been achieved, the health of the neuron can be further evaluated at the electrophysiological level by measuring fundamental electrical properties such as resting membrane potential, input resistance, and capacitance. The resting membrane potential of healthy tectal neurons between developmental stages 42 and 49 is approximately -45 mV, with an average input resistance of approximately 1 GΩ, and a capacitance of 10 - 12 pF3,4,5. A small fraction of neurons will inevitably be damaged due to the removal of the ventricular membrane. The somata of damaged or unhealthy neurons appear grainy, bloated, or shriveled. An example of an unhealthy neuron is shown Figure 2C. If the majority of neurons appear unhealthy, this could be a reflection that there is something wrong with the external recording solution, so it is recommended to make up fresh external recording solution. Besides appearing healthy, the best neurons for recording are typically associated with a large number of other neurons, as opposed to being isolated. Also, choose cells that are easily accessible. For example, do not push the tissue too hard to access a cell because this might damage the tissue or move the tissue and thus shift the stimulating electrode out of place. Finally, recordings should be restricted to the middle third of the tectum (Figure 2B) to avoid potential differences due to the developmental gradient that exists across the rostro-caudal axis4,8, unless, of course, the focus of the experiment is the aforementioned developmental gradient. The tectum proper is the area rostral of the proliferative zone and caudal to the caudal edge of large middle ventricle.
The whole cell patch clamp recording technique is not without its limitations. In general, this style of recording involves recording one neuron at a time. This is in contrast to approaches involving imaging of a new generation GCaMP6 calcium indicators, which allow for the activity of large populations of neurons to be imaged simultaneously in a slice preparation and in vivo.
Another drawback inherent to whole cell voltage clamp recordings is the space clamp error (the inability to control the voltage much further beyond the soma), which limits temporal control of voltage4. Overall, these voltage clamp issues are minimal when recording from tectal neurons however, because of their relatively small size, modest dendritic arborizations, and relatively small and slow currents compared to mammalian neurons. These characteristics of tectal neurons render them especially amenable for voltage clamp recording, measurement of many parameters, and construction of profiles for individual neurons5,6.
Future directions include optimizing an in vivo horizontal brain slice preparation to characterize the function of outer layer neurons in the processing of visual stimuli.
Disclosures
The authors have nothing to disclose.
Acknowledgments
Supported by the NIH grant SBC COBRE 1P20GM121310-01.
References
- Pratt KG, Khakhalin AS. Modeling human neurodevelopmental disorders in the Xenopus tadpole: from mechanisms to therapeutic targets. Dis. Model Mech. 2013;6:1057–1065. doi: 10.1242/dmm.012138. [DOI] [PMC free article] [PubMed] [Google Scholar]
- Pratt KG. Finding Order in Human Neurological Disorder Using a Tadpole. Curr. Pathobio. Rep. 2015;3(2):129–136. [Google Scholar]
- Liu Z, Hamodi AS, Pratt KG. Early development and function of the Xenopus tadpole retinotectal circuit. Curr. Opin. Neurobiol. 2016;41:17–23. doi: 10.1016/j.conb.2016.07.002. [DOI] [PubMed] [Google Scholar]
- Hamodi AS, Pratt KG. Region-specific regulation of voltage-gated intrinsic currents in the developing optic tectum of the Xenopus tadpole. J. Neurophysiol. 2014;112(7):1644–1655. doi: 10.1152/jn.00068.2014. [DOI] [PMC free article] [PubMed] [Google Scholar]
- Pratt KG, Aizenman CD. Homeostatic regulation of intrinsic excitability and synaptic transmission in a developing visual circuit. J. Neurosci. 2007;27(31):8268–8277. doi: 10.1523/JNEUROSCI.1738-07.2007. [DOI] [PMC free article] [PubMed] [Google Scholar]
- Cialeglio CM, Khakhalin AS, Wang AF, Constantino AC, Yip SP, Aizenman CD. Multivariate analysis of electrophysiological diversity of Xenopus visual neurons during development and plasticity. Elife. 2015;4:11351. doi: 10.7554/eLife.11351. [DOI] [PMC free article] [PubMed] [Google Scholar]
- Aizenman CD, Akerman CJ, Jensen KR, Cline HT. Visually driven regulation of intrinsic neuronal excitability improves stimulus detection in vivo. Neuron. 2003;39(5):831–842. doi: 10.1016/s0896-6273(03)00527-0. [DOI] [PubMed] [Google Scholar]
- Wu G, Malinow R. Cline H.T. of a central glutamatergic synapse. Science. 1996. pp. 972–976. [DOI] [PubMed]
- Van Rheed JJ, Richards BA, Akerman CJ. Sensory-evoked spiking behavior emerges via an experience-dependent plasticity mechanism. Neuron. 2015;87(5):1050–1060. doi: 10.1016/j.neuron.2015.08.021. [DOI] [PubMed] [Google Scholar]
- Schwartz N, Schohl A, Ruthazer ES. Activity-dependent transcription of BDNF enhances visual acuity during development. Neuron. 2011;70(3):455–467. doi: 10.1016/j.neuron.2011.02.055. [DOI] [PubMed] [Google Scholar]
- Zhang LI, Tao HW, Holt CE, Harris WA, Poo M. A critical window for cooperation and competition among developing retinotectal synapses. Nature. 1998;395(6697):37–44. doi: 10.1038/25665. [DOI] [PubMed] [Google Scholar]
- Hewapathirane DS, Haas K. Single cell electroporation in vivo within the intact developing brain. J. Vis. Exp. 2008. p. e705. [DOI] [PMC free article] [PubMed]
- Dong W, et al. Visual avoidance in Xenopus tadpoles is correlated with the maturation of visual responses in the optic tectum. J. Neurophysiol. 2009;101(2):803–815. doi: 10.1152/jn.90848.2008. [DOI] [PMC free article] [PubMed] [Google Scholar]
- Hamodi AS, Pratt KG. The horizontal brain slice preparation: a novel approach for visualizing and recording from all layers of the tadpole tectum. J. Neurophysiol. 2015;113(1):400–407. doi: 10.1152/jn.00672.2014. [DOI] [PMC free article] [PubMed] [Google Scholar]
- Nieuwkoop PD, Faber J. Normal Table of Xenopus laevis (Daudin) New York: Garland; 1994. [Google Scholar]
- Segev A, Garcia-Oscos F, Kourrich S. Whole-cell Patch-clamp Recordings in Brain Slices. J. Vis. Exp. 2016. p. e54024. [DOI] [PMC free article] [PubMed]
- Muldal AM, Lillicrap TP, Richards BA, Akerman CJ. Clonal Relationships Impact Neuronal Tuning within a Phylogenetically Ancient Vertebrate Brain Structure. Curr. Biol. 2014;24(16):1929–1933. doi: 10.1016/j.cub.2014.07.015. [DOI] [PMC free article] [PubMed] [Google Scholar]
- Khakhalin AS, Koren D, Gu J, Xu H, Aizenman CD. Excitation and inhibition in recurrent networks mediate collision avoidance in Xenopus tadpoles. Eur. J. Neurosci. 2014;40(6):2948–2962. doi: 10.1111/ejn.12664. [DOI] [PubMed] [Google Scholar]
- Ruthazer ES, Aizenmann CD. Learning to see: patterned visual activity and the development of visual function. Trends Neurosci. 2010;44(4):183–192. doi: 10.1016/j.tins.2010.01.003. [DOI] [PMC free article] [PubMed] [Google Scholar]
- Pratt KG, Aizenman CD. Multisensory integration in mesencephalic trigeminal neurons in Xenopus tadpoles. J. Neurophysiol. 2009;102(1):399–412. doi: 10.1152/jn.91317.2008. [DOI] [PMC free article] [PubMed] [Google Scholar]


