Abstract
BACKGROUND
Current cholesterol guidelines recommend using 10-year risk of atherosclerotic cardiovascular disease (ASCVD) to guide informed decisions regarding statin therapy, yet patients may have difficulty conceptualizing absolute risk estimates. Peer comparisons may provide an improved tool for patient risk comprehension.
METHODS
Using data from the 2009–2014 National Health and Nutrition Examination Survey (NHANES), we estimated standardized cardiovascular risk percentiles for various age-, sex-, and race-specific subgroups based on their 10-year ASCVD risks using the Pooled Cohort Equations.
RESULTS
We examined 9,160 adults in NHANES who were free of cardiovascular disease and had complete clinical data. Among specific age, sex, and race groups, we estimated the distribution of 10-year risk, calculating the 10-year risk corresponding to each percentile in order to generate standardized cardiovascular risk percentiles. Estimated 10-year ASCVD absolute risk varied markedly by age, sex, and race subgroups. A 10-year risk of 7.0% would put a 55 year-old black male in the 20th percentile relative to his peers (i.e., at lower risk than 80% of his peers), whereas a 10-year risk of 7.0% would put a 55 year-old white female in the 95th percentile (i.e., only 5% of her peers would have higher risk). Standardized cardiovascular risk percentiles by age, race, and sex are available online at populationrelativerisk.dcri.org.
CONCLUSION
Cardiovascular risk varies substantially by age, sex, and race. These data allow for 10-year absolute risks of ASCVD to be translated into a standardized cardiovascular risk percentile, providing patients with information that is easy to understanding regarding how their personal risk of cardiovascular disease compares with their age-, sex-, and race-matched peers.
Keywords: atherosclerotic cardiovascular disease, cardiovascular risk percentiles
Current statin therapy guidelines from the American College of Cardiology (ACC) and American Heart Association (AHA),1 as well as recently released guidelines for blood pressure management2 both utilize a patient’s risk of cardiovascular disease to guide treatment decisions. These guidelines recommend that providers engage in shared decision-making, including a discussion with patients about atherosclerotic cardiovascular disease (ASCVD) risk and the benefits of therapy. Despite the availability of decades of clinical trial research to guide therapy decisions, relatively little data is available on how to best communicate cardiovascular risk to patients that ensures patient understanding of the severity of risk while maximizing patient engagement in cardiovascular disease prevention.3 To date, research surrounding risk communication and patient decision making has centered around patient understanding of probabilistic risk information.4 Many patients have difficulty comprehending basic probabilities; moreover, a patient’s interpretation of their personal risk may depend on how that risk is presented and explained to them.5 Even if a patient understands their 10-year CVD risk numerically, their qualitative understanding of that risk may still be highly variable. Describing the qualitative meaning of risk information may help improve qualitative risk understanding, e.g. describing whether a certain 10-year risk is “high” or “low.”4 One additional way to help patients contextualize risk is by describing how patients how they compare with their peers. In one study, presenting risk information along with hypothetical peer group risk estimates heightened both perceived risk and emotional responses to risk estimates.6 To date, population-level assessments of the distribution of cardiovascular disease risk are unavailable.
Using data from the National Health and Nutrition Examination Survey (NHANES), we evaluated the distribution of 10-year risk in United States adults in order to translate individual 10-year risk estimates into age-, sex-, and race-specific cardiovascular risk percentiles. We then developed a simple on-line application to estimate and display an individual’s ASCVD risk, relative to their age-, sex-, and race-specific peer group.
METHODS
This analysis used data from the continuous NHANES (2009–2014). To estimate the population distribution of risk in adults aged 40–79, we utilized data from non-pregnant adults aged 35–79 seen in mobile exam centers. To limit our sample to a primary prevention population, we excluded adults with prior cardiovascular disease (i.e., self-report of coronary artery disease, stroke, angina, or myocardial infarction; and/or angina per the Rose Angina Questionnaire). The 10-year risk of ASCVD was calculated using the Pooled Cohort Equations (PCE).7 Smoking was defined as current cigarette smoking. Diabetes was defined by self-report or glycated hemoglobin ≥6.5%. Systolic blood pressures were measured according to a standardized protocol using the average of non-zero measurements. Blood pressure treatment was defined by self-report of taking medication for high blood pressure. Total cholesterol and high-density lipoprotein cholesterol (HDL-C) were measured on all participants. Race was considered black if the adult reported “non-Hispanic black” race, otherwise race was categorized non-black to be consistent with the PCE. We excluded adults with missing data for any of the variables required to calculate 10-year risk.
We estimated age-, sex-, and race-specific percentiles of risk in the population for each year from age 40 to 75. Due to the limited number of participants in each 1-year interval, we used a rolling window of adults within +/− 5 years of the age of interest, per each individual year. Ten-year risks at the age of interest were calculated for all eligible adults in that window. Using the mobile exam center weights provided by NHANES, we calculated weighted percentiles for each group (i.e., non-black men, black men, non-black women, and black women). For example, to estimate the population distribution of risk for non-black males at age 60, we calculated 10-year risk for all non-black males aged 55 to 64 using an age of 60, then generated 100 percentiles of risk based on those estimates using appropriate sample weights. A patient’s percentile represents the percent of age-, sex-, and race-matched adults whose risk is higher than their own, such that a person at the 90th percentile has a 10-year predicted risk greater than 90% of similar adults. The proportion of adults who met or exceeded a 10-year risk of 7.5% was calculated at each age by sex and race. Example percentile curves, representing the distribution of risk across the population, were derived for adults age 45, 55, 65, and 75, stratified by race and sex.8
Statistical analyses were conducted using SAS version 9.4 (SAS Institute, Inc., Cary, NC, USA). All NHANES participants provide written informed consent for participation. Analysis of NHANES data was approved by the Duke Institutional Review Board.
RESULTS
A total of 11,549 adults aged 35 to <80 had completed exams at mobile exam centers. We excluded 1,393 who had prior cardiovascular disease and 36 who were pregnant, leaving 10,120 patients; of these, we excluded 583 who had missing laboratory data, 412 missing data for systolic blood pressure, 5 missing data for smoking, 16 missing data on blood pressure treatment status, and 5 missing data for diabetes. After these exclusions, our final analysis population was comprised of 9,160 adults.
Table 1 shows 10-year ASCVD risk estimates corresponding to specific percentiles by age, sex, and race grouping. For example, among 55-year-olds, an estimated 10-year ASCVD risk of 7.0% would put a white male at the 50th percentile of risk, meaning that half of all 55-year-old white males have lower risk and half have higher risk than this particular individual. That same 10-year absolute risk estimate would put a 55-year-old black male between the 20th and 25th percentile of risk, meaning that more than 75% of 55-year-old black males have higher risk. In further contrast, a 10-year risk of 7.0% for a 55-year-old white female would put her at nearly the 95th percentile of risk for her age, meaning that only 5% of women her age have higher risk.
Table 1.
Risk Percentiles of 10-Year ASCVD Risk by Age, Sex, and Race Group
| Non-Black Males | |||||||||||||||||||
|---|---|---|---|---|---|---|---|---|---|---|---|---|---|---|---|---|---|---|---|
| Age | 5th | 10th | 15th | 20th | 25th | 30th | 35th | 40th | 45th | 50th | 55th | 60th | 65th | 70th | 75th | 80th | 85th | 90th | 95th |
| 40 | 0.5 | 0.6 | 0.7 | 0.8 | 0.9 | 1.0 | 1.1 | 1.2 | 1.3 | 1.5 | 1.7 | 1.8 | 2.1 | 2.3 | 2.7 | 3.3 | 4.2 | 5.6 | 7.8 |
| 45 | 1.0 | 1.2 | 1.4 | 1.5 | 1.7 | 1.8 | 2.0 | 2.2 | 2.4 | 2.6 | 2.8 | 3.1 | 3.5 | 3.9 | 4.5 | 5.3 | 6.4 | 7.9 | 10.8 |
| 50 | 1.8 | 2.2 | 2.5 | 2.8 | 3.0 | 3.3 | 3.5 | 3.8 | 4.0 | 4.4 | 4.8 | 5.1 | 5.6 | 6.3 | 7.0 | 7.8 | 8.9 | 10.4 | 13.8 |
| 55 | 3.5 | 3.9 | 4.4 | 4.7 | 4.9 | 5.3 | 5.7 | 6.1 | 6.6 | 7.0 | 7.4 | 8.0 | 8.8 | 9.5 | 10.2 | 11.3 | 12.8 | 14.1 | 17.3 |
| 60 | 5.2 | 6.0 | 6.7 | 7.1 | 7.5 | 8.0 | 8.6 | 9.2 | 9.8 | 10.5 | 11.1 | 11.6 | 12.6 | 13.5 | 14.6 | 15.7 | 17.4 | 19.8 | 23.9 |
| 65 | 8.2 | 9.1 | 10.0 | 10.6 | 11.1 | 11.6 | 12.2 | 13.0 | 14.0 | 14.5 | 15.3 | 16.0 | 17.3 | 18.2 | 19.6 | 22.3 | 24.4 | 26.8 | 33.4 |
| 70 | 12.5 | 13.7 | 15.4 | 16.2 | 16.6 | 17.3 | 18.0 | 18.7 | 19.5 | 20.5 | 21.4 | 22.1 | 23.2 | 24.4 | 26.9 | 30.4 | 32.8 | 37.3 | 41.8 |
| 75 | 18.1 | 20.3 | 21.7 | 23.1 | 24.0 | 25.0 | 26.1 | 27.1 | 28.1 | 29.1 | 30.1 | 31.1 | 32.4 | 35.6 | 38.7 | 42.8 | 46.6 | 49.9 | 54.0 |
|
| |||||||||||||||||||
| Black Males | |||||||||||||||||||
| Age | 5th | 10th | 15th | 20th | 25th | 30th | 35th | 40th | 45th | 50th | 55th | 60th | 65th | 70th | 75th | 80th | 85th | 90th | 95th |
|
| |||||||||||||||||||
| 40 | 2.2 | 2.4 | 2.5 | 2.7 | 2.7 | 2.9 | 3.1 | 3.1 | 3.4 | 3.6 | 4.0 | 4.3 | 4.5 | 4.8 | 5.1 | 5.5 | 6.1 | 7.3 | 10.3 |
| 45 | 2.9 | 3.1 | 3.5 | 3.8 | 4.0 | 4.1 | 4.5 | 4.8 | 5.2 | 5.7 | 6.1 | 6.6 | 7.0 | 7.5 | 8.1 | 8.8 | 10.0 | 13.3 | 15.9 |
| 50 | 3.9 | 4.3 | 4.6 | 5.0 | 5.2 | 5.6 | 6.3 | 6.8 | 7.7 | 8.3 | 8.7 | 9.3 | 10.0 | 10.7 | 11.3 | 12.8 | 14.5 | 17.1 | 19.8 |
| 55 | 5.2 | 5.9 | 6.4 | 6.9 | 7.7 | 8.0 | 8.6 | 9.7 | 10.4 | 10.7 | 11.4 | 12.0 | 12.9 | 14.2 | 15.5 | 16.9 | 18.4 | 21.5 | 27.7 |
| 60 | 6.9 | 7.9 | 8.5 | 9.4 | 9.7 | 10.3 | 11.6 | 12.5 | 12.9 | 13.9 | 14.9 | 16.1 | 17.5 | 19.1 | 20.8 | 22.2 | 24.8 | 29.6 | 34.5 |
| 65 | 8.6 | 9.4 | 10.3 | 11.1 | 11.8 | 13.0 | 14.7 | 16.1 | 16.9 | 18.0 | 19.3 | 20.5 | 22.5 | 23.8 | 25.6 | 28.6 | 32.5 | 36.1 | 43.0 |
| 70 | 11.2 | 12.3 | 13.6 | 15.2 | 16.3 | 17.9 | 19.1 | 19.8 | 20.9 | 22.3 | 23.1 | 24.6 | 26.6 | 27.9 | 29.8 | 35.4 | 38.5 | 43.2 | 53.5 |
| 75 | 13.0 | 14.4 | 16.0 | 18.6 | 19.2 | 20.9 | 21.8 | 23.6 | 24.9 | 26.8 | 28.1 | 29.5 | 31.0 | 32.5 | 34.4 | 39.8 | 44.0 | 47.7 | 54.8 |
|
| |||||||||||||||||||
| Non-Black Females | |||||||||||||||||||
| Age | 5th | 10th | 15th | 20th | 25th | 30th | 35th | 40th | 45th | 50th | 55th | 60th | 65th | 70th | 75th | 80th | 85th | 90th | 95th |
|
| |||||||||||||||||||
| 40 | 0.1 | 0.2 | 0.2 | 0.2 | 0.3 | 0.3 | 0.3 | 0.4 | 0.4 | 0.5 | 0.6 | 0.6 | 0.8 | 0.9 | 1.1 | 1.4 | 1.8 | 2.3 | 3.8 |
| 45 | 0.3 | 0.3 | 0.4 | 0.4 | 0.5 | 0.5 | 0.6 | 0.6 | 0.7 | 0.8 | 0.9 | 1.0 | 1.1 | 1.2 | 1.4 | 1.8 | 2.2 | 2.7 | 4.6 |
| 50 | 0.5 | 0.6 | 0.7 | 0.7 | 0.8 | 0.9 | 1.0 | 1.0 | 1.2 | 1.3 | 1.4 | 1.6 | 1.8 | 2.0 | 2.3 | 2.8 | 3.4 | 4.2 | 5.6 |
| 55 | 0.9 | 1.1 | 1.2 | 1.3 | 1.5 | 1.6 | 1.7 | 1.9 | 2.0 | 2.2 | 2.3 | 2.5 | 2.8 | 3.1 | 3.5 | 4.0 | 5.0 | 6.0 | 7.5 |
| 60 | 1.9 | 2.3 | 2.4 | 2.6 | 2.8 | 3.0 | 3.2 | 3.4 | 3.6 | 3.8 | 4.1 | 4.4 | 4.7 | 5.2 | 5.7 | 6.4 | 7.5 | 9.2 | 11.3 |
| 65 | 3.6 | 4.1 | 4.5 | 4.8 | 5.1 | 5.4 | 5.6 | 6.0 | 6.5 | 6.9 | 7.2 | 7.8 | 8.5 | 9.2 | 9.9 | 11.0 | 12.4 | 14.6 | 17.8 |
| 70 | 6.7 | 7.5 | 8.3 | 8.7 | 9.2 | 9.8 | 10.6 | 11.3 | 11.8 | 12.2 | 13.0 | 13.7 | 14.7 | 15.6 | 16.7 | 18.1 | 20.2 | 23.0 | 28.6 |
| 75 | 12.4 | 13.3 | 14.8 | 15.7 | 17.0 | 18.4 | 19.2 | 19.9 | 21.0 | 22.1 | 23.2 | 24.1 | 25.3 | 26.2 | 27.8 | 30.4 | 34.6 | 39.4 | 43.3 |
|
| |||||||||||||||||||
| Black Females | |||||||||||||||||||
| Age | 5th | 10th | 15th | 20th | 25th | 30th | 35th | 40th | 45th | 50th | 55th | 60th | 65th | 70th | 75th | 80th | 85th | 90th | 95th |
|
| |||||||||||||||||||
| 40 | 0.1 | 0.1 | 0.1 | 0.2 | 0.2 | 0.2 | 0.3 | 0.3 | 0.4 | 0.5 | 0.5 | 0.6 | 0.7 | 0.8 | 1.1 | 1.3 | 1.8 | 2.7 | 4.0 |
| 45 | 0.3 | 0.3 | 0.4 | 0.5 | 0.5 | 0.7 | 0.8 | 0.9 | 1.0 | 1.1 | 1.3 | 1.5 | 1.8 | 2.1 | 2.6 | 3.0 | 4.1 | 5.6 | 9.3 |
| 50 | 0.6 | 0.9 | 1.0 | 1.3 | 1.5 | 1.8 | 2.1 | 2.3 | 2.6 | 2.9 | 3.3 | 3.7 | 4.1 | 4.7 | 5.5 | 6.7 | 8.4 | 10.1 | 15.0 |
| 55 | 1.4 | 1.9 | 2.3 | 3.1 | 3.5 | 3.8 | 4.2 | 4.7 | 5.2 | 5.6 | 6.1 | 6.8 | 7.6 | 8.4 | 9.3 | 10.4 | 12.3 | 14.3 | 19.4 |
| 60 | 3.1 | 4.3 | 4.8 | 5.4 | 6.2 | 6.7 | 7.1 | 7.5 | 8.0 | 8.6 | 9.7 | 11.0 | 11.3 | 12.2 | 13.1 | 15.0 | 18.0 | 20.1 | 25.6 |
| 65 | 6.0 | 7.2 | 7.8 | 8.4 | 9.0 | 9.7 | 10.3 | 11.5 | 12.1 | 13.2 | 14.7 | 15.6 | 16.4 | 17.9 | 20.0 | 22.1 | 23.6 | 28.2 | 33.5 |
| 70 | 9.1 | 10.6 | 11.1 | 11.8 | 12.9 | 13.7 | 14.4 | 16.1 | 16.6 | 17.3 | 18.6 | 19.9 | 23.2 | 24.6 | 25.9 | 28.1 | 29.9 | 33.8 | 39.4 |
| 75 | 13.4 | 15.7 | 16.8 | 17.8 | 18.2 | 19.0 | 20.5 | 21.2 | 23.0 | 23.9 | 25.3 | 26.8 | 29.8 | 31.7 | 33.9 | 36.5 | 38.0 | 40.4 | 48.0 |
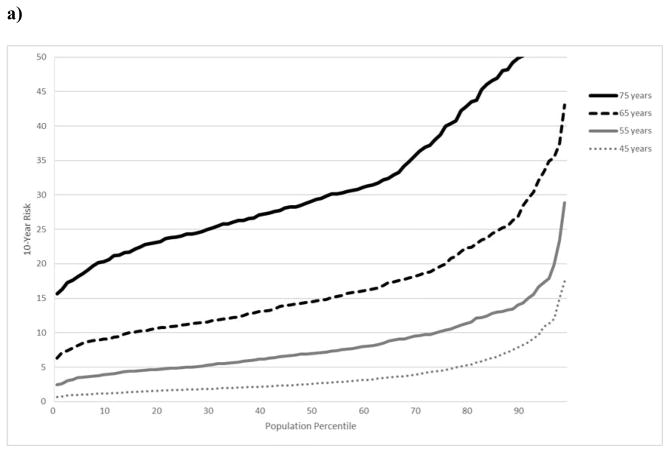
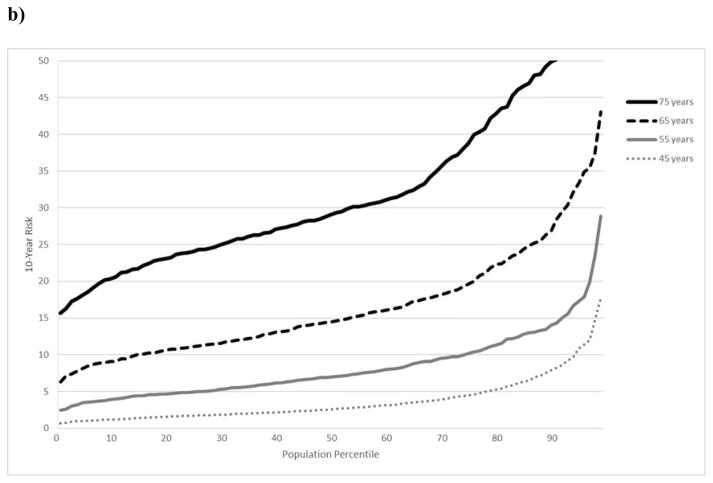
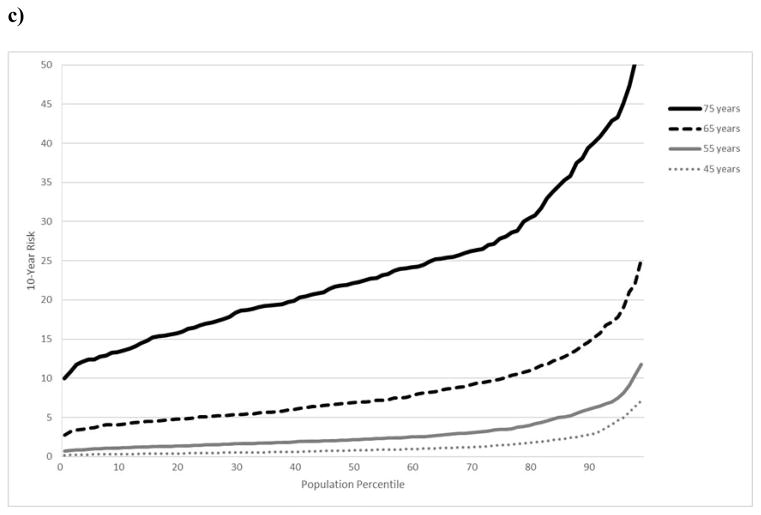
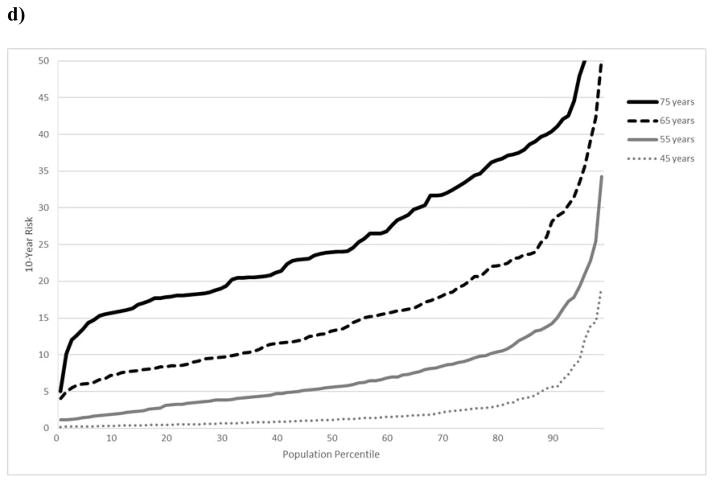
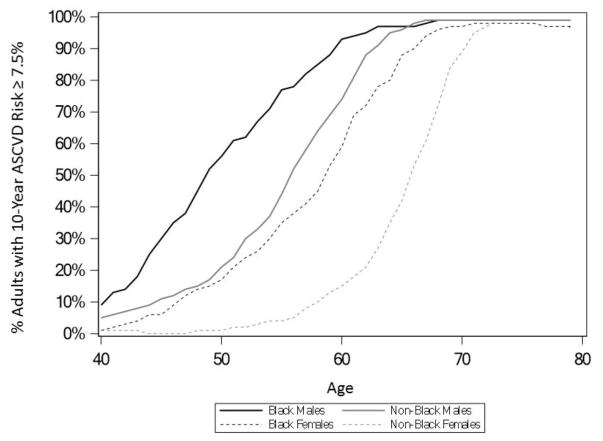
Age plays a strong role in the PCE, given its association with cardiovascular disease. As a result, the relative health of a person at any 10-year risk threshold depends largely on their age. To illustrate this, Figures 1a–d show the distribution of 10-year ASCVD risk for black and non-black males and females at age 45, 55, 65, and 75, presented as cardiovascular risk percentile curves. At age 45, a non-black male with a 10-year ASCVD risk of 7.5% is at the 89th percentile for men his age (only 11% have higher risk). Conversely, at age 65, a non-black male with a 10-year ASCVD risk of 7.5% is only at the 5th percentile in the population (95% have higher risk). Due to the significant role that age plays in the PCE, nearly all adults in the United States have a 10-year risk of 7.5% or greater by a certain age, which happens to be the risk threshold at which the 2013 ACC/AHA cholesterol guideline recommends statins. Figure 2 shows the proportion of adults at each age who have a 10-year risk of 7.5% or greater. By age 73, 99% of both black and white women met or exceeded a 10-year risk of 7.5%. For men, this age was lower; by age 68 and 67, respectively, 99% of black and non-black males had a 10-year risk of 7.5% or higher.
Figure 1. Risk Percentiles of 10-year ASCVD Risk.
Cardiovascular disease risk percentiles of 10-year ASCVD risk age 45, 55, 65, and 75 in United States adults free of CVD, grouped by: a) non-black males; b) black males; c) non-black females; and d) black females.
ASCVD indicates atherosclerotic cardiovascular disease; CVD, cardiovascular disease
Figure 2. Proportion of CVD-free Adults Meeting or Exceeding 10-year ASCVD Risk.
Proportion of CVD-free adults at each age meeting or exceeding a 10-year ASCVD risk of ≥7.5%.
ASCVD indicates atherosclerotic cardiovascular disease; CVD, cardiovascular disease
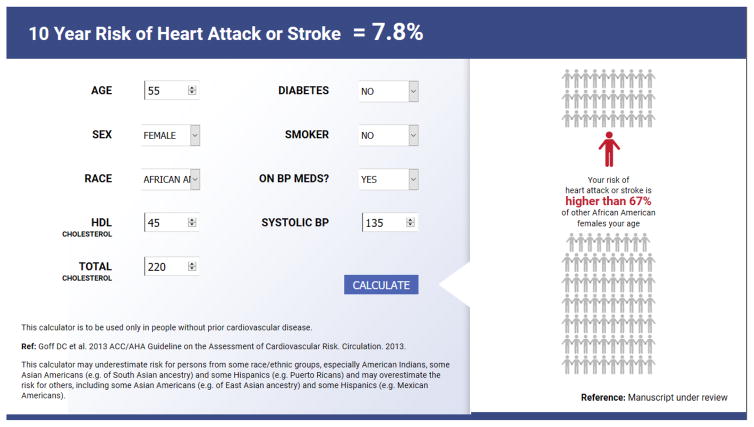
In order to facilitate using cardiovascular risk percentiles as part of risk communication, we have developed an online free application that calculates a person’s 10-year ASCVD risk and estimates specific age-, sex-, and race-specific percentiles by 1-year age grouping; this application is available online at populationrelativerisk.dcri.org (Figure 3, screenshot).
Figure 3. Online 10-year ASCVD Risk to Cardiovascular Risk Percentile Conversion Tool.
Screen capture of online tool converting 10-year ASCVD risk into cardiovascular risk percentile
ASCVD indicates atherosclerotic cardiovascular disease
DISCUSSION
A person’s 10-year ASCVD risk is routinely used to determine statin recommendations. While 10-year risk is useful for guiding treatment decisions, absolute risk estimates presented as a 10-year absolute risk may not be sufficient. Using data from NHANES, we created a way to translate 10-year risk into a standardized cardiovascular risk percentiles, thereby allowing patients to know how their 10-year risk compares to their age-, race-, and sex-matched peers in the United States. Providing individuals with information on how their profiles compare with their peers is not without precedent. Sex-specific growth charts used to track weight and height for pediatric patients show parents and caregivers how a child’s weight and height compares with their peers. Test scores are also commonly reported as percentiles, with students learning not only their raw score, but also how their score places them among their peers.
Using cardiovascular risk percentiles to communicate risk may help overcome some limitations with using 10-year ASCVD risk alone to communicate a person’s likelihood of cardiovascular disease. First, contextualizing 10-year risk as a risk percentile allows for more separation of estimates between the lowest and highest risk adults. In younger adults, the distribution of 10-year risk for the majority of adults is narrow. In 45-year-old white males, a 10-year risk difference of <4% separates the bottom and top quintiles of adults in the population. Second, low absolute values of 10-year risk in young adults can pose challenges for risk communication. Although clinicians may recognize a 40-year-old white female with a 10-year risk of 5% as being at high risk for her age, the absolute risk is still low. Putting this into context by also communicating that this risk puts her at a risk higher than 97% of other white females may help improve her understanding of her personal risk and perhaps motivate behavior change. Additionally, standardized risk percentile estimates are based on modifiable risk factors, since the effect of race, sex, and age are removed when risk percentiles are calculated relative to age-, sex-, and race-matched peers.
On the other end of the spectrum, many older adults may have high absolute cardiovascular disease risk due to age alone, but are at a low risk percentile. For example, a black male with an ASCVD risk of 7.5% at age 65 is only in the 3rd percentile of risk. Acknowledging to the patient that while he is healthier than the vast majority of his peers, he still has potential to benefit from a statin therapy may allow providers simultaneously communicate the potential benefits of statins while reinforcing other positive risk factors. Ultimately, the goal of risk communication is not to convince adults to take statins; rather, the intention is to improve an individual’s understanding of his or her personal risk, so he or she can make informed decisions. Certain healthy older adult at high absolute risk based on age alone with a low risk percentile may choose not to initiate statin therapy.
Since cardiovascular risk percentiles are derived from 10-year ASCVD risk, its accuracy depends on the PCE accuracy. The PCE has been criticized for overestimating risk; as a result, some have asked for the PCE to be recalibrated.6,7 Fortunately, because risk percentiles are age-, sex-, and race-specific, as well as derived from how adults compare with one other in each group, they are agnostic to calibration errors. Cardiovascular risk percentile estimates require only the model to discriminate well, which the PCE has been shown to do in multiple external analyses. Importantly, population risk percentiles can only reflect a person’s relative risk to their peers based on the factors measured in the model. Other protective risk factors such as physical activity, diet, and weight are not factored into cardiovascular risk percentile calculations, nor are factors such as family history, coronary artery calcium, or age of comorbidity onset. Therefore, clinicians should consider risk percentiles, like 10-year ASCVD risk, as only part of a larger, more comprehensive discussion about cardiovascular disease risk and prevention.
Another potential drawback of using cardiovascular risk percentiles is that this calculation is sex- and race-specific; consequently, risk percentiles can inadvertently downplay the effect of male sex and black race as being risk factors for cardiovascular disease. Similarly, if certain subgroups of the population have overall poorer risk factor control, then standardizing cardiovascular risk percentile estimates to that particular population may downplay an individual’s personal risk. Clinicians should emphasize that the non-modifiable risk factors of age, sex, and race do play a role, which is why we recommend calculating and sharing a patient’s 10-year absolute risk, as well as their standardized cardiovascular risk percentiles.
Population RELATIVE RISK holds great promise for improving a patient’s understanding of his or her personal risk, but this concept should be pilot-tested in various populations to determine the impact of using standardized cardiovascular risk percentiles in addition to 10-year risk on patient risk perception, understanding, and motivation for behavior change. Cardiovascular risk percentile may be more motivating than absolute risk, since it introduces an aspect of competition for adults to improve their health relative to their peers. Future work evaluating the impact of different methods of risk communication as part of a comprehensive discussion about cardiovascular disease risk, prevention, and therapy options is needed to determine optimal strategies for patient engagement in cardiovascular disease prevention efforts.
Limitations
Our study must be considered in light of some limitations. First, cardiovascular risk percentiles are calculated using data from 2009–2014 and, therefore, will require updates as new population data become available. Second, we did not consider adults who had preexisting cardiovascular disease; as a result, the patients we studied were only compared to adults who were free of cardiovascular disease, as opposed to the entire population. Finally, we chose to calculate race-specific cardiovascular risk percentiles because the PCE are race-specific.
CONCLUSIONS
Individually and collectively, age, sex, and race are risk factors for cardiovascular disease, so the relative severity of absolute 10-year ASCVD risk estimates varies substantially according to these non-modifiable factors. By evaluating the distribution of 10-year ASCVD risk in the United States population using data from NHANES, 10-year risk estimates can be translated into standardized cardiovascular risk percentiles, allowing patients to know how their risk compares with their age-, sex-, and race-matched peers.
Acknowledgments
The authors would like to thank Erin Campbell, MS, for her editorial contributions to this manuscript. Ms. Campbell did not receive compensation for her assistance, apart from her employment at the institution where this study was conducted.
SOURCES OF FUNDING
This manuscript was supported by funding from the NHLBI (K01HL133416-01).
Footnotes
CONFLICT OF INTEREST DISCLOSURES
AM Navar: Dr. Navar is supported by a research grant from NHLBI (K01HL133416-01), and receives research funding from Amgen Inc., Sanofi Pharmaceuticals, and Regeneron Pharmaceuticals, as well as honoraria for research consulting for Sanofi and Amgen Inc.
MJ Pencina: Dr. Pencina reports research support from Regeneron and Sanofi Pharmaceuticals.
H Mulder: Ms. Mulder has no relevant disclosures to report.
P Elias: Dr. Elias has no relevant disclosures to report.
ED Peterson: Dr. Peterson receives consultant/honoraria from AstraZeneca, Bayer, Janssen, Merck & Co., Sanofi; research grants from AstraZeneca, Bayer, Daiichi Sankyo, Genetech, Janssen, Regeneron, Sanofi, Merck & Co, and Amgen Inc.
Publisher's Disclaimer: This is a PDF file of an unedited manuscript that has been accepted for publication. As a service to our customers we are providing this early version of the manuscript. The manuscript will undergo copyediting, typesetting, and review of the resulting proof before it is published in its final citable form. Please note that during the production process errors may be discovered which could affect the content, and all legal disclaimers that apply to the journal pertain.
References
- 1.Stone NJ, Robinson JG, Lichtenstein AH, Bairey Merz CN, Blum CB, Eckel RH, Goldberg AC, Gordon D, Levy D, Lloyd-Jones DM, McBride P, Schwartz JS, Shero ST, Smith SC, Jr, Watson K, Wilson PW American College of Cardiology/American Heart Association Task Force on Practice Guidelines. 2013 ACC/AHA guideline on the treatment of blood cholesterol to reduce atherosclerotic cardiovascular risk in adults: a report of the American College of Cardiology/American Heart Association Task Force on Practice Guidelines. J Am Coll Cardiol. 2014;63:2889–2934. doi: 10.1016/j.jacc.2013.11.002. [DOI] [PubMed] [Google Scholar]
- 2.Whelton PK, Carey RM, Aronow WS, Casey DE, Collins KJ, et al. 2017 ACC/AHA/AAPA/ABC/ACPM/AGS/APhA/ASH/ASPC/NMA/PCNA Guideline for the Prevention, Detection, Evaluation, and Management of High Blood Pressure in Adults. Hypertension. 2017:70. [Google Scholar]
- 3.Navar AM, Stone NJ, Martin SS. What to say and how to say it: Effective communication for cardiovascular disease prevention. Curr Opinion Cardiology. 2016;31:537–544. doi: 10.1097/HCO.0000000000000322. [DOI] [PMC free article] [PubMed] [Google Scholar]
- 4.Trevana LJ, Zikmund-Fisher BJ, Edwards A, Gaissmaier W, Galesic M, et al. Presenting quantitative information about decision outcomes: a risk communication primer for patient decision aid developers. BMC Medical Informatics and Decision Making. 2013;13(Suppl 2):S7. doi: 10.1186/1472-6947-13-S2-S7. [DOI] [PMC free article] [PubMed] [Google Scholar]
- 5.Yamagishi K. When a 12.86% mortality is more dangerous than 24.14%: implications for risk communication. App Cog Psych. 1997;11:495–506. [Google Scholar]
- 6.Fair AK, Murray PG, Thomas A, Cobain MR. Using hypothetical data to assess the effect of numerical format and context on the perception of coronary heart disease risk. Am J Health Promot. 2008;22:291–296. doi: 10.4278/061030140R2.1. [DOI] [PubMed] [Google Scholar]
- 7.Goff DC, Jr, Lloyd-Jones DM, Bennett G, Coady S, D’Agostino RB, Gibbons R, Greenland P, Lackland DT, Levy D, O’Donnell CJ, Robinson JG, Schwartz JS, Shero ST, Smith SC, Jr, Sorlie P, Stone NJ, Wilson PW, Jordan HS, Nevo L, Wnek J, Anderson JL, Halperin JL, Albert NM, Bozkurt B, Brindis RG, Curtis LH, DeMets D, Hochman JS, Kovacs RJ, Ohman EM, Pressler SJ, Sellke FW, Shen WK, Smith SC, Jr, Tomaselli GF American College of Cardiology/American Heart Association Task Force on Practice Guidelines. 2013 ACC/AHA guideline on the assessment of cardiovascular risk: a report of the American College of Cardiology/American Heart Association Task Force on Practice Guidelines. Circulation. 2014;129:S49–73. doi: 10.1161/01.cir.0000437741.48606.98. [DOI] [PubMed] [Google Scholar]
- 8.Chatterjee N, Gatswirth JL, Graubard BI. The use of the risk percentile curve in the analysis of epidemiologic data. Stats and its Interface. 2009;2:123–131. [Google Scholar]
- 9.Muntner P, Colantonio LD, Cushman M, Goff DC, Jr, Howard G, Howard VJ, Kissela B, Levitan EB, Lloyd-Jones DM, Safford MM. Validation of the atherosclerotic cardiovascular disease Pooled Cohort Risk equations. JAMA. 2014;311:1406–1415. doi: 10.1001/jama.2014.2630. [DOI] [PMC free article] [PubMed] [Google Scholar]
- 10.Cook NR, Ridker PM. Calibration of the Pooled Cohort Equations for atherosclerotic cardiovascular disease: an update. Ann Intern Med. 2016;165:786–794. doi: 10.7326/M16-1739. [DOI] [PubMed] [Google Scholar]


