

Abstract
TMEM175 is a lysosomal K+ channel important for maintaining the lysosomal membrane potential and pH stability1. It contains two homologous copies of a six-transmembrane (6-TM) domain, which has no sequence homology to the canonical tetrameric K+ channels and lacks the TVGYG selectivity filter motif2–4. Present in a subset of bacteria and archaea, the prokaryotic TMEM175 contains only a single 6-TM domain and functions as a tetramer. Here, we present the crystal structure of a prokaryotic TMEM175 from Chamaesiphon minutus, CmTMEM175, whose architecture represents a completely different fold from that of canonical K+ channels. All six transmembrane helices of CmTMEM175 are tightly packed within each subunit without undergoing domain swap. The highly conserved TM1 acts as the pore lining inner helix, creating an hour-glass shaped ion permeation pathway in the channel tetramer. Three layers of hydrophobic residues on the C-terminal half of TM1s form a bottle neck along the ion conduction pathway and serve as the selectivity filter of the channel. Mutagenesis analysis suggests that the first layer of the highly conserved isoleucine residues in the filter plays the central role in channel selectivity. Thus, the structure of CmTMEM175 represents a novel architecture of a tetrameric cation channel whose ion selectivity mechanism appears distinct from that of the classical K+ channel family.
Acidic lysosomal organelles mediate crucial biological processes such as degradation, catabolite export, and metabolism-sensing5–7, and defects to these processes can result in lysosomal storage diseases8–10. The lysosomal membrane is decorated with channels and transporters that regulate the lysosome’s ionic homeostasis and physiological functions5,11,12. Recently, a previously uncharacterized transmembrane protein 175 (TMEM175) was identified as the bona fide endo/lysosomal K+ channel, whose function is important for setting the lysosomal membrane potential and maintaining pH stability1. TMEM175 deficiency has been shown to play a critical role in Parkinson disease pathogenesis13,14.
The mammalian TMEM175 contains two homologous 6-TM domains and is suggested to function as a dimer1. Since TMEM175 lacks the TVGYG motif and sequence homology to canonical 6-TM K+ channels2–4, it is predicted to adopt a distinct structure and K+ selectivity mechanism from classical K+ channels. Present among some bacteria and archaea, the prokaryotic TMEM175 (bacTMEM175) contains a single copy of a 6-TM domain in each subunit (Extended Data Fig. 1). Several bacTMEM175s can be overexpressed and purified as tetramers in solution (Extended Data Fig. 2), supporting the prediction that eukaryotic TMEM175 with two 6-TM domains functions as a dimer. The bacTMEM175 from Chamaesiphon minutus, CmTMEM175, yielded the best diffracting crystals and will be the focus of this study.
We first tested if CmTMEM175 functions as a K+-selective channel. Unable to record CmTMEM175 channel current using electrophysiology, we therefore utilized a 86Rb flux assay15 to measure K+ permeation and selectivity, based on the premise that CmTMEM175 can conduct K+ as well as Rb+ (Methods). Briefly, CmTMEM175 was reconstituted into liposomes containing high concentrations of KCl. Upon exchanging the proteoliposomes to a low salt reaction buffer containing 86Rb, the K+ concentration gradient across the liposomal membrane drives K+ efflux through CmTMEM175, generating an electrical driving force for the influx of radioactive 86Rb (Methods). Fig. 1a shows the time-dependent accumulation of 86Rb inside K+-loaded proteoliposomes, confirming that CmTMEM175 is permeable to K+ and Rb+. The same flux assay performed using proteoliposomes loaded with NaCl shows much weaker liposomal 86Rb accumulation (Fig. 1b), indicating that CmTMEM175 conducts K+ better than Na+.
Figure 1.
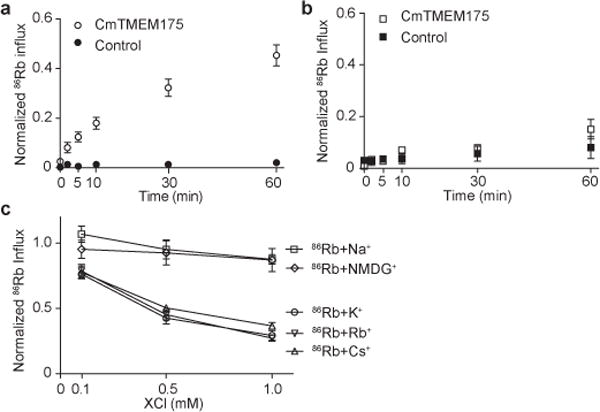
86Rb flux assay of CmTMEM175. a, Time dependent 86Rb influx into CmTMEM175 proteoliposomes prepared in KCl; control liposomes contained no protein. Data are normalized against the maximum 86Rb influx obtained by adding 1 μg/ml of valinomycin to the reaction. b, Time dependent 86Rb flux into CmTMEM175 proteoliposomes prepared in NaCl. Data are normalized against the maximum 86Rb influx obtained by adding 10ug/ml of gramicidin A to the reaction. c, Competition assay of 86Rb influx in the presence of external monovalent cations. Three concentrations of each cation (0.1, 0.5 and 1.0 mM) were tested. Data are normalized against the control measurement in which no external cations were added. All data points are mean ± SEM of 2-4 measurements.
To evaluate channel selectivity, we performed a competition assay by measuring 86Rb influx in the presence of various external monovalent cations; conductive ions would compete with 86Rb and decrease its liposomal accumulation over time. The competition assay indicates that CmTMEM175 is permeable to K+, Rb+ and Cs+, which caused a reduction in 86Rb accumulation in comparison to the control experiment (Fig. 1c). The channel is unable to conduct Na+ and the large organic cation N-methyl-D-glucamine (NMDG+), both of which have no obvious effect on 86Rb influx. These results show that CmTMEM175 is selective for K+, Rb+ and Cs+ over Na+, consistent with the selectivity of the eukaryotic TMEM175.
The structure of CmTMEM175 was determined and refined to 3.3 Å (Methods and Extended Data Fig. 3). Consistent with biochemical data, CmTMEM175 adopts a 4-fold symmetric, square-shaped tetramer in the crystal with a dimension of about 61 Å on each side and a height of about 60 Å (Fig. 2). Each subunit contains six transmembrane (TM) helices with both N- and C- termini predicted to be on the cytosolic side. TMs 1-3 are positioned on the inner circle of the channel tetramer and participate in inter-subunit interactions central to the assembly of the ion conduction pore. TMs 4-6 are positioned on the periphery of the channel and do not contribute to any contacts with neighboring subunits. Not surprisingly, TMs 1-3 have higher sequence conservation than TMs 4-6 among TMEM175 homologs. TM1 and 2 are linked by an extended, strand-like tail and two short helices (H1 and H2). This linker protrudes outward from the main body of the transmembrane domain and encloses the external open entrance of the ion conduction pore in the channel tetramer. TM3 is bent into two segments (TM3a and TM3b) due to the presence of a conserved proline (Pro102) (Fig. 2 and Extended Data Fig. 1).
Figure 2.
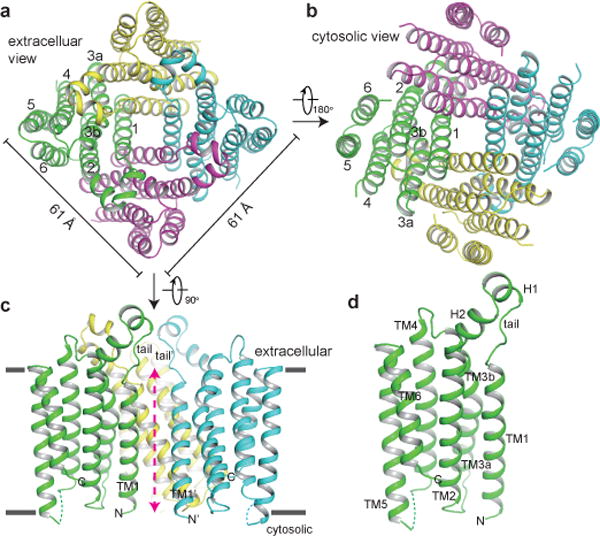
Overall structure of CmTMEM175. Cartoon representation of the CmTMEM175 tetramer from the extracellular (a) and cytosolic (b) sides. Each subunit is individually colored. c, Side view of CmTMEM175 with the front subunit removed for clarity. Red arrow marks the ion conduction pore axis. d, A single subunit of CmTMEM175 in the same orientation as in c.
In comparison, the structure of CmTMEM175 is completely different from that of canonical 6-TM homo-tetrameric K+ channels16,17 (Extended Data Fig. 4). First, all six transmembrane helices of CmTMEM175 are tightly packed within each subunit without undergoing any domain swap. Second, the two central pore elements in canonical K+ channels, the pore helix and the TVGYG selectivity filter, are not present in CmTMEM175. Third, in CmTMEM175, TM1 instead of TM6 forms the pore-lining inner helix at the center of the channel. Finally, a search of the structure database using DALI18 yields no similar structures, indicating that the 6-TM architecture of CmTMEM175 represents a new fold.
The pore-lining TM1 represents the most conserved region in the TMEM175 family. Four TM1 helices form a bundle crossing, which, along with their extended C-terminal tails, create an hour-glass shaped ion permeation pathway (Fig. 3a-c). No specifically bound ions were observed along the pathway even in crystals soaked with heavier mono- or divalent cations. The bundle crossing juncture contains three layers of highly conserved hydrophobic residues – Ile23s, Leu27s and Leu30s – that form a 10-Å long bottle neck with a diameter of about 3 Å at each constriction point. The N-terminal half of TM1 lines the cytosolic entrance of the hour-glass pathway with a negatively charged surface potential (Fig. 3d) while the extended C-terminal tail of TM1 along with the C-terminal half of TM3 (TM3b) enclose the extracellular entrance of the pathway with a slightly negative surface potential.
Figure 3.

CmTMEM175 ion conduction pore. a, The hour-glass shaped ion conduction pathway shown as purple mesh. b, Radius along the central pore axis. c, Zoomed-in views of the three layers of hydrophobic residues that form the bottle neck, labeled with atom-to-atom distances in Å. d, Cross section through the pore showing the surface electrostatic potential at both entrances. e, The RxxxFSD motif in the channel tetramer and zoomed-in view (inset) of the RxxxFSD-mediated inter- and intra-subunit interactions from one subunit (in yellow). Residues from the neighboring subunits are marked with single or double quotation marks.
The N-terminal part of TM1 also contains the 12RxxxFSD18 signature sequence motif that is important for TMEM175 channel function1. These residues coordinate a network of specific inter- and intra-subunit interactions with several other highly conserved residues on TM2 and 3 and play a crucial role in the tetrameric assembly of the channel. As shown in Fig. 3e, Arg12 forms cation-π interaction with His74 from TM2 of a neighboring subunit; Phe16 forms π-π stacking with Trp70 from TM2 of the neighboring subunit; Ser17 forms an intra-subunit H-bonding network with His73 on TM2 and Asn91 on TM3; Asp18 forms a hydrogen bond with Trp70 of same subunit, which participates in the π-π stacking with Phe16 of the neighboring subunit.
With wide open entrances on both sides of the membrane, the only possible region that can control ion flux of CmTMEM175 is the narrow hydrophobic bottle neck. Intuitively, this poses a conundrum given our understanding of what constitutes a K+ selective ion conduction pore: How can charged ions move across this narrow tunnel whose size is equivalent to a closed tetrameric cation channel gate19,20,21? However, ion permeation through a narrow hydrophobic pathway is not unprecedented. One example is the pentameric bestrophin channel in which three layers of hydrophobic residues create a 10Å long, 3Å wide ion pathway resembling that of CmTMEM175 (Extended Data Fig. 5)22,23. Intriguingly, the animal Bestrophin channel, whose narrow pathway is formed by three layers of Ile, Phe, and Phe, is an anion selective channel while the bacterial Bestrophin, which contains Ile, Ile, and Phe at the bottle neck, has been shown to be cation selective channel22,24,25.
To examine the potential role of the narrow hydrophobic bottle neck of TMEM175 in controlling ion selectivity, we performed a series of mutagenesis on the three layers of hydrophobic residues (Extended Data Fig. 6a) in human TMEM175 (hTMEM175) expressed in HEK293 cells. The plasma membrane-localized hTMEM175 channel activity can be measured using whole-cell patch clamping (Methods), which exhibits the same K+ and Cs+ selectivity as well as the pharmacological properties (i.e. Zn2+ and 4-AP blockage) as previously observed by the lysosomal patch method1 (Extended Data Fig. 6). When the 2nd or the 3rd layer of hydrophobic residues were replaced by alanine, either individually or collectively, the mutant channels remain K+/Cs+ selective (Fig. 4a and Extended Data Fig. 6g). However, the first layer Ile residues are highly sensitive to mutations and no channel activity was observed when they were mutated to Val, Leu, Phe or Ala. Interestingly, the two Ile residues can be replaced with Asn, resulting in a mutant channel that is no longer K+/Cs+ selective (Fig. 4a and Extended Data Fig. 6e-h). These results suggest that the Ile residues at the internal mouth of the narrow pathway play the central role in selectivity.
Figure 4.

Selectivity analysis of hTMEM175 and CmTMEM175. a, I-V curves of hTMEM175 and its filter mutations. Currents were recorded using whole-cell configuration, 150 mM Cs+ in pipette and 150 mM K+ (red traces) or Na+ (black traces) in bath. Complete measurement of hTMEM175 selectivity is shown in Extended Data Fig. 6. b, 86Rb competition assay on CmTMEM175 Ile23 mutants. Three concentrations of external Na+, K+ or NMDG+ (0.1, 0.5 and 1.0 mM) were tested; shown are mean ± SEM of two measurements.
We also performed mutagenesis on the first layer of Ile residues (Ile23s) on CmTMEM175 by replacing them with Cys, Ala, or Asn, and analyzed the selectivity using the 86Rb flux assay. These mutants were expressed, purified and reconstituted into the liposomes loaded with KCl, and their selectivity was measured by a competition assay with external K+, Na+ or NMDG+ (Fig. 4b). Both external K+ and Na+, but not NMDG+, resulted in a concentration-dependent decrease of 86Rb influx into proteoliposomes of the CmTMEM175 mutants, indicating that the mutant channels can conduct both Na+ and K+. This result confirms the central role of the layer 1 Ile23 in defining the K+ selectivity of CmTMEM175.
With a structure so different from canonical K+ channels, how does TMEM175 achieve its K+ selectivity? The narrow hydrophobic filter of CmTMEM175 is reminiscent of hydrophobic nanochannels such as synthetic organic nanopore or single-walled carbon nanotube and the radius-dependent selectivity of these nanochannels might provide a plausible explanation26–29. Computationally, nanochannels with a sub-nanometer pore size (i.e. r < 5 Å) have been suggested to achieve higher selectivity for K+ over Na+, because the energetic cost of shedding water from the ion hydration shell or constraining a hydrated ion inside a narrow hydrophobic pore is lower for K+ than Na+. With an extremely narrow hydrophobic pathway of 3 Å in diameter, ion passage through the TMEM175 filter has to be in a partially dehydrated form with only two coaxial water molecules remaining, one on each side, and is expected to be energetically unfavorable. Two features of the TMEM175 structure may help in overcoming the energy barrier for ion passage. First, the electronegative surface potential on both entrances can attract and stabilize the positively charged ions and effectively increase the local cation concentration. Second, the hour glass architecture of the ion pathway effectively reduces the thickness of the membrane barrier, allowing for the membrane potential to drop across the 10 Å filter region and, thereby, significantly enhances the electrochemical driving force for ion permeation. It is also worth noting that the narrow pathway observed in the CmTMEM175 structure likely represents a closed filter with the minimum size as the side chain of two neighboring Ile23s is only about 3.3 Å apart (Fig. 3), reaching the closest van der Waals distance between two non-covalent carbon atoms. It is unclear how TMEM175 is gated, but we suspect that the filter also serves as the channel gate whose size could be wider than 3 Å upon opening. In conclusion, our structural and functional studies on CmTMEM175 offer an unconventional way of looking at a presumed complete story on the selectivity of the well-studied family of tetrameric K+ channels.
Methods
Protein expression and purification
20 genes of prokaryotic TMEM175 homologs were chemically synthesized (Biomatik), sub-cloned into pET15b expression vectors and tested for expression in E. coli. Several of them can be over-expressed in E.coli, stabilized in n-decyl-ß-D-maltopyranoside (DM) detergent, and purified to homogeneity. TMEM175 from Chamaesiphon minutus (CmTMEM175) yields the best diffracting crystals for structure determination in this study and will be used for the description of protein expression and purification. The full-length Chamaesiphon minutus TMEM175 (NCBI: WP_015160509.1) gene was sub-cloned into pET15b vector (Novagen) with the resulting construct containing sequences for an N-terminal hexahistidine tag and thrombin cleavage site. E. coli BL21 (DE3) cells were transformed, cultured in 2YT medium initially at 37 °C to the optical density (OD600) of 0.4, and then at a reduced temperature of 30 °C; overexpression was induced with 0.1 mM isopropyl β-D-thiogalactoside (IPTG) at the OD600 of 0.6. Cells were harvested 6 hours after induction and homogenized with an emulsiflex-C5 homogenizer (Avestin) in buffer containing 50 mM HEPES, pH 7.4, 200 mM KCl, 1 μg/mL leupeptin, 1 μg/mL pepstatin A, 2 μg/mL DNaseI, 1 μg/mL Aprotinin, and 1 mM PMSF. Cell lysate was incubated with 1% (w/v) n-dodecyl-β-D-maltopyranoside (DDM; Anatrace) for 3 hours at room temperature for protein extraction. The supernatant was collected after a 45-minute centrifugation at 48,384 g, supplemented with 5 mM imidazole and loaded onto a Talon Co2+ affinity column (Clontech) pre-equilibrated with 20 mM HEPES pH7.4, 200 mM KCl, and 1 mM DDM. The protein was eluted with the equilibration solution containing 300 mM imidazole and digested overnight at 4 °C with Thrombin (1 Unit/5g wet cells; Roche) to remove the hexahistidine tag. The sample after digestion was concentrated using 100 KDa cut-off Amicon Centrifugal Filter (EMD Millipore) and further purified by gel filtration using a Superdex-200 (10/30 GL) column (GE Healthcare) in 20 mM HEPES, pH 7.4, 200 mM KCl, 0.5 mM decyl maltose neopentyl glycol (DMNG, for crystallization and functional assays) or 3 mM n-decyl-β-D-maltopyranoside (DM, for biochemical assays). Peak fractions were collected and concentrated for further experiments. To facilitate model building, more than ten CmTMEM175 mutants with a single-cysteine substitution at various parts of the protein were generated using QuikChange II Site-Directed Mutagenesis Method (Agilent). All mutants were expressed, purified and crystallized in similar conditions as the wild-type protein.
Crystallization
CmTMEM175 was purified in DMNG and concentrated to 6 mg/mL for crystallization. Crystals were grown at 20 °C using sitting-drop vapor diffusion method. Crystals appeared within 3 days in a condition of 16-22% PEG 1000, 50 mM CaCl2, 50 mM MgCl2 and 100 mM NaAc, pH 4.6, and grew to their full size in 2-4 weeks. Crystals were cryo-protected by adding the cryo-solution containing 25% PEG 1000, 10% glycerol, 50 mM CaCl2, 50 mM MgCl2, 0.5 mM DMNG and 100 mM NaAc, pH 4.6 directly into the crystallization drop and flash-frozen in liquid nitrogen. To obtain experimental phasing, crystals were derivatized overnight by adding methyl mercury chloride (CH3HgCl) solubilized in the stabilization solution of 25% PEG 1000, 50 mM CaCl2, 50 mM MgCl2, 0.5 mM DMNG, 100 mM NaAc, pH 4.6 into the crystallization drops to a final concentration of 1 mM.
Two different types of crystals were obtained under the same crystallization conditions, one has a C2 space group and the other is P1. C2 crystals diffracted up to 3.3 Å and were used for structure determination, whereas P1 crystals generally diffracted up to 4.0 Å. We noticed that freshly purified protein tended to be crystallized in P1 space group, whereas leaving purified protein on ice for three days before crystallization yielded more C2 crystals. The structures of P1 crystals were also determined by molecular replacement method using wild type C2 crystal structure as the search model and showed no obvious difference.
Data collection and structure determination
X-ray diffraction data was collected using synchrotron radiation source (Advanced Photon Source 23IDB and 23IDD; Advanced Light Source BL8.2.1 and BL8.2.2). The best diffracting crystal belongs to space group C2 with cell dimensions of a = 152.66 Å, b = 108.88 Å, c = 119.31 Å, α = 90°, β = 117.24°, γ = 90°, and contains four subunits per asymmetric unit. To maximize the anomalous signal, the mercury-derivative data were collected near the mercury absorption edge (λ = 1.0064 Å).
All diffraction data were integrated and scaled using the HKL2000 package30. Since the diffraction data were slightly anisotropic, ellipsoidal truncation, anisotropic scaling and B-factor sharpening were applied to the data using two approaches. For initial phasing and map calculation, “auto-correction” function in HKL2000 was applied to the native and mercury-derivative data, which yielded better experimental maps. For structure refinement, the native data were truncated to 1/3.7 Å−1 along a*, 1/3.6 Å−1 along b*, 1/3.3 Å−1 along c* using the UCLA anisotropy server31. After anisotropic scaling, an isotropic B-factor of -67.64 Å2 was applied.
The structure was determined by single isomorphous replacement with anomalous scattering (SIRAS) using the native and mercury-derivative data (Extended Data Table 1). The heavy atom positions were determined in SHELXD32 and refined in AutoSharp33. The initial phases were improved by solvent flattening with SOLOMON34, and four-fold non-crystallographic symmetry averaging with RESOLVE35, generating electron density map of sufficient quality for model building. The model was manually built in COOT36 and refined with Phenix37. To facilitate accurate model building, more than ten mutants containing single cysteine substitution at various parts of the protein were generated, crystallized and derivatized with CH3HgCl. The heavy atom sites from these mutants as well as wild-type crystals provided unambiguous registry for 11 residues throughout the protein, allowing us to accurately model the structured regions of CmTMEM175. The final model was refined to 3.3 Å with Rwork=25.9% and Rfree= 28.2% and contained residues 7-144 and 154-202 from the protein, covering 93% of the protein sequence. The geometry analysis of the final model with Procheck38 gave statistics of 97.5% and 2.5% for the most favored and additional allowed regions, respectively, on the Ramachandran plot. The pore radius of the ion conduction pathway was analyzed using the program HOLE39 and the electrostatic potentials were calculated using the program APBS40. All structure figures were prepared with Pymol41.
Protein reconstitution and 86Rb flux assay
All proteins used in the flux assay were purified in the DMNG detergent and reconstituted into lipid vesicles composed of 1-palmitoyl-2-oleoyl-phosphatidylethanolamine (POPE, 7.5 mg/mL) and 1-palmitoyl-2-oleoyl-phosphatidylglycerol (POPG, 2.5 mg/mL) at a protein/lipid ratio of 2 μg/mg using the same method as described15 with the following modifications: 20 mM DM was used to solubilize the lipid and the detergent/lipid/protein mixture were dialyzed against a reconstitution buffer of 10 mM HEPES buffered with 4 mM NMDG, pH 7.4, and 450 mM KCl or NaCl to slowly remove the detergent. The reconstituted liposome samples were kept at -80 °C in 100 μL aliquots.
The 86Rb flux assay was performed following the same procedures as described15. Liposomes were thawed and sonicated in a bath sonicator for 40 seconds before the assay. To remove extra-liposomal salt (NaCl or KCl), 100 μL samples were passed through a pre-spun Sephadex G-50 fine gel filtration column (1.5 ml bed volume in a 5 ml disposable spin column) swollen in 400 mM Sorbitol, 10 mM HEPES buffered with 4 mM NMDG, pH 7.4. 160 μL of liposome samples collected after this buffer exchange step were added to 320 μL 86Rb flux buffer (400 mM Sorbitol, 10 mM HEPES buffered with 4 mM NMDG, pH 7.4, 50 μM NaCl or KCl, and 5 μM 86RbCl). At desired time points, 60 μL of this reaction mixture were passed through a pre-spun Sephadex G-50 fine gel filtration column as described above to remove extra-liposomal 86Rb and stop the flux. The eluate was mixed with 10 mL scintillation cocktail and its radioactivity was measured in a scintillation counter. For time dependent measurement of 86Rb influx, the radioactivity of each sample was normalized against the maximum 86Rb influx. The maximum 86Rb influx for K+-loaded liposomes was obtained by adding 1 μg/mL of valinomycin to a 60 μL reaction mixture and allowing the influx to proceed for 2 minutes before sample collection using Sephadex G-50 column. 10 μg/mL of gramicidin A was used to obtain the maximum 86Rb influx for Na+-loaded liposomes. For competition assay, CmTMEM175-containing liposomes were loaded with KCl and flux was allowed to proceed for 30 minutes before the radioactivity levels in liposomes were measured. The tested ions (Na+, K+, Rb+, Cs+ or NMDG+) were added directly into the flux buffer, making the final concentrations of 0.1, 0.5 or 1.0 mM after mixing with liposomes, and samples of reaction mixture were collected 30 minutes after the reaction. The radioactivity of each sample in the competition assay was normalized to the reaction mixture without competition ions.
Chemical cross-linking
Cross-linking experiment were performed using amine-reactive cross-linking reagents disuccinimidyl suberate (DSS) and disuccinimidyl glutarate (DSG, ProteoChem) on bacTMEM175s from Chryseobacterium sp and Streptomyces collinus following the manufacturer suggested protocol. Both reagents were prepared as a 50 mM stock in anhydrous dimethylsulfoxide (DMSO). The protein samples used for the cross-linking reactions had a concentration of about 1 mg/mL and were purified in amine-free solution of 20 mM HEPES, pH 7.4, 200 mM KCl and 3 mM DM. The reactions were initiated by adding 2 mM (final concentration) cross-linking reagents to the protein samples and allowed to proceed at room temperature for 5 or 45 minutes. The reactions were quenched by adding Tris, pH 7.4 to a final concentration of 200 mM.
Electrophysiology
Instead of using whole lysosome patch as previously described1, we were able to express human TMEM175 in HEK293 cells and measure plasma membrane channel activity using whole-cell patch clamping. Human TMEM175 and its mutants were cloned into pCGFP-EU plasmid42. 1-2 μg of the plasmid containing the C-terminal GFP-tagged Human TMEM175 or its mutant was transfected into HEK293 cells grown in a six-well tissue culture dish using Lipofectamine 2000 (Life Technology). 24-48 hours after transfection, cells were dissociated by trypsin treatment and kept in complete serum-containing medium and re-plate on 35 mm tissue culture dishes in tissue culture incubator until recording. In most recordings, patch clamp in the whole-cell configuration was employed to measure TMEM175 current in HEK293 cells. Patch clamp in the inside-out configuration was used to measure the Zn2+ and 4-AP block of TMEM175 from the intracellular side. The standard extracellular solution contained (in mM): 145 sodium methanesulfonate (Na-MS), 5 NaCl, 1 MgCl2, 1 CaCl2, 10 HEPES buffered with Tris, pH 7.4. The intracellular solution contained (in mM): 150 Cs-MS, 5 MgCl2, 10 EGTA, 10 HEPES buffered with Tris, pH=7.4. The patch pipettes were pulled from Borosilicate glass (Harvard Apparatus) and heat polished to resistance of 3-5 MΩ. Data was acquired using an AxoPatch 200B amplifier (Molecular Devices) and a low-pass analogue filter set to 1 kHz. The current signal was sampled at a rate of 20 kHz using a Digidata 1322A digitizer (Molecular Devices) and further analyzed with pClamp 9 software (Molecular Devices). After the patch pipette attached the cell membrane, the giga seal (5-10 GΩ) was formed by gentle suction. The whole cell configuration was formed by short zap or suction to rupture the patch. The holding potential was set to 0 mV. All I-V curves of TMEM175 and its mutants were obtained using voltage pulses ramp from -100 to +100 mV over 800 ms duration. To measure the ion selectivity, the extracellular solution (bath) was changed to (in mM): 150 XMS (X = Li, K, Rb, or NMDG), 1 MgCl2, 1 CaCl2, 10 HEPES buffered with Tris, pH 7.4. All data points are mean ± SEM (n ≥5).
The ion permeability ratios were calculated with the following equation:
where Erev is the reversal potential, F is Faraday’s constant, R is the gas constant, and T is the absolute temperature.
Data availability
The atomic coordinates and structure factors have been deposited in the Protein Data Bank under accession number 5VRE.
Extended Data
Extended Data Figure 1. Sequence comparison between prokaryotic and eukaryotic TMEM175s.

a, Topologies of prokaryotic (left) and eukaryotic (right) TMEM175s. b, Sequence alignment of prokaryotic TMEM175s and the first 6-TM domains of eukaryotic TMEM175s. c, Sequence alignment of prokaryotic TMEM175s and the second 6-TM domains of eukaryotic TMEM175s. Secondary structure assignments are based on the CmTMEM175 structure. Asterisks mark the three hydrophobic filter residues. Blue triangles mark the RxxxFSD motif and the residues participating in the inter- and intra-subunit interactions with the motif.
Extended Data Figure 2. Biochemical analysis of bacterial TMEM175s.

a, Gel filtration profiles of three purified bacTMEM175s on Superdex-200 (10/30 GL column) in 20 mM HEPES, pH 7.4, 200 mM KCl and 3 mM n-decyl-β-D-maltopyranoside. All purified bacTMEM175s eluted as a monodispersed peak at a position much larger than a monomer, indicating oligomerization. Arrows indicate the elution peaks of three standard proteins (29, 66 and 200KDa) on the same column. b, Cross-linking reaction of purified bacTMEM175s from Streptomyces collinus (left gel) and Chryseobacterium sp (right gel) with the cross-linking reagents disuccinimidyl suberate (DSS) and disuccinimidyl glutarate (DSG). Samples are analyzed by SDS-PAGE and detected by coomassie blue staining. The purified protein migrates as multiple bands on SDS-PAGE corresponding to the sizes of monomer to tetramer. Cross-linking reaction promotes the formation of crosslinked tetramer, demonstrating that these bacterial channels form tetramers in solution. For gel source data, see Supplementary Figure 1.
Extended Data Figure 3. Electron density maps of CmTMEM175.

a, 2Fo-Fc electron density map of one subunit (contoured at 1.5 σ). b, 2Fo-Fc electron density map of the filter region (contoured at 1.5 σ). The front and back subunits have been removed for clarity. The side chains of the three layers of hydrophobic residues are coloured in magenta.
Extended Data Figure 4.

Structural comparison between a, CmTMEM175 and b, Shaker-like K+ channel (Kv1.2-2.1 chimera, PDB code: 2R9R). Each subunit is individually colored. Both structures are viewed from the extracellular side.
Extended Data Figure 5.

Structural comparison of the ion conduction pathways (shaded grey) from a, CmTMEM175, b, chicken bestrophin-1 (PDB code: 4RDQ), and c, bacterial bestrophin from Klebsiella pneumoniae (KpBest, PDB code: 4WD8). Insets show zoomed-in views of the narrow filters.
Extended Data Figure 6. Ion selectivity of human TMEM175 and its pharmacological properties.

a, Partial sequence alignment of TM1s from hTMEM175 and CmTMEM175; the three layers of hydrophobic residues are boxed and RxxxFSD motif shaded red. b, I-V curve from a control cell. The pipette and bath solutions contain 150 mM Cs+ and 150 mM Na+, respectively. c, Extracellular Zn2+ and 4-aminopyridine (4-AP) block of human TMEM175. Currents were recorded using whole-cell patches with 150 mM of extracellular Na+ (bath) and 150 mM of intracellular Cs+ (pipette). d, Intracellular Zn2+ and 4-AP block of human TMEM175. Currents were recorded using inside-out patches with 150 mM of intracellular Na+ (bath) and 150 mM of extracellular Cs+ (pipette). Recordings shown in c and d indicate that human TMEM175 is sensitive to Zn2+ or 4-AP block from both sides. e, I-V curves of wild type human TMEM175. Currents were recorded using whole-cell patches in bi-ionic conditions. The pipette solution contains 150 mM Cs+ and the bath solution contains 150 mM X+ (X=NMDG, Li, Na, K, and Rb). f, I-V curves of I46N/I271N (at layer 1) double mutant of human TMEM175 in bi-ionic conditions. Currents were recorded using the same conditions as e. g, Summary of reversal potentials of hTMEM175 and its mutants and the calculated relative permeability between Cs+ and K+ or Na+; shown are mean ± SEM of ≥5 measurements. h, Summary of reversal potentials of human TMEM175 and I46N/I271N mutant with various monovalent cations in the bath solutions and the calculated relative permeability of these ions in comparison to Cs+.
Extended Data Table 1.
Data collection and structure refinement statistics.
| Dataset | Native | Hg derivative |
|---|---|---|
| Data collection | ||
| Space group | C2 | C2 |
| Cell dimensions | ||
| a, b, c (Å) | 152.66, 108.88, 119.33 | 150.80, 107.85, 118.14 |
| α, β, γ, (°) | 90, 117.24, 90 | 90, 116.72, 90 |
| Wavelength (Å) | 1.0332 | 1.0064 |
| Resolution (Å) | 50.00–3.30 (3.36–3.30)a | 50.00–3.50 (3.36–3.50) |
| Rmerge | 0.087 (1.596) | 0.071 (1.503) |
| CC1/2 | (0.581) | (0.633) |
| 1/σ | 30.5 (1.4) | 26.0 (1.0) |
| Completeness (%) | 99.0 (98.4) | 95.5 (95.4) |
| Redundancy | 3.6 (3.4) | 7.2 (6.0) |
| Refinement | ||
| Resolution (Å) | 3.7 * 3.6 * 3.3b | |
| No. of reflections | 21668 | |
| Rwork/Rfreec | 0.2594/0.2818 | |
| No. atoms | ||
| Protein | 5972 | |
| B-factors | ||
| Protein | 106.59 | |
| R.m.s deviations | ||
| Bond lengths (Å) | 0.011 | |
| Bond angles (°) | 1.280 |
The number in the parentheses shows the value in the highest resolution shell.
The data was elliptically truncated to 1/3.7 Å−1, 1/3.6 Å−1 and 1/3.3 Å−1 along a*, b* and c* directions, respectively.
Rfree was calculated with 5% of reflection data.
Supplementary Material
Acknowledgments
We thank N. Nguyen for manuscript preparation. The experimental results reported in this article derive from work performed at Argonne National Laboratory, Structural Biology Center (19ID) and GM/CA (23ID) at the Advanced Photon Source, and from work performed at the Berkeley Center for Structural Biology at the Advanced Light Source (ALS). Argonne is operated by UChicago Argonne, LLC, for the U.S. Department of Energy, Office of Biological and Environmental Research under contract DE-AC02-06CH11357. The Berkeley Center for Structural Biology is supported in part by the National Institutes of Health, National Institute of General Medical Sciences, and the Howard Hughes Medical Institute. The Advanced Light Source is supported by the Director, Office of Science, Office of Basic Energy Sciences, of the U.S. Department of Energy under Contract No. DE-AC02-05CH11231. This work was supported in part by the Howard Hughes Medical Institute and by grants from the National Institute of Health (GM079179 to Y. J.; NS055293 and NS074257 to D.R.) and the Welch Foundation (Grant I-1578 to Y. J.).
Footnotes
The authors declare no competing financial interests.
Author Contributions C.L. and J.G. performed the structure determination; W.Z., C.C. and D.R. performed electrophysiology; S.K and J.S. participated in sample preparation; C.L., J.G., W.Z. and Y.J. designed the research, analyzed data, and prepared the manuscript.
References
- 1.Cang C, Aranda K, Seo YJ, Gasnier B, Ren D. TMEM175 Is an Organelle K+ Channel Regulating Lysosomal Function. Cell. 2015;162:1101–1112. doi: 10.1016/j.cell.2015.08.002. [DOI] [PubMed] [Google Scholar]
- 2.Papazian DM, Schwarz TL, Tempel BL, Jan YN, Jan LY. Cloning of genomic and complementary DNA from Shaker, a putative potassium channel gene from Drosophila. Science. 1987;237:749–753. doi: 10.1126/science.2441470. [DOI] [PubMed] [Google Scholar]
- 3.Heginbotham L, Lu Z, Abramson T, MacKinnon R. Mutations in the K+ channel signature sequence. Biophys J. 1994;66:1061–1067. doi: 10.1016/S0006-3495(94)80887-2. [DOI] [PMC free article] [PubMed] [Google Scholar]
- 4.Zhou Y, Morais-Cabral JH, Kaufman A, MacKinnon R. Chemistry of ion coordination and hydration revealed by a K+ channel-Fab complex at 2.0 A resolution. Nature. 2001;414:43–48. doi: 10.1038/35102009. [DOI] [PubMed] [Google Scholar]
- 5.Xu H, Ren D. Lysosomal physiology. Annu Rev Physiol. 2015;77:57–80. doi: 10.1146/annurev-physiol-021014-071649. [DOI] [PMC free article] [PubMed] [Google Scholar]
- 6.Luzio JP, Pryor PR, Bright NA. Lysosomes: fusion and function. Nat Rev Mol Cell Biol. 2007;8:622–632. doi: 10.1038/nrm2217. [DOI] [PubMed] [Google Scholar]
- 7.Kolter T, Sandhoff K. Principles of lysosomal membrane digestion: stimulation of sphingolipid degradation by sphingolipid activator proteins and anionic lysosomal lipids. Annu Rev Cell Dev Biol. 2005;21:81–103. doi: 10.1146/annurev.cellbio.21.122303.120013. [DOI] [PubMed] [Google Scholar]
- 8.Vitner EB, Platt FM, Futerman AH. Common and uncommon pathogenic cascades in lysosomal storage diseases. J Biol Chem. 2010;285:20423–20427. doi: 10.1074/jbc.R110.134452. [DOI] [PMC free article] [PubMed] [Google Scholar]
- 9.Schulze H, Sandhoff K. Lysosomal lipid storage diseases. Cold Spring Harbor perspectives in biology. 2011;3 doi: 10.1101/cshperspect.a004804. [DOI] [PMC free article] [PubMed] [Google Scholar]
- 10.Parkinson-Lawrence EJ, et al. Lysosomal storage disease: revealing lysosomal function and physiology. Physiology (Bethesda) 2010;25:102–115. doi: 10.1152/physiol.00041.2009. [DOI] [PubMed] [Google Scholar]
- 11.Mindell JA. Lysosomal acidification mechanisms. Annu Rev Physiol. 2012;74:69–86. doi: 10.1146/annurev-physiol-012110-142317. [DOI] [PubMed] [Google Scholar]
- 12.Xiong J, Zhu MX. Regulation of lysosomal ion homeostasis by channels and transporters. Science China Life sciences. 2016;59:777–791. doi: 10.1007/s11427-016-5090-x. [DOI] [PMC free article] [PubMed] [Google Scholar]
- 13.Jinn S, et al. TMEM175 deficiency impairs lysosomal and mitochondrial function and increases alpha-synuclein aggregation. Proc Natl Acad Sci U S A. 2017;114:2389–2394. doi: 10.1073/pnas.1616332114. [DOI] [PMC free article] [PubMed] [Google Scholar]
- 14.Nalls MA, et al. Large-scale meta-analysis of genome-wide association data identifies six new risk loci for Parkinson’s disease. Nat Genet. 2014;46:989–993. doi: 10.1038/ng.3043. [DOI] [PMC free article] [PubMed] [Google Scholar]
- 15.Heginbotham L, Kolmakova-Partensky L, Miller C. Functional reconstitution of a prokaryotic K+ channel. J Gen Physiol. 1998;111:741–749. doi: 10.1085/jgp.111.6.741. [DOI] [PMC free article] [PubMed] [Google Scholar]
- 16.Long SB, Campbell EB, Mackinnon R. Crystal structure of a mammalian voltage-dependent Shaker family K+ channel. Science. 2005;309:897–903. doi: 10.1126/science.1116269. [DOI] [PubMed] [Google Scholar]
- 17.Long SB, Tao X, Campbell EB, MacKinnon R. Atomic structure of a voltage-dependent K+ channel in a lipid membrane-like environment. Nature. 2007;450:376–382. doi: 10.1038/nature06265. [DOI] [PubMed] [Google Scholar]
- 18.Holm L, Rosenstrom P. Dali server: conservation mapping in 3D. Nucleic Acids Res. 2010;38:W545–549. doi: 10.1093/nar/gkq366. [DOI] [PMC free article] [PubMed] [Google Scholar]
- 19.Doyle DA, et al. The structure of the potassium channel: molecular basis of K+ conduction and selectivity. Science. 1998;280:69–77. doi: 10.1126/science.280.5360.69. [DOI] [PubMed] [Google Scholar]
- 20.Shi N, Ye S, Alam A, Chen L, Jiang Y. Atomic structure of a Na+- and K+-conducting channel. Nature. 2006;440:570–574. doi: 10.1038/nature04508. [DOI] [PubMed] [Google Scholar]
- 21.Aryal P, Sansom MS, Tucker SJ. Hydrophobic gating ion channels. J Mol Biol. 2015;427:121–130. doi: 10.1016/j.jmb.2014.07.030. [DOI] [PMC free article] [PubMed] [Google Scholar]
- 22.Yang T, et al. Structure and selectivity in bestrophin ion channels. Science. 2014;346:355–359. doi: 10.1126/science.1259723. [DOI] [PMC free article] [PubMed] [Google Scholar]
- 23.Kane Dickson V, Pedi L, Long SB. Structure and insights into the function of a Ca2+-activated Cl− channel. Nature. 2014;516:213–218. doi: 10.1038/nature13913. [DOI] [PMC free article] [PubMed] [Google Scholar]
- 24.Hartzell HC, Qu Z, Yu K, Xiao Q, Chien LT. Molecular physiology of bestrophins: multifunctional membrane proteins linked to best disease and other retinopathies. Physiol Rev. 2008;88:639–672. doi: 10.1152/physrev.00022.2007. [DOI] [PubMed] [Google Scholar]
- 25.Vaisey G, Miller AN, Long SB. Distinct regions that control ion selectivity and calcium-dependent activation in the bestrophin ion channel. Proc Natl Acad Sci U S A. 2016;113:E7399–E7408. doi: 10.1073/pnas.1614688113. [DOI] [PMC free article] [PubMed] [Google Scholar]
- 26.Li H, Francisco JS, Zeng XC. Unraveling the mechanism of selective ion transport in hydrophobic subnanometer channels. Proc Natl Acad Sci U S A. 2015;112:10851–10856. doi: 10.1073/pnas.1513718112. [DOI] [PMC free article] [PubMed] [Google Scholar]
- 27.Zhou X, et al. Self-assembling subnanometer pores with unusual mass-transport properties. Nat Commun. 2012;3:949. doi: 10.1038/ncomms1949. [DOI] [PubMed] [Google Scholar]
- 28.Carrillo-Tripp M, Saint-Martin H, Ortega-Blake I. Minimalist molecular model for nanopore selectivity. Physical review letters. 2004;93:168104. doi: 10.1103/PhysRevLett.93.168104. [DOI] [PubMed] [Google Scholar]
- 29.Shao Q, et al. Anomalous hydration shell order of Na+ and K+ inside carbon nanotubes. Nano Lett. 2009;9:989–994. doi: 10.1021/nl803044k. [DOI] [PubMed] [Google Scholar]
- 30.Otwinowski Z, Minor W. Processing of X-ray Diffraction Data Collected in Oscillation Mode. Methods Enzymol. 1997;276:307–326. doi: 10.1016/S0076-6879(97)76066-X. Macromolecular Crystallography, part A. [DOI] [PubMed] [Google Scholar]
- 31.Strong M, et al. Toward the structural genomics of complexes: crystal structure of a PE/PPE protein complex from Mycobacterium tuberculosis. Proc Natl Acad Sci U S A. 2006;103:8060–8065. doi: 10.1073/pnas.0602606103. [DOI] [PMC free article] [PubMed] [Google Scholar]
- 32.Schneider TR, Sheldrick GM. Substructure solution with SHELXD. Acta Crystallogr D Biol Crystallogr. 2002;58:1772–1779. doi: 10.1107/s0907444902011678. [DOI] [PubMed] [Google Scholar]
- 33.Vonrhein C, Blanc E, Roversi P, Bricogne G. Automated structure solution with autoSHARP. Methods Mol Biol. 2007;364:215–230. doi: 10.1385/1-59745-266-1:215. [DOI] [PubMed] [Google Scholar]
- 34.Abrahams JP, Leslie AGW. Methods used in the structure determination of bovine mitochondrial F1_ATPase. Acta Crystallogr D Biol Crystallogr. 1996;52:30–42. doi: 10.1107/S0907444995008754. [DOI] [PubMed] [Google Scholar]
- 35.Terwilliger T. SOLVE and RESOLVE: automated structure solution, density modification and model building. Journal of synchrotron radiation. 2004;11:49–52. doi: 10.1107/s0909049503023938. [DOI] [PubMed] [Google Scholar]
- 36.Emsley P, Lohkamp B, Scott WG, Cowtan K. Features and development of Coot. Acta Crystallogr D Biol Crystallogr. 2010;66:486–501. doi: 10.1107/S0907444910007493. [DOI] [PMC free article] [PubMed] [Google Scholar]
- 37.Adams PD, et al. PHENIX: a comprehensive Python-based system for macromolecular structure solution. Acta Crystallogr D Biol Crystallogr. 2010;66:213–221. doi: 10.1107/S0907444909052925. [DOI] [PMC free article] [PubMed] [Google Scholar]
- 38.Laskowski RA, MacArthur MW, Moss DS, Thornton JM. PROCHECK: a program to check the stereochemical quality of protein structures. J Appl Cryst. 1993;26:283–291. [Google Scholar]
- 39.Smart OS, Goodfellow JM, Wallace BA. The pore dimensions of gramicidin A. Biophysical journal. 1993;65:2455–2460. doi: 10.1016/S0006-3495(93)81293-1. [DOI] [PMC free article] [PubMed] [Google Scholar]
- 40.Baker NA, Sept D, Joseph S, Holst MJ, McCammon JA. Electrostatics of nanosystems: application to microtubules and the ribosome. Proc Natl Acad Sci U S A. 2001;98:10037–10041. doi: 10.1073/pnas.181342398. [DOI] [PMC free article] [PubMed] [Google Scholar]
- 41.The PyMOL Molecular Graphics System, Version 1.7.4. Schrödinger, LLC; [Google Scholar]
- 42.Kawate T, Gouaux E. Fluorescence-detection size-exclusion chromatography for precrystallization screening of integral membrane proteins. Structure. 2006;14:673–681. doi: 10.1016/j.str.2006.01.013. [DOI] [PubMed] [Google Scholar]
Associated Data
This section collects any data citations, data availability statements, or supplementary materials included in this article.
Supplementary Materials
Data Availability Statement
The atomic coordinates and structure factors have been deposited in the Protein Data Bank under accession number 5VRE.