

Abstract
Purpose
Although the prevalence of alcohol consumption is higher in HIV+ people than general public, limited information is available on how alcohol affects the metabolism and bioavailability of darunavir (DRV).
Methods
DRV was quantified by using LC-MS/MS method. All in vitro experiments were performed using human liver microsomes and HIV-infected monocytic cells. CYP3A4 and DRV/ Ritonavir (RTV) docking was performed using GOLD suite 5.8.
Results
Ethanol (20 mM) significantly decreased apparent half-life and increased degradation rate constant of RTV-boosted DRV but not for DRV alone. Similarly, ethanol exposure increased hepatic intrinsic clearance for RTV-boosted DRV with no significant influence on DRV alone. Ethanol showed a limited influence on intracellular total DRV exposure in the presence of RTV without altering maximum concentration (Cmax) values in HIV-infected monocytic cells. Ethanol alone elevated HIV replication but this effect was nullified with the addition of DRV or DRV + RTV. Additionally, inhibitory potency of DRV was significantly reduced in the presence of ethanol. Our docking results projected that ethanol increases the average distance between DRV and CYP3A4 heme, and alter the orientation of DRV-CYP3A4 binding.
Conclusions
Collectively these findings suggest that DRV metabolism is primarily influenced by ethanol in the liver, but has minor effect in HIV-residing monocytes.
Keywords: antiretroviral therapy, cytochrome P450, drug-drug interaction, ethanol, HIV
INTRODUCTION
Darunavir (DRV) is a second-generation HIV protease inhibitor (PI) that is used to treat HIV infection (1). It is usually part of combination antiretroviral therapy (ART) to control HIV virus. Currently DRV is available in the market under the trade names Prezista® and Prezcobix®. United States Department of Health and Human Services guidelines recommend DRV for both treatment-naïve adults as well as for HIV-positive individuals who do not respond to other or older PIs. DRV is extensively metabolized by the cytochrome P450 3A4 (CYP3A4) enzyme and therefore it is usually prescribed along with a pharmacokinetic enhancer (2). Ritonavir (RTV; Norvir®), a PI and a strong CYP3A4 inhibitor has long been used as pharmacoenhancer of DRV. Recently a non-PI CYP3A4 inhibitor cobicistat and DRV combination tablet (Prezcobix®) has been approved by the FDA to treat HIV along with other ART medication.
CYP3A4 is responsible for the metabolism of ~45% of ingested drugs, including ART and other medications that are being used to treat AIDS related complications, as well as drugs of abuse (3). This increases the potential for drug-drug interactions (DDI), which can alter the action of drug and cause drug-induced toxicity. DDI are a major concern, especially when using combination therapies or while treating comorbid complications – the most frequent situations in HIV care (4,5). Ethanol consumption is very common in HIV positive persons and there are no separate guidelines for dosing adjustments to treat HIV positive ethanol users (6). Experimental and observational studies strongly associate alcohol use with increased disease progression and decreased adherence to therapy (7,8). We have previously reported that ethanol induces CYP3A4 expression and alters the interaction of different PIs with CYP3A4 (9,10). In addition, a recent in vitro study revealed that ethanol and DRV/RTV regimen alone, as well as in combination alter the expression level of CYP and antioxidant proteins, which is associated with increased oxidative stress and cytotoxicity in monocytic cells (11).
The intent of the current study is to evaluate the effect of ethanol on kinetic and inhibitory characteristics of DRV in the presence and absence of its booster drug RTV. To this end, we utilized both experimental approach using a newly developed simple, sensitive, and robust liquid chromatography tandem mass-spectrometry (LC-MS/MS) method in microsomes and HIV-infected monocytic cells and molecular modeling approach using ligand docking. We report herein that ethanol modifies CYP3A4-DRV binding characteristics leading to altered DRV metabolism in the liver, but shows minor effect on DRV metabolism in the monocytic cells.
MATERIALS AND METHODS
Chemicals and Reagents
DRV, RTV, and Elvitegravir (EVG) were obtained from Toronto Research Chemicals Inc. (Ontario, Canada). Solvents acetonitrile, methanol, and formic acid were purchased from Sigma-Aldrich (Milwaukee, WI). Pooled human liver microsomes (# HMMC-PL) were purchased from Invitrogen (Carlsbad, CA). HIV-infected (U1) cell line was obtained from NIH AIDS Reagent program (Germantown, MD). Vivid® CYP450 Blue Screening Kit was procured from Life Technologies (Carlsbad, CA).
Drug Quantification Using LC-MS/MS
DRV and internal standard (IS) EVG were quantified using a tandem mass spectrometer (Triple Quad 5500 from AB SCIEX, Framingham, MA) that was equipped with electron spray ionization in positive mode. The optimized mass and chromatographic parameters were listed in Table I. Calibration standards and method validation performed as reported previously (12) and by following FDA bioanalytical method validation guidelines.
Table I.
Bioanalytical Method Summary for the Analyte DRV and the Internal Standard EVG
| Optimized mass parameters
| |||
|---|---|---|---|
| Analyte | Transitions (m/z) | CE (eV) | CXP (eV) |
| Darunavir (DRV) | 547.7/392 | 20 | 30 |
| Elvitegravir (EVG) | 447.9/343.8 | 43 | 20 |
| Other parameters: DP: 100, EP: 10, CUR: 20, CAD: 8, IS: 5500, GS1: 50, GS2: 50, Temp: 500 | |||
| Liquid chromatography conditions | |||
| HPLC Column: Waters Xterra® MS C18 Column, 125 Å, 3.5 μm,4.6 mm × 50 mm | |||
| Mobile Phase: acetonitrile and water with 0.1% formic acid Injection volume: 6 μl | |||
| Total flow: 1 ml/min | |||
| Gradient Time | Organic solvent (%) | ||
| 0.10 | 30 | ||
| 1.00 | 50 | ||
| 1.50 | 60 | ||
| 5.00 | 60 | ||
| 5.10 | 30 | ||
Time-Dependent Kinetics of DRV Metabolism
Degradation kinetics of DRV was determined in human liver microsomes (HLM). The pre-incubation mixture contained 0.1 mg/ml HLM protein, 500 ng/ml DRV, 150 ng/ml RTV, 20 mM ethanol in 0.1 M potassium phosphate buffer with 10 mM MgCl2. The specified concentrations of DRV, RTV, and ethanol represent the therapeutic or blood alcohol concentrations in patients. After 10 min pre-incubation at 37°C, the metabolic reaction was initiated by adding 10 mM final concentration of NADPH. Reaction was terminated at indicated time intervals by adding sample to cold acetonitrile containing 10 ng/ml internal standard (IS) EVG.
Cell Culture, Drug Treatment and p24 ELISA
U1 cells were cultured and differentiated as described previously (13). Cells were treated with 3 μg/ml of DRV (Cmax of oral 400 mg QD), 1 μg/ml of RTV (Cmax value of oral 100 mg QD), and 20 mM ethanol (~0.08% blood alcohol content (BAC) for mild-to-moderate drinking). Cells were also treated with 10 mM (BAC for social drinking) and 50 mM (BAC for binge drinking). Both media and cell samples were collected at 0.5, 1, 3, 6, 12, and 24 h time intervals. Collected cell lysates were processed to measure DRV concentration and 24 h cell culture media samples were assessed for HIV p24 production by using an ELISA kit (ZeptoMetrix Corp, Buffalo, NY).
Vivid® CYP3A4 Inhibition Assay
CYP3A4 inhibition by DRV in the presence and absence of ethanol and RTV was determined using the CYP3A4 Blue screening kit. This is a high-throughput fluorescence-based assay that uses CYP3A4 baculosomes and proprietary substrate that gives fluorescent product to detect CYP3A4 inhibition. The assay was performed by following manufacturer instructions. Varying concentrations of DRV (0.055, 0.0274, 0.548, 1.37, 2.74, 5.48, 10.95 and 21.91 μg/ml) were used. RTV concentrations were adjusted accordingly to achieve a 1:3 ratio. Ethanol concentrations were kept at 20 mM in all treatment paradigms to mimic blood alcohol concentration (~0.08%). The data were expressed as a percentage of control fluorescence level.
Computational Modeling of DRV Interaction with CYP3A4
Docking was essentially performed as described in our earlier publications (14). Briefly, the initial CYP3A4 model for docking was taken from Protein Data Bank (PDB). The coordinates of RTV and DRV were extracted from PDB. The ethanol was built in Maestro 11 software. All ligands were optimized by the Epik module in Schrödinger, LLC, New York, NY (15). All docking simulations were performed by GOLD suite 5.8 (Glide, version 5.8, Schrödinger, LLC, NY). Amino acid residues within 20 Å of the DRV molecule were defined as the binding pocket. Chemscore was used for scoring the DRV-CYP3A4 interactions. Number of output keys was established to 100 for each run and first 10 outcomes were investigated.
Data Analyses
Estimates of apparent half-life and rate constants were obtained by fitting the time-dependent data to one-phase exponential decay equation. Intrinsic hepatic clearance (CLint) was calculated by using 0.693/app t1/2 formula. Dose-response curves were used to determine the IC50 values from the CYP3A4 inhibition experiments. The concentration-time data was fit to non-compartmental analysis in Phoenix WinNonln32 (Certara L.P., Princeton, NJ) to compute the area under the concentration-time curve (AUC) and maximum concentration (Cmax) parameters. All the graphs and statistical analyses were performed using GraphPad Prism 6 (GraphPad, San Diego, CA). The statistical significance among treatments were determined using either one-way ANOVA with Bonferroni multiple post hoc comparisons or student t test wherever appropriate. A ‘p’ value <0.05 was considered significant. Reported numbers denote mean values with standard error of mean.
RESULTS
Method Development
We previously developed and validated a LC-MS/MS method for the estimation of antiretroviral drugs such as nelfinavir, ritonavir, and elvitegravir from monocytic cell extracts (9,12). In view of current study we developed a simple and sensitive LC-MS/MS method for simultaneous estimation of DRV and EVG in human liver microsomes. Initial mass parameters were optimized manually by adjusting each parameter and the obtained parameters were verified using automated optimization mode in the Analyst® software (Fig. 1 and Table I). No significant interference from the microsomal blank samples was detected. The linear calibration curves were achieved over the range of 10–1500 ng/ml with a weighting factor 1/x2 and correlation coefficient (r2) 0.998. The lower limit of quantitation (LLOQ) was 10 ng/ml. The observed retention times for DRV and EVG were 2.18 and 3.37 min, respectively. Use of such a relatively simple protein precipitation extraction procedure and shorter run times in this study makes this method suitable for processing large number of samples with high quality. Precision and accuracy and drug stability at the working temperature and during freeze-thaw cycles were within acceptable limits as per FDA bioanalytical method validation guidelines.
Fig. 1.
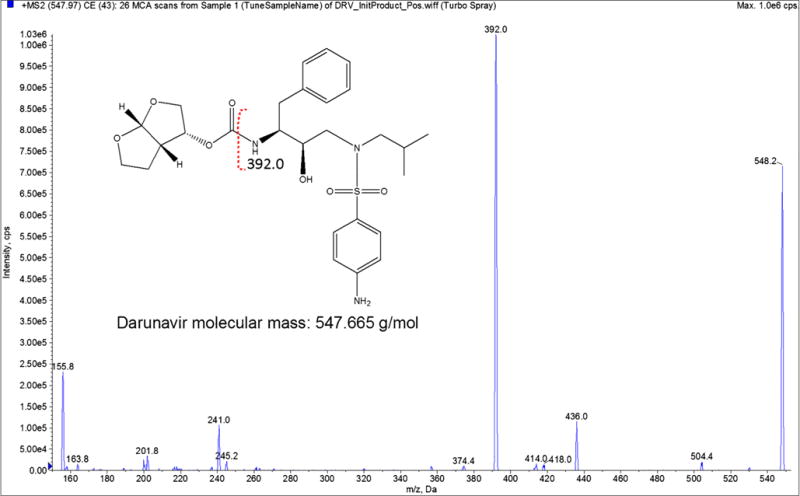
Electron ionization MS/MS spectrum of Darunavir (DRV). The y-axis shows the intensity (CPS, count per second); the x-axis shows the mass to charge ratio (m/z, Da). The EVG structure was made using ChemDraw. Red dotted annotation on the structure shows the fragmentation spectra for DRV.
Ethanol Influence on DRV Degradation Kinetics
DRV is a recommended treatment choice for treatment-naïve and treatment-experienced adults and adolescents. DRV undergoes oxidative metabolism through the liver CYP3A4 enzyme (2) and the bioavailability of the DRV is increased with co-administration of strong CYP3A4 inhibitor such as RTV (16). In this study, upon the development of LC-MS/ MS method to measure DRV concentration, human liver microsomes were treated with DRV alone and in combination with RTV and/or ethanol. As expected RTV has increased the app t1/2 and decreased rate constant, K values for the DRV significantly (Fig. 2A, F (3,11) = 82, P = 0.000, one-way ANOVA). Ethanol treatment exhibited a significant decrease in the apparent half-life (t1/2) for DRV + RTV (Fig. 2A, (F(3,11) = 34, P = 0.003, one-way ANOVA) but not for the DRV alone (P = 1). We observed increased trend in K value for DRV + RTV when exposed to ethanol but this increase is not statistically significant (F(3,11) = 88, P = 0.151, one-way ANOVA) when compared to DRV + RTV condition.
Fig. 2.
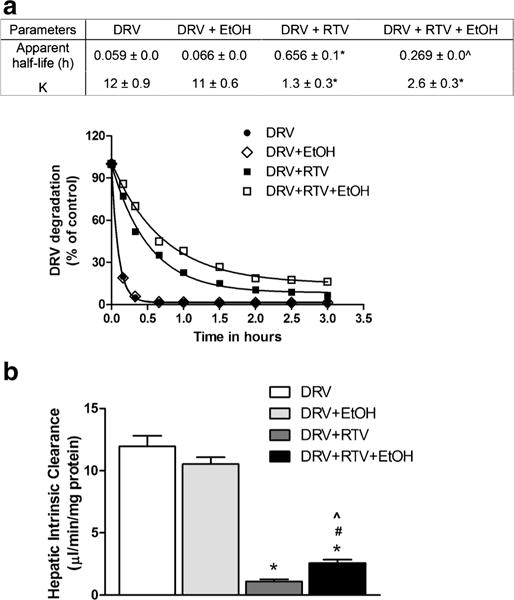
Kinetic characteristics of Darunavir (DRV) with and without ethanol (EtOH). Human liver microsomes were treated with indicated combinations of drugs as described in Materials and methods. (A) DRV degradation, *p < 0.05 compared to DRV, and ˆp < 0.05 compared to DRV + RTV (B) Hepatic intrinsic clearance, *p < 0.05 compared to DRV, #p < 0.05 compared to DRV + EtOH, and ˆp < 0.05 compared to DRV + RTV. Values were means ± SEM from 3 individual experiments.
Hepatic intrinsic clearance, the enzyme-mediated clearance that would occur without physiological limitations such as blood flow is majorly effected by the variations in the CYP enzyme metabolic activity. As the CYP3A 4activity can be altered by the ethanol (17,18), we also analyzed the effect of ethanol on the liver intrinsic clearance. As anticipated, RTV robustly decreased the DRV clearance compared to DRV alone (Fig. 2B, F (3,11) = 91, P < 0.0001, one-way ANOVA). Ethanol exposure showed little or no influence on DRV alone but it significantly increased the clearance values for RTV-boosted DRV (P = 0.0164).
Effect of Ethanol on Intracellular DRV Levels and HIV Replication
One major consideration for the ineffectiveness of ART is the continuous replication of HIV in cellular reservoirs despite achieving undetectable viral RNA levels in the plasma (19). Additionally, we recently reported that ethanol exposure decreases the intracellular EVG AUCtot and Cmax values in the absence of pharmacoenhancer, cobicistat in monocytes (20). Clinically relevant concentration of ethanol (20 mM) exposure to U1 cells resulted in a 11% decrease in AUCtot of DRV compared to DRV alone (t(4) = 4.6, p = 0.0102, student t test, Fig. 3) without altering the Cmax. However, co-exposure of RTV along with ethanol mitigated the impact of ethanol on DRV levels.
Fig. 3.
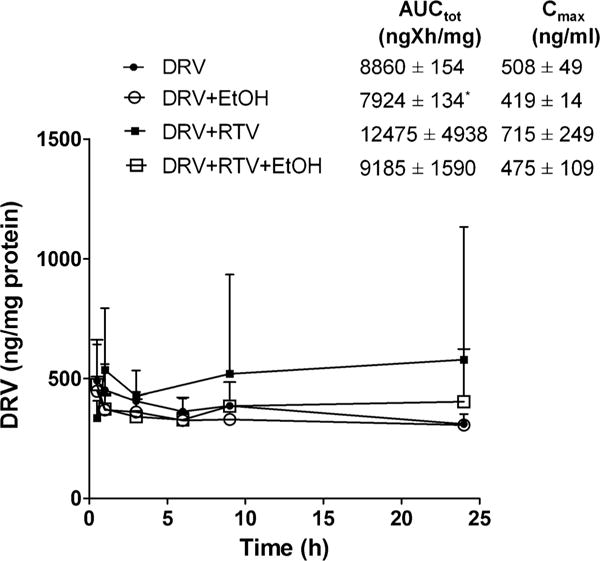
Concentration time profile of Darunavir (DRV) at 20 mM ethanol. *p < 0.05 compared to DRV. Data are expressed as mean ± SEM of intracellular concentrations (ng/mg of protein) from 3 independent experiments. EtOH – Ethanol, RTV – Ritonavir
We measured HIV p24 levels after 24 h of drug treatment to determine the pharmacodynamic effect of ethanol interaction with intracellular DRV. Ethanol (20 mM) treatment alone showed a 20.6% increase in HIV replication compared to control (t(6) = 5.9, p = 0.001, student t test, Fig. 4), which is in line with the previous studies (21,22). Cells that were exposed to DRV alone or along with RTV exhibited approximately a 60% decrease in HIV replication (p = 0.05 compared to control). Furthermore, the ethanol-induced increase in HIV replication was completely abolished when cells were additionally treated with DRV or DRV + RTV (p < 0.05 compared to control or ethanol, student t test). Although there was a slight decrease in total drug exposure when ethanol exposed along with RTV (Fig. 3), which did not translate into an increase in HIV replication.
Fig. 4.
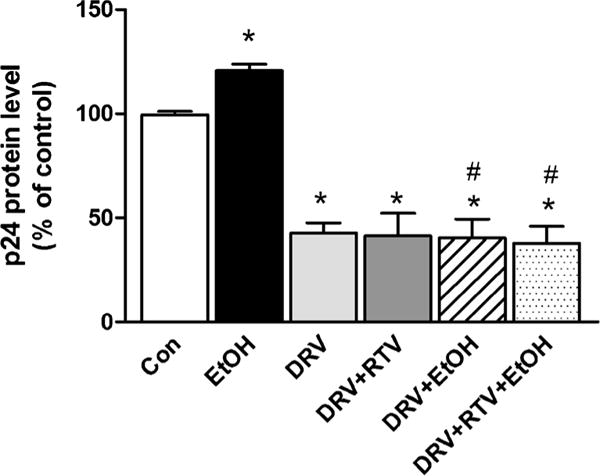
HIV replication after 24 h drug exposure at 20 mM ethanol. HIV p24 levels were measured from culture media using an ELISA kit and reported as percentage of control. Mean ± SEM values were graphed from 3 independent experiments. *indicate p < 0.05 compared to control; #indicate p < 0.05 compared to ethanol alone treatment. DRV – Darunavir, EtOH – Ethanol, RTV – Ritonavir.
We also measured intracellular concentrations of DRV and HIV replication at 10 mM (BAC for social) and 50 mM (BAC for binge drinking) ethanol concentrations. There was no significant change in intracellular DRV AUCtot and Cmax when exposed with both 10 mM and 50 mM ethanol (data not shown). As expected, 10 mM ethanol treatment alone showed an 89% increase in HIV replication compared to control (t(2) = 10.85, p = 0.0084, student t test, Fig. 5). In addition, 50 mM ethanol treatment alone showed a 41% increase in HIV replication compared to control (t(2) = 4.264, p = 0.05, student t test, Fig. 5). Ethanol induced HIV replication in monocytes cells appears to be via CYP2E1-mediated alcohol metabolism and resultant oxidative stress (7,11,23). Similar to 20 mM ethanol concentration, ethanol-induced increase in HIV replication was completely abolished when cells were treated with DRV or DRV + RTV at both 10 mM and 50 mM ethanol concentrations (p < 0.05 compared to control or ethanol, student t test).
Fig. 5.
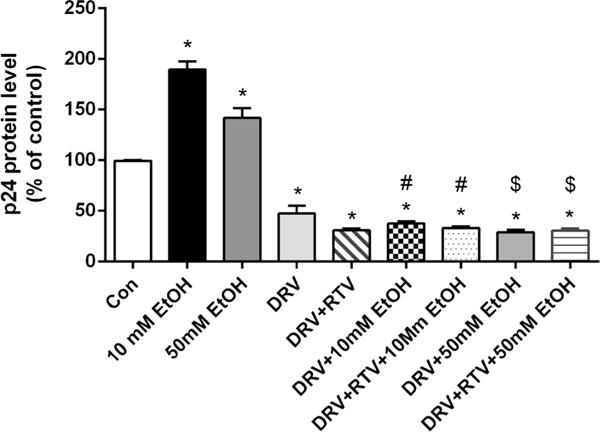
HIV replication after 24 h drug exposure at 10 mM and 50 mM ethanol. HIV p24 levels were measured from culture media using an ELISA kit and reported as percentage of control. Mean ± SEM values were graphed from 2 independent experiments. *indicate p < 0.05 compared to control; #indicate p < 0.05 compared to 10 mM ethanol alone treatment; $indicate p < 0.05 compared to 50 mM ethanol alone treatment. DRV – Darunavir, EtOH – Ethanol, RTV – Ritonavir.
DRV-Mediated Inhibition of CYP3A4 in the Presence and Absence of Ethanol/RTV
The inhibitory effects of DRV on the CYP3A4 enzyme in the presence and absence of both 20 mM ethanol and/or RTV are shown in Fig. 6. Inclusion of either ethanol or RTV and both ethanol + RTV showed a significant decrease in the IC50 values (F(3,11) = 167, P < 0.0001, one-way ANOVA). As anticipated DRV significantly inhibited CYP3A4 (90.91 ng/ml) and addition of RTV further enhanced this inhibitory effect (11.50 ng/ml). These results were in good agreement with the reported inhibitory constant, Ki, values for CYP3A (24). In fact, we observed robust inhibition than reported Ki values, perhaps due to the use of recombinant CYP3A4 enzyme (Vivid® assay) in our experiment. Ethanol exposure to CYP3A4 decreased the IC50 value of DRV by 40% in the absence of RTV. In response to ethanol exposure, DRV + RTV combination treatment exhibited a four-fold decrease in the IC50 value compared to without ethanol (p < 0.05 student t test, Fig. 6).
Fig. 6.
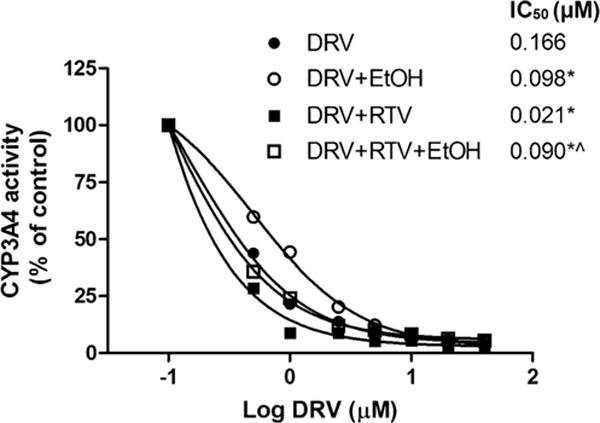
Inhibition of CYP3A4 activity by Darunavir (DRV) and/or Ritonavir (RTV) in the presence and absence of ethanol. Vivid® assay kit was used to determine the inhibitory pattern. *p < 0.05 compared to DRV, ˆp < 0.05 compared to DRV + RTV. Values were means ± SEM from 3 individual experiments. Observed IC50 SEM values are ≤1×10⁻³ and therefore were not included in the figure.
Molecular Docking
To further verify whether ethanol alters DRV/RTV-CYP3A4 interactions, we performed ligand docking studies as described in Materials and Methods. DRV and RTV individually can be docked into the CYP3A4 binding pocket in the absence or presence of ethanol with multiple binding modes and docking scores (Fig. 7 and Table II). Multiple binding modes were observed because of the large flexibility of the two inhibitors. In the absence of ethanol, RTV has 3 binding modes. The major binding mode is that the thiazole ring points to the heme iron. There are only 2 binding modes for DRV where the heterocycle ring pointing to the heme iron is the major binding mode. The major binding modes for these two inhibitors are in agreement with the experimental results that were reported in the previous studies (25).
Fig. 7.
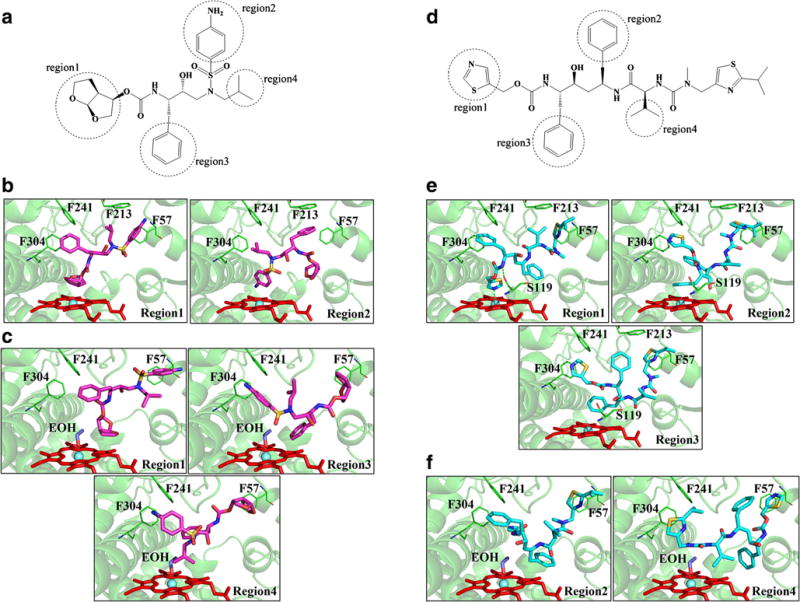
Molecular docking of Darunavir (DRV) and Ritonavir (RTV) with the human CYP3A4. (A) DRV (D) RTV interaction regions obtained through simulations. CYP3A4 binding sites and 3D model of DRV/RTV-CYP3A4 complex in absence (DRV (B), RTV (E)) and presence of ethanol (DRV(C), RTV (F)). All docking simulations were accomplished by GOLD suite 5.8. Residues within 20 Å of the ligand were defined as the binding pocket. Chemscore was used for scoring the ligand-CYP3A4 interactions. The first ten poses of scoring was catalogued as indicated regions in the figure.
Table II.
The Statistical Results of Darunavir (DRV), Ritonavir (RTV) Docked Into the CYP3A4 Active Site in the Absence and Presence of Ethanol (EtOH)
| DRV | Num | Average score | Average distance (A)[a] |
|---|---|---|---|
| Region-1 | 6 | 42.44 | 4.14 |
| Region-2 | 4 | 41.95 | 2.71 |
| DRV + EtOH | |||
| Region-1 | 1 | 36.75 | 5.16 |
| Region-3 | 4 | 36.21 | 5.47 |
| Region-4 | 4 | 36.60 | 4.96 |
| Other | 1 | 36.87 | 6.25 |
| RTV | |||
| Region-1 | 6 | 59.2 | 2.6 |
| Region-2 | 1 | 57.8 | 3.6 |
| Region-3 | 3 | 56.0 | 3.8 |
| RTV + EtOH | |||
| Region-2 | 7 | 50.3 | 5.6 |
| Region-4 | 2 | 53.1 | 5.3 |
| Other | 1 | 52.5 | 5.6 |
In the case of ethanol-CYP3A4 docking, all the outputs share the same binding mode with the oxygen atom bound to the heme iron. With the presence of ethanol in the binding pocket, the numbers of binding modes of RTV and DRV were changed from 3 to 2 modes and 2 to 3 modes, respectively (Fig. 7). Major binding modes of these two inhibitors are different from those in the absence of ethanol, that is, the existence of ethanol changes the orientation of binding of both the inhibitors. With the ethanol in the active site, the docking scores of RTV and DRV decrease by approximately 16% and 12%, respectively, as compared to without ethanol.
DISCUSSION
In the current study, we investigated the consequences of ethanol exposure to the metabolism of DRV and its inhibitory activity of CYP3A4 in the absence and presence of its pharmacoenhancer RTV. Quantitation of DRV was performed by a newly developed LC-MS/MS method. Following the method development, we studied the effect of physiological concentration of ethanol treatment on DRV in the liver microsomes as well as HIV-infected monocytic cells. The experimental findings were further explained by molecular docking of DRV and RTV to the CYP3A4 active site in the presence of ethanol.
Ethanol is known to interact with many medications causing adverse effects by manipulating pharmacokinetic and pharmacodynamic outcomes of the drugs. Although alcohol dehydrogenase and CYP2E1 are the critical players in ethanol metabolism, previous studies suggest that other CYP isoforms including CYP3A4 are also involved in its metabolism (26–28). Additionally, ethanol has been shown to modify the spectral binding of HIV PIs with CYP3A4, based on physicochemical properties of the drugs (9,10). The observed decrease in apparent t1/2 for DRV + RTV in this study upon ethanol exposure is likely because of differential influence of ethanol on spectral binding of DRV and type II spectral binding of RTV with CYP3A4 (10). Furthermore, CYP3A4 exhibits a weaker affinity for ethanol with an apparent Km of 10 mM (27) and carry out a significant ethanol oxidation compared to CYP2E1 (29). Additionally, kinetics of high protein bound drugs such as benzodiazepines are reported to be altered by ethanol (30) and DRV is predominantly (95%) plasma protein-bound state in the circulation. CYP3A4 levels are reported to be significantly upregulated by ethanol in different model systems including microsomes, hepatocytes, and primary cultures (31,32). Therefore, the robust increase in clearance of RTV-boosted DRV by ethanol can be attributed to the altered binding of DRV and RTV to CYP3A4, CYP3A4 induction, and inherent properties of the drugs (33,34).
Ethanol-induced increase in DRV clearance can decrease drug levels in the plasma, which in turn may lead to less drug exposure to lymphocytes and monocytes, the primary targets as well as reservoirs for HIV. Ethanol treatment has several pharmacodynamics effects on immune cells such as monocytes, macrophages, and dendritic cells (35). In addition, monocytes significantly express CYP2E1 and CYP3A4 relative to other CYPs as well as these enzymes are induced by ethanol (36,37). Therefore, it is conceivable that intracellular drug levels as well as HIV replication can be alerted by ethanol consumption. The detected decreasing trend in total DRV exposure in the presence of ethanol in HIV-infected monocytes is in agreement with the above notions. Similarly, a recent study showed that ethanol exposure decreases total EVG exposure in HIV-infected monocytes, which is translated into an elevation in HIV replication (Midde NM, Plos One 2017, in press). However, in present study ethanol-mediated decrease in DRV levels did not translate into increased HIV replication with or without booster drug RTV, suggesting the limited influence of ethanol on DRV at least in monocytic cells. Alternatively, it is possible that the impact of ethanol may be masked because of high concentration of DRV.
Alteration in CYP3A4 activity either by inhibition or induction is one of the major routes for pharmacokinetic drug-drug interactions in the body (38). Most of the HIV protease inhibitors can act as inducers and inhibitors of CYP3A4 (39). As CYP3A4 is a predominant drug metabolizing enzyme and also principal target for non-HIV medication, potential drug-drug interactions (DDI) during HIV treatment is of significant concern. One of the mechanism for potential DDI is binding of multiple agents to the same enzyme. Furthermore, nelfinavir, a PI for HIV treatment, showed a 3-fold decrease in IC50 in response to ethanol exposure (9), which is in agreement with the observed DRV IC50 data. Taken together, these results suggest that the presence of ethanol may interfere with CYP3A4 and RTV interaction, which in turn affects the inhibitory nature of DRV on CYP3A4.
DRV alone or in combination with RTV shows Cmax values from 2–5 μM range (40). Similarly, 20–25 mM ethanol is physiologically relevant blood concentration in mild-to-moderate drinkers (41,42). In this study we report high CYP3A4 inhibitory potencies (0.166 μM) for DRV. Considering this strong inhibitory nature of DRV and high DRV physiological concentration, it appears that the effect of ethanol on CYP3A4 is clinically insignificant. However, with reference to ethanol-CYP3A4 binding affinity (5.9 mM) (9), which is 4- to 5-fold lower than its physiological concentration, ethanol is likely bind to CYP3A4 along with DRV. In fact, it was reported that drugs including diazepam and testosterone can bind to and be metabolized by CYP3A4 simultaneously leading to homotropic enzyme cooperativity (43). Considering the large active site of CYP3A4 that can accommodate more than one bulky drug molecules (44), and with ethanol being a small molecule, it can be inferred that ethanol alters metabolic pattern of DRV. Besides, our docking results show a shift in the binding modes of DRV in the presence of ethanol and these variations are likely to alter the metabolic site of DRV. CYP3A4 exhibits a dramatic shift in the conformation upon binding of substrate or inhibitors that alters the enzyme efficiency to metabolize its substrates (33). When DDI occurs especially at the proximity of active site they may alter the drug disposition, efficacy, or toxicity. Therefore, these data suggest that ethanol induced increased drug metabolism could be due to its interference with active sites of CYP enzyme for DRV and RTV interactions.
In conclusion, our results suggest that ethanol induces alterations in the conformation of CYP3A4, which may change the binding pattern of DRV leading to altered DRV metabolic and inhibitory characteristics. Specifically, the effect of ethanol appears to be more pronounced on DRV + RTV than DRV alone in microsomes, which has clinical significance because RTV is used as pharmacoenhancer with DRV. Additionally, ethanol did not exhibit any noticeable impact on HIV replication in the presence of DRV in monocytic cells. Thus our results are clinically significant, and is a step forward in improving the ART dosing strategies for HIV positive alcohol users. Further studies are warranted to confirm these in vitro findings in HIV-infected animal models as well as ex vivo samples obtained from HIV-infected alcohol drinkers.
Acknowledgments
DISCLOSURES
This research was supported by grants from the National Institute of Health to Santosh Kumar (NIAAA/NIH AA-022063) and Bernd Meibohm (OD/NIH S10OD016226), and from the National Natural Science Foundation of China to Weihua Li (Grant 81,373,328).
ABBREVIATIONS
- AUCtot
Area under the concentration-time curve
- Cmax
The maximum concentration of a drug in the cells after dosing
- CYP
Cytochrome P450
- DRV
Darunavir
- EVG
Elvitegravir
- IC50
The 50% inhibitory concentration
- Km
The Michaelis-Menten constant
- LC-MS/MS
Liquid chromatography-tandem mass spectrometry
- RTV
Ritonavir
- Vmax
The maximal velocity
References
- 1.Pokorna J, Machala L, Rezacova P, Konvalinka J. Current and novel inhibitors of HIV protease. Viruses. 2009;1(3):1209–39. doi: 10.3390/v1031209. [DOI] [PMC free article] [PubMed] [Google Scholar]
- 2.Rittweger M, Arasteh K. Clinical pharmacokinetics of darunavir. Clin Pharmacokinet. 2007;46(9):739–56. doi: 10.2165/00003088-200746090-00002. [DOI] [PubMed] [Google Scholar]
- 3.Mudra DR, Desino KE, Desai PV. In silico, in vitro and in situ models to assess interplay between CYP3A and P-gp. Curr Drug Metab. 2011;12(8):750–73. doi: 10.2174/138920011798356999. [DOI] [PubMed] [Google Scholar]
- 4.Poizot-Martin I, Naqvi A, Obry-Roguet V, Valantin MA, Cuzin L, Billaud E, et al. Potential for drug-drug interactions between Antiretrovirals and HCV direct acting antivirals in a large cohort of HIV/HCV Coinfected patients. PLoS One. 2015;10(10):e0141164. doi: 10.1371/journal.pone.0141164. [DOI] [PMC free article] [PubMed] [Google Scholar]
- 5.Midde NM, Kumar S. Development of NanoART for HIV treatment: minding the cytochrome P450 (CYP) enzymes. J Pers Nanomed. 2015;1(1):24–32. [PMC free article] [PubMed] [Google Scholar]
- 6.Chander G, Josephs J, Fleishman JA, Korthuis PT, Gaist P, Hellinger J, et al. Alcohol use among HIV-infected persons in care: results of a multi-site survey. HIV Med. 2008;9(4):196–202. doi: 10.1111/j.1468-1293.2008.00545.x. [DOI] [PMC free article] [PubMed] [Google Scholar]
- 7.Kumar S, Jin M, Ande A, Sinha N, Silverstein PS, Kumar A. Alcohol consumption effect on antiretroviral therapy and HIV-1 pathogenesis: role of cytochrome P450 isozymes. Expert Opin Drug Metab Toxicol. 2012;8(11):1363–75. doi: 10.1517/17425255.2012.714366. [DOI] [PMC free article] [PubMed] [Google Scholar]
- 8.Baum MK, Rafie C, Lai S, Sales S, Page JB, Campa A. Alcohol use accelerates HIV disease progression. AIDS Res Hum Retrovir. 2010;26(5):511–8. doi: 10.1089/aid.2009.0211. [DOI] [PMC free article] [PubMed] [Google Scholar]
- 9.Kumar S, Earla R, Jin M, Mitra AK, Kumar A. Effect of ethanol on spectral binding, inhibition, and activity of CYP3A4 with an antiretroviral drug nelfinavir. Biochem Biophys Res Commun. 2010;402(1):163–7. doi: 10.1016/j.bbrc.2010.10.014. [DOI] [PubMed] [Google Scholar]
- 10.Kumar S, Kumar A. Differential effects of ethanol on spectral binding and inhibition of cytochrome P450 3A4 with eight protease inhibitors antiretroviral drugs. Alcohol Clin Exp Res. 2011;35(12):2121–7. doi: 10.1111/j.1530-0277.2011.01575.x. [DOI] [PMC free article] [PubMed] [Google Scholar]
- 11.Rao PS, Kumar S. Chronic effects of ethanol and/or Darunavir/ ritonavir on U937 Monocytic cells: regulation of cytochrome P450 and antioxidant enzymes, oxidative stress, and cytotoxicity. Alcohol Clin Exp Res. 2016;40(1):73–82. doi: 10.1111/acer.12938. [DOI] [PMC free article] [PubMed] [Google Scholar]
- 12.Midde NM, Rahman MA, Rathi C, Li J, Mieibohm B, Li W, et al. Effect of ethanol on the metabolic characteristics of HIV-1 integrase inhibitor Elvitegravir and Elvitegravir/Cobicistat with CYP3A: an analysis using a newly developed LC-MS/MS meth. PLoS One. 2016;11(2):e0149225. doi: 10.1371/journal.pone.0149225. [DOI] [PMC free article] [PubMed] [Google Scholar]
- 13.Rao P, Ande A, Sinha N, Kumar A, Kumar S. Effects of cigarette smoke condensate on oxidative stress, apoptotic cell death, and HIV replication in human Monocytic cells. PLoS One. 2016;11(5):e0155791. doi: 10.1371/journal.pone.0155791. [DOI] [PMC free article] [PubMed] [Google Scholar]
- 14.Earla R, Kumar S, Wang L, Bosinger S, Li J, Shah A, et al. Enhanced methamphetamine metabolism in rhesus macaque as compared with human: an analysis using a novel method of liquid chromatography with tandem mass spectrometry, kinetic study, and substrate docking. Drug Metab Dispos: Biolo Fate Chem. 2014;42(12):2097–108. doi: 10.1124/dmd.114.059378. [DOI] [PMC free article] [PubMed] [Google Scholar]
- 15.Shelley JC, Cholleti A, Frye LL, Greenwood JR, Timlin MR, Uchimaya M. Epik: a software program for pK(a) prediction and protonation state generation for drug-like molecules. J Comput Aided Mol Des. 2007;21(12):681–91. doi: 10.1007/s10822-007-9133-z. [DOI] [PubMed] [Google Scholar]
- 16.Sekar V, Spinosa-Guzman S, De Paepe E, Stevens T, Tomaka F, De Pauw M, et al. Pharmacokinetics of multiple-dose darunavir in combination with low-dose ritonavir in individuals with mild-to-moderate hepatic impairment. Clin Pharmacokinet. 2010;49(5):343–50. doi: 10.2165/11530690-000000000-00000. [DOI] [PubMed] [Google Scholar]
- 17.Rokitta D, Pfeiffer K, Streich C, Gerwin H, Fuhr U. The effect of organic solvents on enzyme kinetic parameters of human CYP3A4 and CYP1A2 in vitro. Toxicol Mech Methods. 2013;23(8):576–83. doi: 10.3109/15376516.2013.806622. [DOI] [PubMed] [Google Scholar]
- 18.Je YT, Sim WC, Kim DG, Jung BH, Shin HS, Lee BH. Expression of CYP3A in chronic ethanol-fed mice is mediated by endogenous pregnane X receptor ligands formed by enhanced cholesterol metabolism. Arch Toxicol. 2015;89(4):579–89. doi: 10.1007/s00204-014-1268-9. [DOI] [PubMed] [Google Scholar]
- 19.Pasternak AO, Lukashov VV, Berkhout B. Cell-associated HIV RNA: a dynamic biomarker of viral persistence. Retrovirology. 2013;10:41. doi: 10.1186/1742-4690-10-41. [DOI] [PMC free article] [PubMed] [Google Scholar]
- 20.Midde NM, Sinha N, Lukka PB, Meibohm B, Kumar S. Alterations in cellular pharmacokinetics and pharmacodynamics of elvitegravir in response to ethanol exposure in HIV-1 infected monocytic (U1) cells. PLoS One. 2017;12(2):e0172628. doi: 10.1371/journal.pone.0172628. [DOI] [PMC free article] [PubMed] [Google Scholar]
- 21.Mastrogiannis DS, Wang X, Dai M, Li J, Wang Y, Zhou Y, et al. Alcohol enhances HIV infection of cord blood monocyte-derived macrophages. Curr HIV Res. 2014;12(4):301–8. doi: 10.2174/1570162x12666140721124923. [DOI] [PMC free article] [PubMed] [Google Scholar]
- 22.Agudelo M, Figueroa G, Yndart A, Casteleiro G, Munoz K, Samikkannu T, et al. Alcohol and cannabinoids differentially affect HIV infection and function of human monocyte-derived dendritic cells (MDDC) Front Microbiol. 2015;6:1452. doi: 10.3389/fmicb.2015.01452. [DOI] [PMC free article] [PubMed] [Google Scholar]
- 23.Ande A, Sinha N, Rao PSS, McArthur CP, Ayuk L, Achu PN, et al. Enhanced oxidative stress by alcohol use in HIV+ patients: possible involvement of cytochrome P450 2E1 and antioxidant enzymes. AIDS Res Ther. 2015;12:29. doi: 10.1186/s12981-015-0071-x. [DOI] [PMC free article] [PubMed] [Google Scholar]
- 24.DrugsFDA. 2015 http://www.accessdata.fda.gov/drugsatfda_docs/nda/2006/021976s000_Sprycel_ClinPharmR.pdf. [Accessed on 2016, January 7]
- 25.Boffito M, Jackson A, Amara A, Back D, Khoo S, Higgs C, et al. Pharmacokinetics of once-daily darunavir-ritonavir and atazanavirritonavir over 72 hours following drug cessation. Antimicrob Agents Chemother. 2011;55(9):4218–23. doi: 10.1128/AAC.01747-10. [DOI] [PMC free article] [PubMed] [Google Scholar]
- 26.Asai H, Imaoka S, Kuroki T, Monna T, Funae Y. Microsomal ethanol oxidizing system activity by human hepatic cytochrome P450s. J Pharmacol Exp Ther. 1996;277(2):1004–9. [PubMed] [Google Scholar]
- 27.Hamitouche S, Poupon J, Dreano Y, Amet Y, Lucas D. Ethanol oxidation into acetaldehyde by 16 recombinant human cytochrome P450 isoforms: role of CYP2C isoforms in human liver microsomes. Toxicol Lett. 2006;167(3):221–30. doi: 10.1016/j.toxlet.2006.09.011. [DOI] [PubMed] [Google Scholar]
- 28.Cardoso JL, Lanchote VL, Pereira MP, Capela JM, de Moraes NV, Lepera JS. Impact of inhalational exposure to ethanol fuel on the pharmacokinetics of verapamil, ibuprofen and fluoxetine as in vivo probe drugs for CYP3A, CYP2C and CYP2D in rats. Food Chem Toxicol. 2015;84:99–105. doi: 10.1016/j.fct.2015.08.002. [DOI] [PubMed] [Google Scholar]
- 29.Salmela KS, Kessova IG, Tsyrlov IB, Lieber CS. Respective roles of human cytochrome P-4502E1, 1A2, and 3A4 in the hepatic microsomal ethanol oxidizing system. Alcohol Clin Exp Res. 1998;22(9):2125–32. [PubMed] [Google Scholar]
- 30.Sellers EM, Holloway MR. Drug kinetics and alcohol ingestion. Clin Pharmacokinet. 1978;3(6):440–52. doi: 10.2165/00003088-197803060-00002. [DOI] [PubMed] [Google Scholar]
- 31.Kostrubsky VE, Strom SC, Wood SG, Wrighton SA, Sinclair PR, Sinclair JF. Ethanol and isopentanol increase CYP3A and CYP2E in primary cultures of human hepatocytes. Arch Biochem Biophys. 1995;322(2):516–20. doi: 10.1006/abbi.1995.1495. [DOI] [PubMed] [Google Scholar]
- 32.Feierman DE, Melinkov Z, Nanji AA. Induction of CYP3A by ethanol in multiple in vitro and in vivo models. Alcohol Clin Exp Res. 2003;27(6):981–8. doi: 10.1097/01.ALC.0000071738.53337.F4. [DOI] [PubMed] [Google Scholar]
- 33.Zhou SF. Drugs behave as substrates, inhibitors and inducers of human cytochrome P450 3A4. Curr Drug Metab. 2008;9(4):310–22. doi: 10.2174/138920008784220664. [DOI] [PubMed] [Google Scholar]
- 34.Lane EA, Guthrie S, Linnoila M. Effects of ethanol on drug and metabolite pharmacokinetics. Clin Pharmacokinet. 1985;10(3):228–47. doi: 10.2165/00003088-198510030-00003. [DOI] [PubMed] [Google Scholar]
- 35.Szabo G, Mandrekar P. Human monocytes, macrophages, and dendritic cells: alcohol treatment methods. Methods Mol Biol. 2008;447:113–24. doi: 10.1007/978-1-59745-242-7_9. [DOI] [PubMed] [Google Scholar]
- 36.Jin M, Ande A, Kumar A, Kumar S. Regulation of cytochrome P450 2e1 expression by ethanol: role of oxidative stress-mediated pkc/jnk/sp1 pathway. Cell Death Dis. 2013;4:e554. doi: 10.1038/cddis.2013.78. [DOI] [PMC free article] [PubMed] [Google Scholar]
- 37.Jin M, Earla R, Shah A, Earla RL, Gupte R, Mitra AK, et al. A LC-MS/MS method for concurrent determination of nicotine metabolites and role of CYP2A6 in nicotine metabolism in U937 macrophages: implications in oxidative stress in HIV + smokers. J NeuroImmune Pharmacol. 2012;7(1):289–99. doi: 10.1007/s11481-011-9283-6. [DOI] [PMC free article] [PubMed] [Google Scholar]
- 38.Zhou S-F, Xue CC, Yu X-Q, Li C, Wang G. Clinically important drug interactions potentially involving mechanism-based inhibition of cytochrome P450 3A4 and the role of therapeutic drug monitoring. Ther Drug Monit. 2007;29(6):687–710. doi: 10.1097/FTD.0b013e31815c16f5. [DOI] [PubMed] [Google Scholar]
- 39.Kirby BJ, Collier AC, Kharasch ED, Whittington D, Thummel KE, Unadkat JD. Complex drug interactions of HIV protease inhibitors 1: inactivation, induction, and inhibition of cytochrome P450 3A by ritonavir or nelfinavir. Drug Metab Dispos: Biolo Fate Chem. 2011;39(6):1070–8. doi: 10.1124/dmd.110.037523. [DOI] [PMC free article] [PubMed] [Google Scholar]
- 40.Vermeir M, Lachau-Durand S, Mannens G, Cuyckens F, van Hoof B, Raoof A. Absorption, metabolism, and excretion of darunavir, a new protease inhibitor, administered alone and with low-dose ritonavir in healthy subjects. Drug Metab Dispos: Biolo Fate Chem. 2009;37(4):809–20. doi: 10.1124/dmd.108.024109. [DOI] [PubMed] [Google Scholar]
- 41.Pasala S, Barr T, Messaoudi I. Impact of alcohol abuse on the adaptive immune system. Alcohol Res. 2015;37(2):185–97. doi: 10.35946/arcr.v37.2.04. [DOI] [PMC free article] [PubMed] [Google Scholar]
- 42.Harrison NL, Skelly MJ, Grosserode EP, Lowes DC, Zeric T, Phister S, et al. Effects of acute alcohol on excitability in the CNS. Neuropharmacology. 2017 doi: 10.1016/j.neuropharm.2017.04.007. [DOI] [PMC free article] [PubMed] [Google Scholar]
- 43.Kenworthy KE, Clarke SE, Andrews J, Houston JB. Multisite kinetic models for CYP3A4: simultaneous activation and inhibition of diazepam and testosterone metabolism. Drug Metab Dispos. 2001;29(12):1644–51. [PubMed] [Google Scholar]
- 44.Hosea NA, Miller GP, Guengerich FP. Elucidation of distinct ligand binding sites for cytochrome P450 3A4. Biochemistry. 2000;39(20):5929–39. doi: 10.1021/bi992765t. [DOI] [PubMed] [Google Scholar]