

Summary
Sirtuin 3 (SIRT3) is a NAD+-dependent deacetylase downregulated in aging and age-associated diseases such as cancer and neurodegeneration and in high-fat diet (HFD)-induced metabolic disorders. Here, we performed a small-molecule screen and identified an unexpected metabolic vulnerability associated with SIRT3 loss. Azaserine, a glutamine analog, was the top compound that inhibited growth and proliferation of cells lacking SIRT3. Using stable isotope tracing of glutamine, we observed its increased incorporation into de novo nucleotide synthesis in SIRT3 knockout (KO) cells. Furthermore, we found that SIRT3 KO cells upregulated the diversion of glutamine into de novo nucleotide synthesis through hyperactive mTORC1 signaling. Overexpression of SIRT3 suppressed mTORC1 and growth in vivo in a xenograft tumor model of breast cancer. Thus, we have uncovered a metabolic vulnerability of cells with SIRT3 loss by using an unbiased small-molecule screen.
Graphical abstract
SIRT3 is lost or downregulated in numerous pathologies. Loss of SIRT3 results in increased cell proliferation. Gonzalez Herrera et al. identify glutamine incorporation into nucleotides to be a driving force behind increased proliferation of cells lacking SIRT3.

Introduction
The mitochondrial sirtuin 3 (SIRT3) maintains cellular homeostasis by deacetylating and modulating activity of its targets to promote energy generation, protect against oxidative stress, and activate mitochondrial metabolic pathways (van de Ven et al., 2017). For example, SIRT3 protects mitochondrial function by modulating reactive oxygen species (ROS) through numerous substrates, including superoxide dismutase 2 (SOD2), isocitrate dehydrogenase (IDH2), and the transcription factor FOXO3A (Qiu et al., 2010; Sundaresan et al., 2009; Yu et al., 2012). SIRT3 interacts with various enzymes to regulate branches of metabolism that include fatty acids, amino acids, glucose, and ketone bodies (Yang et al., 2016). However, loss of SIRT3 can have metabolic effects beyond direct substrate regulation, as generation of ROS possesses signaling roles. For instance, elevated ROS caused by SIRT3 loss repress prolyl hydroxylase domain (PHD) enzymes, leading to the stabilization of hypoxia-inducible factor-1α (HIF1α) and increased glycolytic metabolism downstream of HIF target genes (Bell et al., 2011; Finley et al., 2011; Masson et al., 2001).
To identify additional vulnerabilities caused by SIRT3 loss, we performed an unbiased small-molecule screen of >8,000 known bioactive compounds. Azaserine, a compound structurally similar to glutamine, was identified as the top compound in this screen that selectively inhibits the proliferation of SIRT3 knockout (KO) cells. Furthermore, we found that SIRT3 inhibits glutamine metabolism and de novo nucleotide synthesis. Mechanistically, loss of SIRT3 promotes de novo nucleotide biosynthesis through upregulation of signaling via the mechanistic target of rapamycin complex 1 (mTORC1). Importantly, SIRT3 overexpression in an in vivo breast cancer model suppresses proliferation and mTORC1 signaling.
Results
Small-Molecule Screen Identifies Glutamine Metabolism as a Vulnerability in SIRT3 KO Cells
We performed a high-throughput small-molecule screen using immortalized SIRT3 wild-type (WT) and KO mouse embryonic fibroblasts (MEFs) to identify drugs and pathways that selectively affect the growth of SIRT3 KO cells. We screened the known bioactives library at the Harvard Institute of Chemistry and Cell Biology (ICCB) Longwood screening facility (Figure 1A). Of 8,327 compounds tested, 108 passed our screening criteria to inhibit the growth of SIRT3 KO MEFs to a degree at least 50% greater than their effect on WT MEFs, without decreasing WT cell viability below 20% (Figure 1B; Table S1). From these, 50 compounds were validated with dose-response curves (Figures S1A–S1D; Table S1). The top-scoring compound was azaserine, which inhibited the growth of SIRT3 KO cells with a half maximal inhibitory concentration (IC50) of 2.9 μM,10-fold lower than its IC50 for WT MEFs (Figures 1C and 1D). Because azaserine is structurally similar to glutamine, and SIRT3 loss is associated with fuel reprogramming, we hypothesized that the identification of azaserine may highlight a vulnerability in glutamine metabolism in SIRT3 KO MEFs (Figure 1C). We tested this idea using a multi-faceted approach. First, we treated cells with another glutamine analog, 6-diazo-5-oxo-L-norleucine (DON), and found that DON likewise inhibits proliferation of SIRT3 KO MEFs to a greater extent than it inhibits proliferation of WT MEFs (Figure 1E). Next, we tested whether SIRT3-null cells were more dependent on glutamine and found SIRT3 KO cells to be 15% more sensitive to glutamine deprivation than WT MEFs (Figure 1F). We examined growth in the presence of azaserine and found that it preferentially inhibited SIRT3 KO MEF proliferation, confirming our original screen (Figure 1G). Similarly, KRAS-transformed SIRT3 KO MEFs formed more colonies than KRAS-transformed WT MEFs in a colony formation assay (Kim et al., 2010). Azaserine marginally decreased the number of colonies formed by WT cells while significantly decreasing the number of colonies formed by SIRT3 KO cells (Figures 1H and 1I). These findings demonstrate an increased reliance of SIRT3 KO cells on glutamine for survival and proliferation and a potential deregulation of glutamine use.
Figure 1. Chemical Screen Identifies Glutamine Metabolism as a Vulnerability in SIRT3 KO Cells.

(A) Layout of experimental design for the small-molecule screen.
(B) Primary screen data highlighting the top five compounds inhibiting SIRT3 KO cell growth (see also Figures S1A–S1D and Table S1).
(C) Schematic of the structures of glutamine and its analogs, azaserine and 6-diazo-5-oxo-L-norleucine (DON).
(D and E) Dose-response curves of WT and SIRT3 KO MEF growth after treatment with azaserine (D) or DON (E) for 72 hr.
(F) Cell viability measured by propidium iodide incorporation in WT and SIRT3 KO MEFs after 72 hr of glutamine deprivation.
(G) Relative growth of WT and SIRT3 KO MEFs treated with 30 μM azaserine compared to control for 4 days.
(H) Clonogenic growth assay of Kras (G12V)-transformed WT and SIRT3 KO MEFs treated with DMSO (as a control) or 30 mM azaserine for 8 days.
(I) Quantification of colony formation assay using ImageJ (NIH) to calculate the area of each well covered by WT or SIRT3 KO MEF colonies (n = 3).
(J and K) Glutamine uptake (J) and ammonia production (K) in WT or SIRT3 KO MEFs after 24 hr (see also Figures S1E–S1K).
Data in this figure are represented as mean ± SEM. *p ≤ 0.05, **p ≤ 0.01, and ***p ≤ 0.001.
Glutamine is a key amino acid used as a substrate for production of macromolecules to sustain anabolic growth, the antioxidant stress response, and energy production (Cluntun et al., 2017). To probe glutamine use, we examined fuel uptake and observed an increase in glutamine uptake in SIRT3 KO MEFs compared with WT MEFs (Figure 1J). In addition, SIRT3 KO MEFs secreted higher amounts of ammonia compared with WT MEFs (Figure 1K), which is one by-product of glutaminolysis. Increased glutamine consumption was also observed upon silencing of SIRT3 with lentiviral short hairpin RNA (shRNA) in MCF10A cells, suggesting that the effect of SIRT3 loss on glutamine metabolism may be more general and not limited to MEFs (Figures S1E–S1G). Moreover, rescue of SIRT3 expression in SIRT3 KO MEFs resulted in decreased glutamine uptake and ammonia production (Figures S1H–S1J). In addition, we observed reduced proliferation in SIRT3 KO MEFs after re-expression of SIRT3, underscoring the specific contribution of SIRT3 to the proliferation effect (Figure S1K). In sum, an unbiased small-molecule screen revealed a glutamine analog that selectively represses SIRT3 KO cell proliferation. Furthermore, the growth advantage of SIRT3 KO cells is dependent on glutamine metabolism, which can contribute to numerous metabolic pathways to promote proliferation.
Azaserine Inhibits De Novo Nucleotide Synthesis in SIRT3 KO Cells
Comparison of SIRT3 WT and KO steady-state metabolomics points to pyrimidine metabolism as one of the most significantly altered pathways as assessed by MetaboAnalyst pathway enrichment analysis (Figure S2C). To determine the effect of azaserine on metabolite levels, we performed metabolomics in WT and SIRT3 KO MEFs treated with azaserine. After 6 hr of treatment, azaserine significantly altered the abundance of 22 metabolites in SIRT3 KO cells and only 3 metabolites in WT cells (Table S2). By performing MetaboAnalyst analysis of the metabolomics data, we identified purine and pyrimidine synthesis to be significantly altered by azaserine treatment in SIRT3 KO MEFs (Figures 2A and S2A; Table S2). Glutamine is used in three steps of de novo purine synthesis. Treatment with azaserine resulted in a significant decrease in the products of purine synthesis, such as AMP, ADP, XMP, and 5′-GMP, in SIRT3 KO MEFs (Figures 2B and 2C). Additionally, levels of a de novo purine synthesis intermediate, carboxyaminoimidazole ribonucleotide (CAIR), were significantly higher in SIRT3 KO MEFs compared with WT MEFs. Moreover, CAIR was significantly decreased in SIRT3 KO cells upon treatment with azaserine (Figure 2D). These findings are consistent with previous studies showing that azaserine inhibits de novo purine synthesis (Ahluwalia et al., 1990). Because glutamine also contributes to pyrimidine synthesis and because pyrimidines complement purines during DNA synthesis, it was consistent that N-carbamoyl aspartate, a key intermediate in de novo pyrimidine synthesis, was significantly increased in SIRT3 KO cells compared with WT cells and significantly decreased in azaserine-treated cells (Figures S2B and S2D). Orotate, another de novo pyrimidine synthesis intermediate, was also significantly decreased by azaserine (Figure S2E). Moreover, folate metabolism, which plays an important role in de novo purine and pyrimidine synthesis by contributing to the formation of the purine ring and synthesis of dTMP for DNA synthesis, was likewise significantly decreased by azaserine in WT and SIRT3 KO cells (Figure 2E). Because glutamine is an anaplerotic fuel, we also examined the effect of azaserine on TCA cycle intermediates and found that azaserine had no effect on TCA cycle intermediates (Figures S2F and S2G). Taken together, our results indicate that azaserine affects nucleotide metabolism, a major glutamine-dependent metabolic pathway, in SIRT3 KO cells.
Figure 2. Azaserine Inhibits Increased De Novo Purine Synthesis in SIRT3 KO MEFs.

(A) Table of the metabolic pathways significantly affected by 6 hr treatment with 30 μM azaserine in SIRT3 KO MEFs. The pathway analysis module in MetaboAnalyst 3.0 was used for the analysis (see also Figures S2A–S2G and Table S2).
(B) Schematic of purine metabolism. Shaded in pink is the de novo purine synthesis pathway, and shaded in blue are intermediates in purine degradation or the salvage pathway. Blue arrows represent purine salvage pathways.
(C) Heatmap comparing metabolite levels in the presence of azaserine (30 μM for 6 hr) in WT and SIRT3 KO MEFs (n = 4) or treated with DMSO (control). Red indicates upregulation and blue indicates downregulation. Asterisk denotes statistically altered metabolites comparing SIRT3 KO with SIRT3 KO + azaserine.
(D and E) Relative levels of carboxyaminoimidazole ribonucleotide (CAIR) (D) and 5-MeTHF (E) in WT and SIRT3 KO MEFs after treatment with 30 μM azaserine for 6 hr.
(F and G) Incorporation of 14C-glycine (F) or 14C-aspartate (G) into DNA in WT and SIRT3 KO cells in the presence or absence of 30 mM azaserine for 8 hr (see also Figures S2H–S2J).
(H) Growth of WT and SIRT3 KO MEFs with PPAT knockdown relative to control cells and to WT cells with the corresponding PPAT shRNA (see also Figure S2K).
(I) Relative growth of WT and SIRT3 KO MEFs treated as specified.
Data in this figure are represented as mean ± SEM. *p ≤ 0.05, **p ≤ 0.01, and ***p ≤ 0.001; n.s., not significant.
To directly examine whether SIRT3 had an effect on de novo purine or pyrimidine synthesis, we measured incorporation into DNA of radiolabeled carbon from 14C-glycine or 14C-aspartate, which enter purine and pyrimidine synthesis, respectively. Consistent with an increase in de novo purine synthesis intermediates, SIRT3 KO cells displayed increased incorporation of radiolabeled glycine into DNA (Figure 2F). As a control, we measured the incorporation of radiolabeled adenine into DNA to assess the purine salvage pathway. We observed no difference in the salvage pathway between WT and SIRT3 KO MEFs under conditions in which de novo purine synthesis is stimulated (Figure S2H). Upon stimulation of de novo pyrimidine synthesis, SIRT3 KO MEFs displayed increased incorporation of radiolabeled aspartate into DNA compared with WT MEFs (Figure 2G). The increase in de novo pyrimidine synthesis was accompanied by a slight increase in the pyrimidine salvage pathway based on incorporation of radiolabeled thymidine (Figure S2I). Next, given that azaserine decreased the levels of de novo purine synthesis intermediates, we probed the effect of azaserine using this assay. Azaserine significantly dampened de novo purine synthesis, evidenced by decreased incorporation of glycine into DNA in both WT and SIRT3 KO cells (Figure 2F). These results show that loss of SIRT3 promotes de novo synthesis of nucleotides, key building blocks for DNA and RNA synthesis, which are crucial for proliferation (Figure S2J).
Because azaserine decreased purine synthesis, we next tested the idea that elevated purine synthesis would provide a proliferative advantage to SIRT3 KO cells. The first rate-limiting enzyme in de novo purine synthesis is phosphoribosyl pyrophosphate amidotransferase (PPAT) (Metzler et al., 2016). To determine if SIRT3 KO cells are susceptible to inhibition of de novo purine synthesis, we examined the role of PPAT knockdown on WT and SIRT3 KO cell proliferation (Figure S2K). PPAT knockdown significantly decreased proliferation of SIRT3 KO cells compared with WT cells (Figures 2H and 2I). Additionally, PPAT knockdown combined with azaserine treatment did not have a further effect on WT or SIRT3 KO cells, suggesting that a major effect of azaserine on proliferation is inhibition of purine synthesis. Altogether, these findings demonstrate that loss of SIRT3 elevates de novo purine synthesis.
Hyperactive mTORC1 Signaling in SIRT3 KO MEFs Contributes to Alterations in Glutamine Metabolism
To identify pathways significantly altered in SIRT3 KO cells that may contribute to an increase in nucleotide synthesis, we performed RNA sequencing of WT and SIRT3 KO MEFs. Using the DESeq2 differential expression algorithm, we found differential expression of 2,650 genes between WT and SIRT3 KO MEFs (Love et al., 2014). We used MotifADE, a previously described approach to perform an unbiased transcription factor binding motif enrichment analysis using the genes that were significantly upregulated or downregulated in SIRT3 KO MEFs (Mootha et al., 2004). We found enrichment of binding sites for 11 transcription factors in the RNA expressed by SIRT3 KO MEFs, including HIF1 and Myc (Table 1). Importantly, these transcription factors have been identified to operate downstream of mTORC1 to regulate metabolism (Dü et al., 2010).
Table 1. Enrichment of Transcription Factor Binding Sequences in Promoters of Differentially Expressed Genes in SIRT3 KO Cells, Related to Figure 1.
| Transcription Factor | Binding Motif | Frequency | p Value | Adjusted p Value |
|---|---|---|---|---|
| E2F | THVGCGCGAAAAHKR | 0.7551 | 3.48E-06 | 0.004 |
| Pax-3 | TCGTCACRCYYHM | |||
| ATF3 | NBSTGACGTCANCS | |||
| HTF | VDHHWDNDMCACGTCABYNHWNDN | 0.4488 | 2.61E-05 | 0.027 |
| E4F1 | SHTACGTCAC | |||
| CREB | CGTCAB | |||
| Myc | CACGTGB | |||
| N-Myc | NNNCACGTGNNN | |||
| c-Myc:Max | NNNNNNNCACGTGNNNNNNN / NDASCACGTGSTHN | |||
| USF | NCACGTGN / NNRHCACGTGDYNN | 0.5843 | 3.81E-05 | 0.039 |
| SREBP-1 | NATCACGTGAB | |||
| ARNT (HIF1) | NDDDNCACGTGNNNNN / NVNNNRWCACGTGWYNNNBN | |||
| HTF | VDHHWDNDMCACGTCABYNHWNDN |
Differentially expressed genes identified by RNA-seq were used to identify enrichment of transcription factor binding motifs using the previously described MotifADE method.
The mTORC1 signaling pathway has been reported to regulate glutamine metabolism and nucleotide synthesis (Ben-Sahra and Manning, 2017; Csibi et al., 2013; Wise et al., 2008). Thus, we examined if mTORC1 signaling was hyperactive in SIRT3 KO MEFs compared with WT MEFs. Under basal condition, we observed phosphorylation of mTORC1 targets such as carbamoyl-aspartate dehydrogenase (CAD), p70 S6 kinase (S6K), and ribosomal protein S6 (S6) in WT cells, and even higher phosphorylation in SIRT3 KO MEFs (Figures 3A and S3A). Removal of growth factors dampened mTORC1 signaling in WT MEFs, reflected by decreased phosphorylation of mTORC1 targets. Strikingly, SIRT3 KO cells were insensitive to growth factor deprivation and exhibited 3-fold elevated mTORC1 signaling compared with WT cells under serum starvation (Figure 3A). mTORC1 promotes purine biosynthesis through increased expression of activating transcription factor 4 (ATF4) (Ben-Sahra et al., 2016). Thus, we evaluated the effect of SIRT3 on ATF4 expression. Re-expression of SIRT3 in SIRT3 KO cells decreased ATF4 expression (Figure S3B). Moreover, mTORC1 is known to promote cellular growth, and concordant with elevated signaling, SIRT3 KO cells were bigger than WT cells in the presence and absence of serum (Figure S3E). Next, we examined if azaserine had an effect on mTORC1 signaling. Indeed, azaserine decreased mTORC1 signaling to a greater extent in SIRT3 KO cells than in WT cells, suggesting one mechanism by which azaserine modulates nucleotide biosynthesis (Figure 3B).
Figure 3. Hyperactive mTORC1 Signaling in the Absence of SIRT3 Contributes to Increased De Novo Purine Synthesis.

(A) Immunoblots of proteins phosphorylated upon mTORC1 activation in WT and SIRT3 KO MEFs after 16 hr of serum starvation or nutrient replete conditions (see also Figures S3A and S3B).
(B) Western blot of WT and SIRT3 KO MEFs treated with 30 μM azaserine for 24 hr.
(C) Glutamine uptake in WT and SIRT3 KO MEFs treated with 100 nM rapamycin or DMSO for 24 hr (n = 6) (see also Figure S3C). Data are represented as mean ± SEM.
(D) Heatmap comparing metabolite levels in the presence of rapamycin (100 nM, 6 hr) in WT and SIRT3 KO MEFs (n = 4) (see also Figures S3D and S3G). Red indicates upregulation and blue indicates downregulation.
(E) Proliferation of WT and SIRT3 KO MEFs treated with 100 nM Torin (see also Figures S3E, S3F, and S3H).
Data are represented as mean ± SD, comparing WT+Torin/WT (black asterisk) and KO+Torin/KO (red asterisk). ***p ≤ 0.001 and ****p ≤ 0.0001.
We next tested if elevated mTORC1 signaling was upstream of altered glutamine metabolism in SIRT3-null cells. In agreement with previous observations, inhibition of mTORC1 decreased glutamine uptake in WT and SIRT3 KO cells, abolishing the difference in glutamine use between WT and SIRT3 KO cells (Figures S3C and 3C). Importantly, rapamycin treatment specifically decreased levels of de novo purine and pyrimidine synthesis intermediates in SIRT3-null cells without affecting the levels of these intermediates in control cells (Figures 3D and S3D). Furthermore, mTORC1 inhibition with Torin or rapamycin decreased proliferation and cell size in SIRT3-null cells (Figures 3E, S3F, and S3H). Taken together, these results suggest that mTORC1 hyperactivation contributes to rewiring of glutamine metabolism and cell growth in SIRT3 KO cells.
SIRT3 Loss Promotes Glutamine Incorporation into Nucleotides
Although glutamine uptake is increased in SIRT3 KO MEFS, intra-cellular glutamine levels are depleted compared with WT MEFs, suggesting increased glutamine use (Figures 1J and S3G). To determine whether glutamine metabolism fueled nucleotide biosynthesis in SIRT3 KO MEFs, we performed metabolic tracing with 15N-glutamine, labeled on the amide nitrogen, which is incorporated into nucleotides (Figure 4A). We observed an increase in labeled nitrogen onto the purine and pyrimidine, AMP and UMP respectively, in SIRT3 KO MEFs compared to the WT cells (Figure 4B). Because we observed that azaserine reverses growth advantages of SIRT3 KO cells, we next tested if azaserine reduced glutamine incorporation into nucleotides. Indeed, azaserine treatment resulted in a significant inhibition of glutamine incorporation into AMP and UMP in SIRT3 KO MEFs without having much of an effect in SIRT3 WT MEFs (Figure 4C).
Figure 4. Incorporation of Glutamine Is Upregulated in SIRT3 KO Cells through the mTORC1.

(A) Schematic of glutamine incorporation into purine and pyrimidine synthesis.
(B) 15N-glutamine tracing into nucleotides in SIRT3 WT and KO MEFs after 8 hr.
(C) Tracing performed as in (B), after treatment with 30 μM azaserine or 100 nM Torin.
(D) Model of SIRT3 regulation of glutamine usage for de novo nucleotide biosynthesis to promote proliferation.
Data in this figure are represented as mean ± SEM. *p ≤ 0.05, **p ≤ 0.01, and ***p ≤ 0.001.
Because mTORC1 is a regulator of nucleotide biosynthesis and is upregulated to promote proliferation in SIRT3 KO cells, we tested if mTORC1 was necessary for glutamine incorporation into nucleotides. As with azaserine, we found that mTORC1 inhibition with Torin resulted in reduced incorporation of glutamine into AMP and UMP (Figure 4C). Furthermore, the effect was much more significant in SIRT3 KO cells compared with WT cells. In sum, loss of SIRT3 promotes glutamine-dependent de novo nucleotide synthesis in part through hyperactive mTORC1. Inhibition of any step of this process reduces the proliferative advantage of SIRT3-null cells (Figure 4D).
SIRT3 Overexpression Suppresses mTORC1 and Breast Cancer Growth In Vivo
SIRT3 expression is decreased in various cancer types, including breast cancer (Finley et al., 2011). However, whether SIRT3 represses growth of breast cancer cells in vivo has never been shown. To address this, we first examined the growth of control or SIRT3-overexpressing MDA-MB-231 breast cancer cells in a three-dimensional (3D) culture system in which cells form spherical structures on a layer of Matrigel. SIRT3 overexpression repressed sphere growth in MDA-MB-231 cells, as determined by the area of spheres formed (Figures 5A and 5B). Consistent with our observations in MEFs, SIRT3 overexpression in MDA-MB-231 cells reduced glutamine uptake, suggesting that glutamine promotes growth in this system (Figure 5C). We then treated control and SIRT3-overexpressing MDA-MB-231 cells with azaserine and examined its effect on growth. Azaserine treatment repressed growth of the spheres formed by control breast cancer cell lines without affecting SIRT3-overexpressing cells, demonstrating the inhibitory effect of SIRT3 on glutamine-dependent pathways that support growth (Figure 5D). Next, we compared the effect of SIRT3 overexpression with that of mTORC1 inhibition in MDA-MB-231 3D cultures. Torin treatment, which fully inhibits mTORC1 signaling, suppressed growth in the control breast cancer cells more than in cells with SIRT3 overexpression (Figure 5E).
Figure 5. SIRT3 Overexpression Suppresses mTORC1 and Breast Cancer Growth In Vivo.
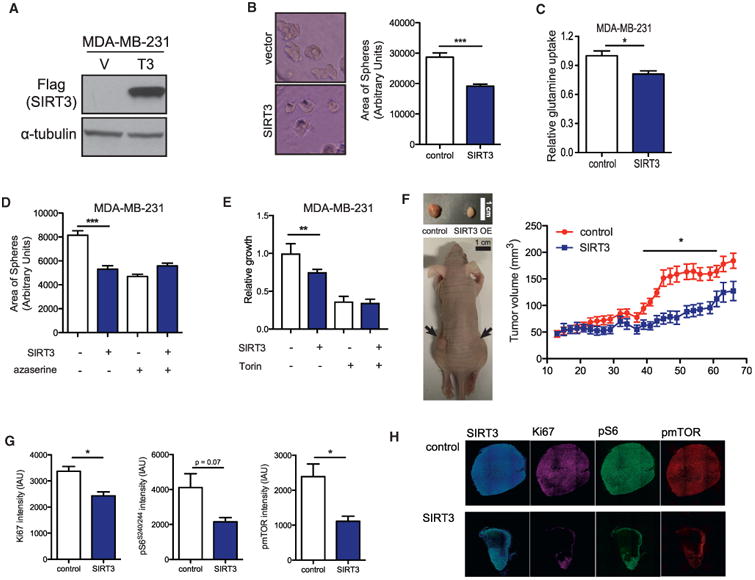
(A) Immunoblots of Flag-SIRT3 overexpression in MDA-MD-231 cells.
(B) Representative images and quantification of the area of spheres formed by control or SIRT3-overexpressing MDA-MB-231 cells. Data are represented as mean ± SEM.
(C) Glutamine uptake in control or SIRT3-overexpressing MDA-MB-231 cells. Data are represented as mean ± SEM.
(D) Area of spheres formed by control or SIRT3-overexpressing MDA-MB-231 cells treated with or without azaserine in 3D culture. Data are represented as mean ± SEM.
(E) Relative cell number after Torin treatment of control or SIRT3-overexpressing MDA-MB-231 cells in 3D cultures. Data are represented as mean ± SD.
(F) Representative image of nude mice injected with control or SIRT3-overexpressing MDA-MB-231 cells. Growth curve of xenograft tumors: 2 × 10⁶ control or SIRT3-overexpressing MDA-MB-231 cells were injected into the flanks of nude mice (n = 10). Data are represented as mean ± SEM.
(G) Quantification of Ki67, phospho-S6, and phospho-mTOR immunofluorescence in control compared with SIRT3-overexpressing xenograft tumors.
(H) Representative images of tumors analyzed in (G).
Data in this figure are represented as mean ± SEM.
The final images for this figure were stitched from multiple images (10× magnification, with the size of each image 1.6mm*1.2mm) through the use of ImageJ. The lines show the boundaries of each individual frame.
To test whether SIRT3 suppresses mTORC1 signaling in vivo, we performed cyclic immunofluorescence in xenograft tumors generated from control or SIRT3-overexpressing MDA-MB-231 cells. Xenograft tumors derived from SIRT3-overexpressing cells displayed decreased growth (Figure 5F). Moreover, dampened mTORC1 signaling was also observed in tumors formed by SIRT3-overexpressing MDA-MB-231 cells compared with control xenograft tumors, as assessed by analysis of phosphorylated S6 and mTOR (Figures 5G and 5H). Additionally, proliferation marker Ki67 was reduced in SIRT3-overexpressing xenografts, which corroborates smaller tumor volumes. In sum, these data support the hypothesis that SIRT3 represses mTORC1 signaling and proliferation in an in vivo breast cancer model.
Discussion
In this study we sought to identify vulnerabilities of cells with loss of SIRT3 using an unbiased small-molecule screen. This effort not only resulted in uncovering compounds that selectively inhibit growth and proliferation of SIRT3 KO cells but also identified glutamine metabolism as an upregulated and targetable pathway in SIRT3 KO cells. We previously reported that loss of SIRT3 promotes glycolysis through HIF1α stabilization (Finley et al., 2011), demonstrating that loss of a mitochondrial protein is able to shift the transcriptional profile in order to upregulate cytosolic metabolism. In this study we identified azaserine, a compound that shares structural similarity with glutamine, to selectively inhibit proliferation of SIRT3 KO cells. Thus, we explored the link between SIRT3 and glutamine metabolism. Our study showed that loss of SIRT3 increased cellular consumption of glutamine. Interestingly, though glutamine can contribute to numerous metabolic pathways, loss of SIRT3 promotes glutamine use in nucleotide biosynthesis.
The enhanced use of glutamine for nucleotide biosynthesis appears to be mediated at least in part through activation of mTORC1. mTORC1 is a major regulator of purine and pyrimidine biosynthesis through post-translational and transcriptional mechanisms (Ben-Sahra and Manning, 2017). mTORC1 integrates the information of cellular nutrient availability to induce cell growth and proliferation (Saxton and Sabatini, 2017). Interfering with mTORC1 activation blocks the proliferative advantage of SIRT3 KO MEFs in our study. However, how SIRT3 function in mitochondria leads to changes in mTORC1 activity remains to be determined. It is possible that SIRT3 can modulate mTORC1 activity through regulation of amino acid metabolism itself, as mTORC1 is sensitive to amino acid abundance (Wolfson and Sabatini, 2017). SIRT3 can directly deacetylate and modulate activity of enzymes involved in amino acid metabolism (van de Ven et al., 2017). We find that many amino acids are downregulated intracellularly in SIRT3 KO MEFs, which may be indicative of higher consumption. Indeed, glutamine, which is taken up more in SIRT3 KO MEFs, is also reduced intracellularly. Alternatively, SIRT3 was shown to induce AMPK, which is a negative regulator of mTORC1. Numerous mechanisms have been proposed for SIRT3 regulation of AMPK, including SIRT3 deacetylation and activation of LKB1, a kinase that activates AMPK through direct phosphorylation (Pillai et al., 2010; Shackelford and Shaw, 2009). A recent study found that mTORC1 is inhibited by depletion of purines, which introduces a possibility that SIRT3 regulates mTORC1 through inhibition of nucleotide synthesis (Hoxhaj et al., 2017). Finally, in response to decreased amino acid levels, SIRT3 could inhibit mTORC1 by decreasing leucylation from the lysine in RagA (He et al., 2018). Thus, SIRT3 can regulate several signaling pathways that lead to the reprograming of cellular metabolism.
Previous studies have shown that SIRT3 loss results in rewiring of glucose metabolism to promote tumorigenesis, and its overexpression represses breast cancer cell growth in part by suppressing the Warburg effect (Bell et al., 2011; Finley et al., 2011; Kim et al., 2010). Here, we find that overexpression of SIRT3 in a basal-like breast cancer xenograft model suppresses growth and mTORC1 signaling. Repression of mTORC1 signaling and nucleotide synthesis may be an additional mechanism by which SIRT3 suppresses tumor growth.
In summary, we used a small-molecule screen to identify metabolic vulnerabilities of cells lacking SIRT3. We uncovered a previously uncharacterized regulation of nucleotide biosynthesis by SIRT3 via repression of glutamine flux into this pathway. How SIRT3 preferentially suppresses this node of metabolism is an important mechanistic question for future studies, particularly in the context of metabolic diseases such as breast cancer, where SIRT3 expression is lost or reduced.
Experimental Procedures
Cell Culture
MEFs were isolated from SIRT3 WT and KO littermate embryos as described (Xu, 2005) and immortalized using the SV40 large T antigen. Immortalized SIRT3 WT and KO MEFs were cultured in DMEM media supplemented with 10% fetal bovine serum (FBS), penicillin/streptomycin, 2 mM L-glutamine, non-essential amino acids, and 0.1 mM β-mercaptoethanol. MCF10A cells were cultured in 1:1 DMEM/F12 media supplemented with penicillin/streptomycin, 5% horse serum, 20 ng/mL EGF, 100 ng/mL cholera toxin, 0.5 mg/mL hydrocortisone, and 10 μg/mL insulin. MDA-MB-231 were maintained in DMEM media supplemented with 10% FBS and penicillin/streptomycin.
Small-Molecule Screen
High-throughput screening was performed at the ICCB Longwood Screening Facility at Harvard Medical School. The Known Biactives Collection libraries were used for the screening. Subconfluent SIRT3 WT and KO immortalized MEFs were trypsinized, counted, and plated at the density of 550/30 μl/well for WT MEFs and 400/30 μl/well for KO MEFs in a 384-well format. One hundred nanoliters of each compound was pin-transferred to each assay plate. For every compound library plate, there were four daughter plates (two replicates for each of the two genotypes). Cells were incubated at 37°C in 5% CO2 for 48 hr post-pin transfer, and plates were removed from the incubator and equilibrated to room temperature. CellTiter Glo (Promega) was added to each well, and luminescence was quantitated using a PerkinElmer EnVision. Luminescence values were normalized to the average of negative controls (non-treated cells) to determine normalized percentage survival.
Metabolite Profiling
Metabolites were extracted from cells in 80% ice-cold methanol on dry ice, and metabolite profiles were obtained as previously described (Ben-Sahra et al., 2013; Finley et al., 2011). For detailed information, see Supplemental Experimental Procedures.
RNA Sequencing
RNA was extracted from immortalized WT and SIRT3 KO MEFs as described. Library preparation and RNA sequencing was performed as previously described (Green et al., 2016). For detailed information, see Supplemental Experimental Procedures.
Animal Studies
All animal studies were performed in accordance with protocols approved by the Institutional Animal Care and Use Committee, the Standing Committee on Animals at Harvard. For xenograft studies, 2 × 10⁶ MDA-MB-231 cells were mixed with 1:1 Hank's balanced salt solution (HBSS)/Matrigel (354234; Corning) and injected subcutaneously into the flanks of 8- to 10-week-old female nude mice (Jackson Labs). Control cells were injected into the left flank and SIRT3-overexpressing cells were injected into the right flank of the same mouse. Tumors were measured every 2–3 days as indicated, and tumors were dissected and weighed at the end of the experiment. Tumor volume was calculated using the formula V = (w2 × I)/2, where w represents width and l represents length.
Statistics
Statistical significance between groups was determined using the unpaired Student's t test (unless otherwise noted). Significance is reported as follows: *p ≤ 0.05, **p ≤ 0.01, ***p ≤ 0.001, and ****p ≤ 0.0001. All experiments were performed at least two to three times. The replicates are biological.
Data and Software Availability
The accession number for the RNA sequencing (RNA-seq) data reported in this paper is GEO: GSE109279.
Supplementary Material
Highlights.
A small-molecule screen identifies inhibitors of SIRT3 knockout cell proliferation
SIRT3 knockout cells are dependent on glutamine for proliferation
Loss of SIRT3 results in mTORC1-mediated glutamine incorporation into nucleotides
SIRT3 suppresses mTORC1 signaling and growth in an in vivo breast cancer model
Acknowledgments
We thank members of the Brugge, Toker, Manning, and Haigis lab for technical assistance, helpful discussion, and critical reading of this manuscript. M.C.H. is supported by NIH grant R01DK103295 from the National Institute of Diabetes and Digestive and Kidney Diseases (NIDDK), grant R01CA213062 from the National Cancer Institute (NCI), the Ludwig Center at Harvard, the Glenn Foundation for Medical Research, and Takeda Pharmaceutical Company Limited, award number A19659. K.N.G.H. was supported by an NIH pre-doctoral training fellowship, award number F31CA183575, and by The Paul & Daisy Soros Fellowship for New Americans. E.Z. was supported by a postdoctoral fellowship from the American Heart Association (15POST25560077).
Footnotes
Supplemental Information: Supplemental Information includes Supplemental Experimental Procedures, three figures, and two tables and can be found with this article online at https://doi.org/10.1016/j.celrep.2018.01.076.
Author Contributions: K.N.G.H. and E.Z. designed and performed experiments, analyzed the data, and wrote the manuscript. J.B.S., H.Y., F.K.S., and S.M. assisted with experiments. Y.I. designed and performed the screen. J.B.S., A.S. and C.B.C. performed and analyzed metabolomics. J.-R.L. under the supervision of P.K.S. performed and analyzed xenograft signaling. J.M.G. and C.C.B. under the supervision of J.G.S. performed and assisted with RNA-seq analysis. A.R. analyzed RNA-seq. M.C.H. supervised the project and assisted with writing the manuscript.
Declaration of Interests: The authors declare no competing interests.
References
- Ahluwalia GS, Grem JL, Hao Z, Cooney DA. Metabolism and action of amino acid analog anti-cancer agents. Pharmacol Ther. 1990;46:243–271. doi: 10.1016/0163-7258(90)90094-i. [DOI] [PubMed] [Google Scholar]
- Bell EL, Emerling BM, Ricoult SJ, Guarente L. SirT3 suppresses hypoxia inducible factor 1a and tumor growth by inhibiting mitochondrial ROS production. Oncogene. 2011;30:2986–2996. doi: 10.1038/onc.2011.37. [DOI] [PMC free article] [PubMed] [Google Scholar]
- Ben-Sahra I, Manning BD. mTORC1 signaling and the metabolic control of cell growth. Curr Opin Cell Biol. 2017;45:72–82. doi: 10.1016/j.ceb.2017.02.012. [DOI] [PMC free article] [PubMed] [Google Scholar]
- Ben-Sahra I, Howell JJ, Asara JM, Manning BD. Stimulation of de novo pyrimidine synthesis by growth signaling through mTOR and S6K1. Science. 2013;339:1323–1328. doi: 10.1126/science.1228792. [DOI] [PMC free article] [PubMed] [Google Scholar]
- Ben-Sahra I, Hoxhaj G, Ricoult SJH, Asara JM, Manning BD. mTORC1 induces purine synthesis through control of the mitochondrial tetrahydrofolate cycle. Science. 2016;351:728–733. doi: 10.1126/science.aad0489. [DOI] [PMC free article] [PubMed] [Google Scholar]
- Cluntun AA, Lukey MJ, Cerione RA, Locasale JW. Glutamine metabolism in cancer: understanding the heterogeneity. Trends Cancer. 2017;3:169–180. doi: 10.1016/j.trecan.2017.01.005. [DOI] [PMC free article] [PubMed] [Google Scholar]
- Csibi A, Fendt SM, Li C, Poulogiannis G, Choo AY, Chapski DJ, Jeong SM, Dempsey JM, Parkhitko A, Morrison T, et al. The mTORC1 pathway stimulates glutamine metabolism and cell proliferation by repressing SIRT4. Cell. 2013;153:840–854. doi: 10.1016/j.cell.2013.04.023. [DOI] [PMC free article] [PubMed] [Google Scholar]
- Düuvel K, Yecies JL, Menon S, Raman P, Lipovsky AI, Souza AL, Triantafellow E, Ma Q, Gorski R, Cleaver S, et al. Activation of a metabolic gene regulatory network downstream of mTOR complex 1. Mol Cell. 2010;39:171–183. doi: 10.1016/j.molcel.2010.06.022. [DOI] [PMC free article] [PubMed] [Google Scholar]
- Finley LW, Carracedo A, Lee J, Souza A, Egia A, Zhang J, Teruya-Feldstein J, Moreira PI, Cardoso SM, Clish CB, et al. SIRT3 opposes reprogramming of cancer cell metabolism through HIF1α destabilization. Cancer Cell. 2011;19:416–428. doi: 10.1016/j.ccr.2011.02.014. [DOI] [PMC free article] [PubMed] [Google Scholar]
- Green EM, Wakimoto H, Anderson RL, Evanchik MJ, Gorham JM, Harrison BC, Henze M, Kawas R, Oslob JD, Rodriguez HM, et al. A small-molecule inhibitor of sarcomere contractility suppresses hypertrophic cardiomyopathy in mice. Science. 2016;351:617–621. doi: 10.1126/science.aad3456. [DOI] [PMC free article] [PubMed] [Google Scholar]
- He XD, Gong W, Zhang JN, Nie J, Yao CF, Guo FS, Lin Y, Wu XH, Li F, Li J, et al. Sensing and transmitting intracellular amino acid signals through reversible lysine aminoacylations. Cell Metab. 2018;27:151–166.e6. doi: 10.1016/j.cmet.2017.10.015. [DOI] [PubMed] [Google Scholar]
- Hoxhaj G, Hughes-Hallett J, Timson RC, Ilagan E, Yuan M, Asara JM, Ben-Sahra I, Manning BD. The mTORC1 signaling network senses changes in cellular purine nucleotide levels. Cell Rep. 2017;21:1331–1346. doi: 10.1016/j.celrep.2017.10.029. [DOI] [PMC free article] [PubMed] [Google Scholar]
- Kim HS, Patel K, Muldoon-Jacobs K, Bisht KS, Aykin-Burns N, Pennington JD, van der Meer R, Nguyen P, Savage J, Owens KM, et al. SIRT3 is a mitochondria-localized tumor suppressor required for maintenance of mitochondrial integrity and metabolism during stress. Cancer Cell. 2010;17:41–52. doi: 10.1016/j.ccr.2009.11.023. [DOI] [PMC free article] [PubMed] [Google Scholar]
- Love MI, Huber W, Anders S. Moderated estimation of fold change and dispersion for RNA-seq data with DESeq2. Genome Biol. 2014;15:550. doi: 10.1186/s13059-014-0550-8. [DOI] [PMC free article] [PubMed] [Google Scholar]
- Masson N, Willam C, Maxwell PH, Pugh CW, Ratcliffe PJ. Independent function of two destruction domains in hypoxia-inducible factor-alpha chains activated by prolyl hydroxylation. EMBO J. 2001;20:5197–5206. doi: 10.1093/emboj/20.18.5197. [DOI] [PMC free article] [PubMed] [Google Scholar]
- Metzler B, Gfeller P, Guinet E. Restricting glutamine or glutamine-dependent purine and pyrimidine syntheses promotes human T cells with high FOXP3 expression and regulatory properties. J Immunol. 2016;196:3618–3630. doi: 10.4049/jimmunol.1501756. [DOI] [PubMed] [Google Scholar]
- Mootha VK, Handschin C, Arlow D, Xie X, St Pierre J, Sihag S, Yang W, Altshuler D, Puigserver P, Patterson N, et al. Erralpha and Gabpa/b specify PGC-1alpha-dependent oxidative phosphorylation gene expression that is altered in diabetic muscle. Proc Natl Acad Sci U S A. 2004;101:6570–6575. doi: 10.1073/pnas.0401401101. [DOI] [PMC free article] [PubMed] [Google Scholar]
- Pillai VB, Sundaresan NR, Kim G, Gupta M, Rajamohan SB, Pillai JB, Samant S, Ravindra PV, Isbatan A, Gupta MP. Exogenous NAD blocks cardiac hypertrophic response via activation of the SIRT3-LKB1-AMP-activated kinase pathway. J Biol Chem. 2010;285:3133–3144. doi: 10.1074/jbc.M109.077271. [DOI] [PMC free article] [PubMed] [Google Scholar]
- Qiu X, Brown K, Hirschey MD, Verdin E, Chen D. Calorie restriction reduces oxidative stress by SIRT3-mediated SOD2 activation. Cell Metab. 2010;12:662–667. doi: 10.1016/j.cmet.2010.11.015. [DOI] [PubMed] [Google Scholar]
- Saxton RA, Sabatini DM. mTOR signaling in growth, metabolism, and disease. Cell. 2017;168:960–976. doi: 10.1016/j.cell.2017.02.004. [DOI] [PMC free article] [PubMed] [Google Scholar]
- Shackelford DB, Shaw RJ. The LKB1-AMPK pathway: metabolism and growth control in tumour suppression. Nat Rev Cancer. 2009;9:563–575. doi: 10.1038/nrc2676. [DOI] [PMC free article] [PubMed] [Google Scholar]
- Sundaresan NR, Gupta M, Kim G, Rajamohan SB, Isbatan A, Gupta MP. Sirt3 blocks the cardiac hypertrophic response by augmenting Foxo3a-dependent antioxidant defense mechanisms in mice. J Clin Invest. 2009;119:2758–2771. doi: 10.1172/JCI39162. [DOI] [PMC free article] [PubMed] [Google Scholar]
- van de Ven RAH, Santos D, Haigis MC. Mitochondrial sirtuins and molecular mechanisms of aging. Trends Mol Med. 2017;23:320–331. doi: 10.1016/j.molmed.2017.02.005. [DOI] [PMC free article] [PubMed] [Google Scholar]
- Wise DR, DeBerardinis RJ, Mancuso A, Sayed N, Zhang XY, Pfeiffer HK, Nissim I, Daikhin E, Yudkoff M, McMahon SB, Thompson CB. Myc regulates a transcriptional program that stimulates mitochondrial glutaminolysis and leads to glutamine addiction. Proc Natl Acad Sci U S A. 2008;105:18782–18787. doi: 10.1073/pnas.0810199105. [DOI] [PMC free article] [PubMed] [Google Scholar]
- Wolfson RL, Sabatini DM. The Dawn of the Age of Amino Acid Sensors for the mTORC1 Pathway. Cell Metab. 2017;26:301–309. doi: 10.1016/j.cmet.2017.07.001. [DOI] [PMC free article] [PubMed] [Google Scholar]
- Xu J. Preparation, culture, and immortalization of mouse embryonic fibroblasts. Curr Protoc Mol Biol. 2005;Chapter 28 doi: 10.1002/0471142727.mb2801s70. Unit 28.1. [DOI] [PubMed] [Google Scholar]
- Yang W, Nagasawa K, Munch C, Xu Y, Satterstrom K, Jeong S, Hayes SD, Jedrychowski MP, Vyas FS, Zaganjor E, et al. Mitochondrial sirtuin network reveals dynamic SIRT3-dependent deacetylation in response to membrane depolarization. Cell. 2016;167:985–1000.e21. doi: 10.1016/j.cell.2016.10.016. [DOI] [PMC free article] [PubMed] [Google Scholar]
- Yu W, Dittenhafer-Reed KE, Denu JM. SIRT3 protein deacetylates isocitrate dehydrogenase 2 (IDH2) and regulates mitochondrial redox status. J Biol Chem. 2012;287:14078–14086. doi: 10.1074/jbc.M112.355206. [DOI] [PMC free article] [PubMed] [Google Scholar]
Associated Data
This section collects any data citations, data availability statements, or supplementary materials included in this article.