

Abstract
Objective
The aim of this retrospective study was to determine the gadolinium (Gd) concentration in different brain areas in a pig cohort that received repeated administration of Gd-based contrast agents (GBCAs) at standard doses over several years, comparable with a clinical setting.
Material and Methods
Brain tissue was collected from 13 Göttingen mini pigs that had received repeated intravenous injections of gadopentetate dimeglumine (Gd-DTPA; Magnevist) and/or gadobutrol (Gadovist). The animals have been included in several preclinical imaging studies since 2008 and received cumulative Gd doses ranging from 7 to 129 mmol per animal over an extended period. Two animals with no history of administration of GBCA were included as controls. Brain autopsies were performed not earlier than 8 and not later than 38 months after the last GBCA application. Tissues from multiple brain areas including cerebellar and cerebral deep nuclei, cerebellar and cerebral cortex, and pons were analyzed for Gd using inductively coupled plasma mass spectrometry.
Results
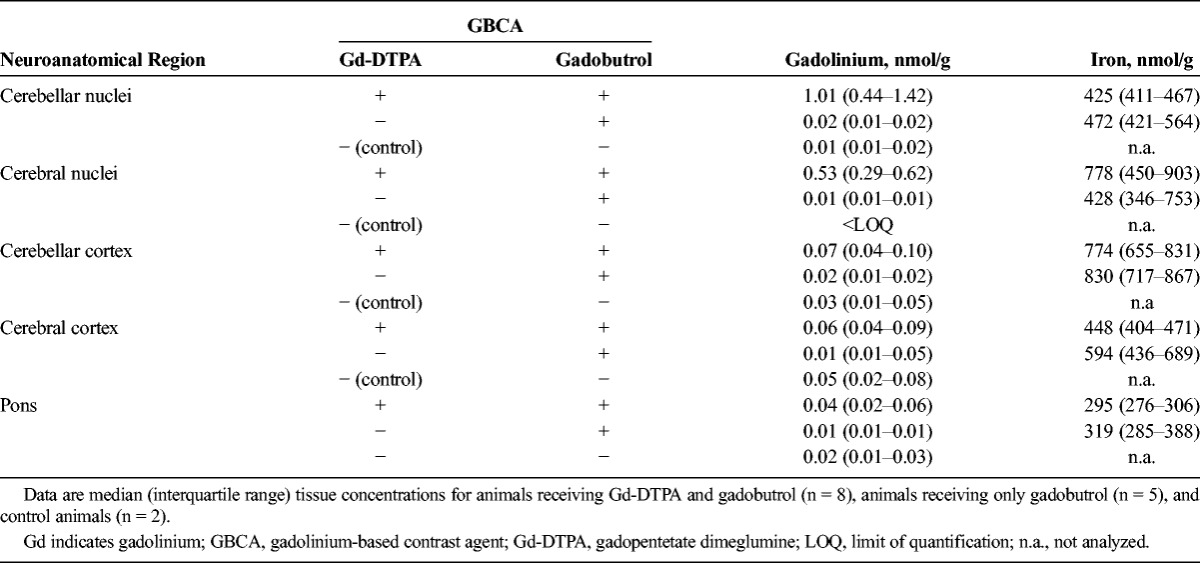
Of the 13 animals, 8 received up to 48 injections of gadobutrol and Gd-DTPA and 5 received up to 29 injections of gadobutrol only. In animals that had received both Gd-DTPA and gadobutrol, a median (interquartile range) Gd concentration of 1.0 nmol/g tissue (0.44-1.42) was measured in the cerebellar nuclei and 0.53 nmol/g (0.29-0.62) in the globus pallidus. The Gd concentration in these areas in gadobutrol-only animals was 50-fold lower with median concentrations of 0.02 nmol/g (0.01-0.02) for cerebellar nuclei and 0.01 nmol/g (0.01-0.01) for globus pallidus and was comparable with control animals with no GBCA history. Accordingly, in animals that received both GBCAs, the amount of residual Gd correlated with the administered dose of Gd-DTPA (P ≤ 0.002) but not with the total Gd dose, consisting of Gd-DTPA and gadobutrol. The Gd concentration in cortical tissue and in the pons was very low (≤0.07 nmol/g tissue) in all animals analyzed.
Conclusion
Multiple exposure to macrocyclic gadobutrol is not associated with Gd deposition in brain tissue of healthy pigs. A single additional administration of linear Gd-DTPA is sufficient for Gd accumulation in the nucleus dentatus and globus pallidus, underlining the importance of obtaining a complete GBCA history in clinical studies.
Key Words: gadolinium-based contrast agents, gadobutrol, Gd-DTPA, gadolinium brain retention
Since their market approval in the late 1980s, gadolinium-based contrast agents (GBCAs) have improved diagnostic magnetic resonance imaging (MRI) and are routinely used by radiologists worldwide. In 2014, the discovery of a relationship between high MRI signal intensities in specific brain regions and previous gadolinium (Gd) administration1 raised major concerns about the safety of the clinical use of these contrast agents and led to a large number of subsequent clinical and preclinical investigations of this phenomenon (as reviewed in Gulani et al2).
Multiple retrospective studies in patients with central nervous system pathologies reported hyperintensities in T1-weighted images in the dentate nucleus (DN) and globus pallidus (GP), confirming the original finding by Kanda et al.1 These studies additionally provided cumulative evidence that this signal increase depends on the chelate type of GBCAs.3–19 Based on the chemical structure of the ligand, the Gd ion is either chelated by a linear ligand or caged into a macrocyclic complex, which has superior stability under physiological conditions.20,21 In most clinical studies, signal increases were reported after multiple administrations of linear but not macrocyclic GBCAs, in line with the different stabilities of the contrast agents. A few studies have reported increased signal intensities in the brain after the use of macrocyclic agents,22–24 but 2 of these studies (by Stojanov et al24 and Rossi Espagnet et al23) have been questioned because of their potential methodological limitations.25–27
These imaging studies are indicative of Gd retention, but direct and quantitative Gd measurements are needed to definitively determine Gd presence and exclude other disease-related pathologies associated with T1 hyperintensities.28,29 However, compared with the large number of MRI studies, only few studies are available in which Gd was analyzed in human brain samples obtained by autopsy from small groups of patients.7,30–34 In line with the observed MRI phenotype, these studies provided evidence for the presence of Gd in deceased patients after administration of specific GBCAs. Yet, given the small sample size of these studies, no general conclusions could be drawn for all GBCA types.
Although there are few analyses performed in humans due to the lack of human brain specimens for analysis, major progress has been made to elucidate GBCA-mediated Gd retention in rodent studies. These preclinical studies confirmed the clinical observations of T1 hyperintensities after multiple administrations of multipurpose linear but not macrocyclic GBCA.35–37 Elemental analysis of rat brain homogenates revealed significantly higher amounts of Gd after repeated administration of linear GBCA compared with macrocyclic agents.36–41 An advantage to using rodents is that the studies can be highly standardized and tightly controlled, and therefore, the results are generally highly reproducible. However, other mammals may serve as more appropriate model systems for comparison with brain processes in human patients. When comparing brain anatomy, growth, and development, the human brain is more similar to the pig brain than to the rodent brain.42 Also, the larger size of pigs' brains facilitates the identification and isolation of different neuroanatomical areas.
The aim of the present study was to retrospectively evaluate Gd concentration after repeated administration of linear and macrocyclic GBCAs in the brains of a heterogeneous cohort of pigs. These healthy pigs underwent various preclinical studies over several years. This heterogeneity within the pig cohort closely resembles the heterogeneity among patients in retrospective patient studies on GBCA-induced brain retention.
MATERIAL AND METHODS
Study Design and Population
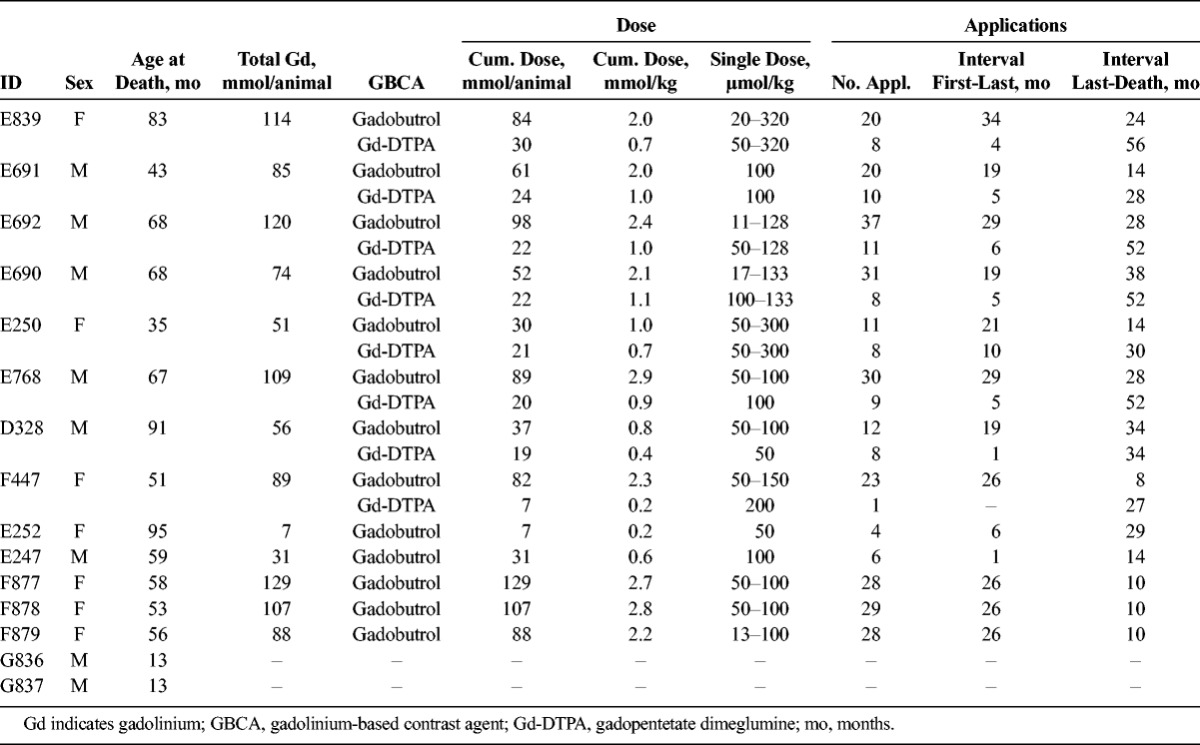
This retrospective analysis was conducted on a total of 15 healthy Göttingen mini pigs, 13 (7 female, 6 male) with a history of preclinical studies in contrast media research. Two control animals with no record of GBCA administration were included as controls. The 13 treated animals had been included in several preclinical studies between 2008 and 2016 and had received multiple doses of GBCAs. Contrast agents were administered under anesthesia and used as supplied from the manufacturer: gadopentetate dimeglumine (Gd-DTPA, Magnevist; Bayer Vital GmbH, Leverkusen, Germany) and gadobutrol (Gadovist; Bayer). Application details are summarized in Table 1. After anesthesia including endotracheal intubation, the animals received short-term aftercare with anti-inflammatory and antibiotic medication. The animals did not undergo any surgery during lifetime, with the exception of early castration for male animals. Unrelated to the GBCA studies, most animals additionally participated in computed tomography studies and received iodinated X-ray contrast agents. Furthermore, the animals were occasionally put under short-term anesthesia for the maintenance of claws and teeth. Four of the animals were used in a non–contrast agent–related pharmacokinetic study as a final experiment before autopsy. Time of autopsy was at least 8 months after the last administration of GBCA. The regulations of the German Animal Protection Law were followed in all animal studies. Gadolinium analysis was performed in a blinded fashion.
TABLE 1.
Characteristics of the Study Population
Tissue Processing
Whole brain specimens were removed at autopsy and either shock-frozen in isopentane/dry ice and stored at −80°C or processed directly. Brains were divided into cerebrum, cerebellum, and pons and sagittal sectioned into approximately 5 mm slices. Tissue samples were obtained from 5 different neuroanatomical regions according to the stereotaxic atlas of the pig brain43: cerebral and cerebellar cortex (sampling from 3 different cortical areas each), cerebral basal nuclei including GP, cerebellar nuclei including DN, and pons (Fig. 1).
FIGURE 1.
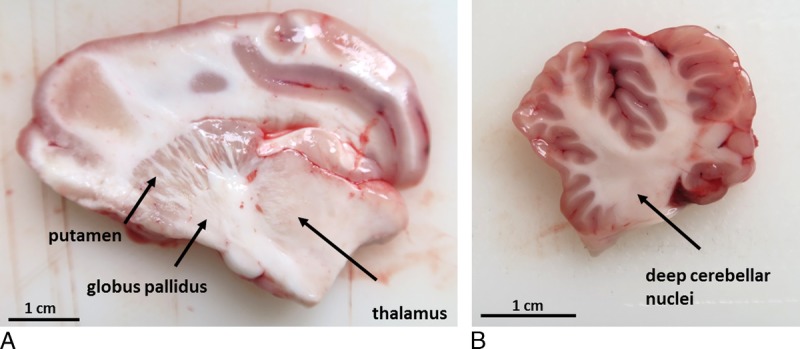
Anatomy of the porcine brain: Sagittal sections from pig postmortem brains without chemical fixation are shown with the indicated neuroanatomical structures (arrows) of the cerebrum (A) and cerebellum (B).
Elemental Analysis
Briefly, tissue samples were manually homogenized as described previously,41 and aliquots (n = 3) of 20 mg were mixed with terbium and cobalt nitrate (5 nmol/L final concentration each) as internal standards. The samples were dried at 95°C and were then solubilized by adding 50 μL concentrated nitric acid and 30 μL hydrogen peroxide, followed by pressurized digestion at 120°C in a microwave oven. The clear solutions were diluted with 1% nitric acid containing 0.01% Triton-X100. The Gd and iron concentrations were determined by inductively coupled plasma mass spectrometry (ICP-MS, 7900, Agilent, Waldbronn, Germany). The measured Gd concentrations were converted to tissue concentrations (nmol/g wet tissue). The lower limit of quantification (LOQ) was 0.005 nmol Gd/g tissue and 0.2 nmol Fe/g tissue.
RESULTS
Pig Cohort
Fifteen animals (13 of which have been used in multiple preclinical GBCA studies between 2008 and 2016, as well as 2 controls) were included in this retrospective study. The characteristics of these animals are listed in Table 1.
Eight of the animals received both linear Gd-DTPA and macrocyclic gadobutrol and 5 animals were administered only with macrocyclic gadobutrol during the preclinical studies. Other characteristics including single doses, cumulative dose, number of applications, time period between first and last application, as well as time interval between last administration and death displayed a high variance comparable to clinical studies. Single doses ranged from 11 to 320 μmol/kg weight. In pigs, after adjusting for body surface area, a GBCA dose of 110 μmol/kg is equivalent to the standard human dose of 100 μmol/kg.44 The total cumulative Gd dose ranged from 7 to 129 mmol per animal. It is important to note that the cumulative doses of gadobutrol were substantially higher than those of Gd-DTPA, which were between 7 and 30 mmol per animal. The animals had received at least 4 and no more than 48 injections of GBCAs. The retrospective study aimed to investigate long-term retention of Gd in the brain; therefore, the earliest time point of analysis was 8 months after the last application and ranged up to 3 years with no GBCA administration. In clinical studies, the time interval between the last GBCA injection and death of the patient is highly variable and ranges from days to years.7,30,31,33
Gadolinium Retention in Specific Neuroanatomical Regions
The Gd concentrations were measured in the cerebellar and cerebral cortex, in the deep nuclei and in the pons. Tissue from the cerebellar and cerebral cortex and pons showed the lowest Gd concentration among the brain regions analyzed. The amount of Gd was below 0.2 nmol/g tissue in all animals analyzed (Fig. 2 and Table 2). The pons and cortices from animals that have received only gadobutrol contained lower amounts of Gd than did animals that received both contrast agents. Most of these animals had concentrations of 0.02 nmol Gd/g tissue or less close to the LOQ (0.005 nmol Gd/g tissue). The amount of Gd present in the gadobutrol-only animals was indistinguishable from control animals, which exhibited similar Gd traces albeit having no history of GBCA administration.
FIGURE 2.
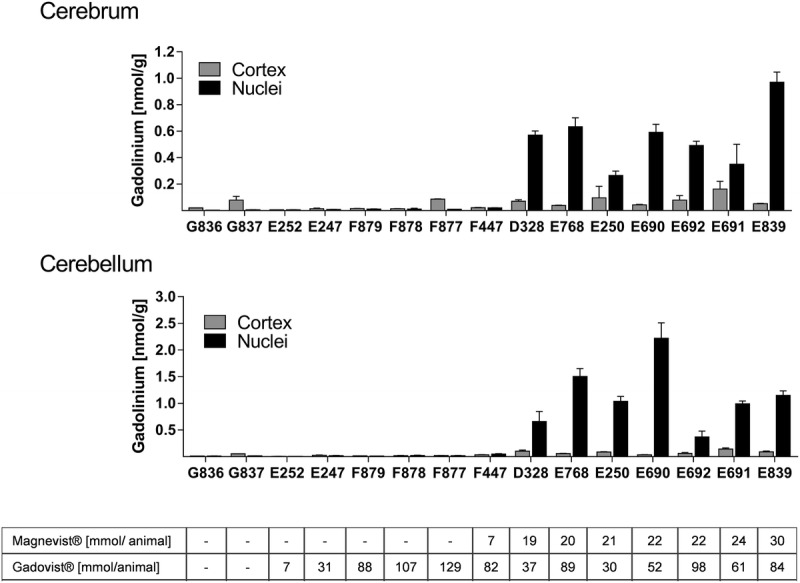
Gd tissue concentration (in nmol/g tissue) in different neuroanatomical regions. Bars represent individual animals with n = 3 technical replicates. The GBCA cumulative dose (in mmol Gd/animal) for each animal is displayed below the bars.
TABLE 2.
Concentrations for Gd and Iron in Pig Brain Tissue
All animals that received only gadobutrol had equally low Gd concentrations in the deep brain nuclei. As in the cortices, the concentration of Gd was 0.02 nmol Gd/g or less in the cerebellar nuclei and 0.01 nmol Gd/g or less in the GP nuclei region. In control animals, the amount of Gd present in the nuclei appeared to be lower than the concentration in the cortices. Measured concentrations were 0.01 nmol Gd/g or less in the cerebellar nuclei and below the LOQ in the GP nuclei region.
Importantly, a single administration of linear Gd-DTPA resulted in Gd concentrations above the median Gd concentration observed for gadobutrol animals. Animal F447, which had received 1 injection of Gd-DTPA (7 mmol) and 23 injections of gadobutrol (cumulative dose: 82 mmol) exhibited a 2-fold higher Gd concentration (0.048 nmol Gd/g tissue in cerebellar nuclei and 0.02 nmol/g tissue in the GP) compared with animals F877 to F879, which had received comparable or even higher amounts of gadobutrol (>28 injections, cumulative dose >88 mmol).
In all animals that additionally received Gd-DTPA, the Gd concentration in the investigated nuclei was consistently higher than in the gadobutrol only group (Fig. 2 and Table 2). The amount of Gd was generally higher in the cerebellar nuclei compared with the cerebral GP (nuclei) region. In animals receiving both Gd-DTPA and gadobutrol, a maximum Gd concentration of 2.2 nmol/g tissue (median, 1.01 nmol/g) was detected in the nuclei of the cerebellum, and 0.97 nmol/g tissue (median, 0.53 nmol/g), in the GP.
There was a strong positive correlation observed between Gd concentration in the GP and the cumulative dose of linear Gd-DTPA (r = 0.90, P < 0.0001). This is in contrast to the total GBCA dose, where no correlation was observed (r = 0.29, P = 0.3269). This provides further evidence that Gd deposition originates from linear contrast agents (Fig. 3A). A similar correlation was observed for the cerebellar nuclei (Fig. 3B). At time points greater than 8 months after the last GBCA administration, there was no evidence of a continuous clearance of the retained Gd in animals that additionally received linear Gd-DTPA. Both the period in which the cumulative dose was administered and the time interval between the last GBCA exposition and autopsy did not negatively correlate to the measured Gd concentration (data not shown). For example, the Gd deposition in animal D328, which received a cumulative dose Gd-DTPA of 19 mmol within 4 weeks, was similar to that of animal E250, which received a comparable dose (21 mmol) over a time period of 10 months. The number of applications (8) and time period between last application and death (34 and 30 months) were similar in these 2 animals.
FIGURE 3.
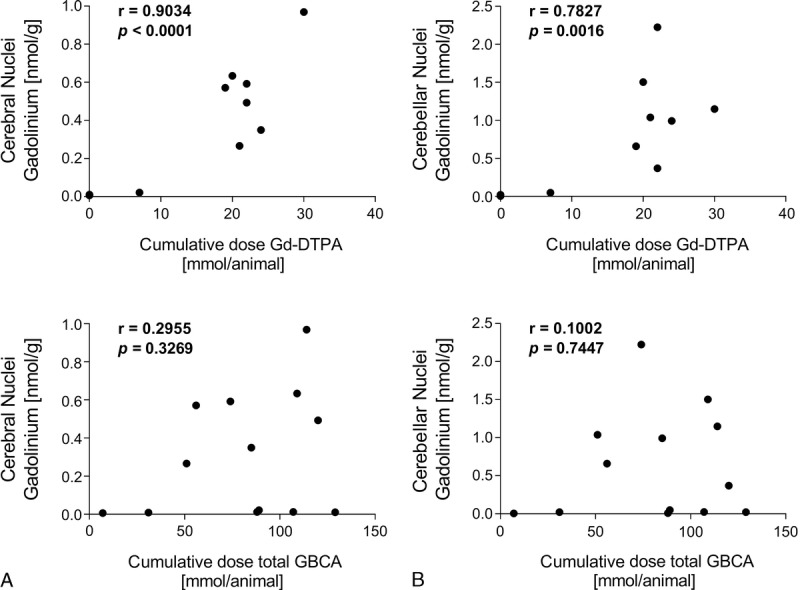
The association between gadolinium tissue concentration and the cumulative dose of linear GBCA or of total GBCA dose is shown with Pearson correlation coefficient (r) and the associated P value. A, Cerebral nuclei (Globus Pallidus). B, Cerebellar nuclei.
In comparison with Gd, we analyzed iron as a physiological metal in the brain. The median iron concentration in the cerebellum and cerebrum was between 425 and 830 nmol/g tissue, and the pons contained around 300 nmol/g tissue (Table 2).
DISCUSSION
For the past several years, there has been increasing evidence of persistent magnetic resonance (MR) signal hyperintensity in specific brain regions after multiple administrations of GBCAs, triggering several investigations on the safety of these contrast agents. Most clinical studies3–19 reported that MR signal hyperintensity is only associated with the application of linear agents. However, MRI studies are indirect measures, and direct quantitative Gd determination in tissue is needed to verify that Gd is retained in organs such as the brain. Apart from the brain, Gd has been detected in bone, liver, and skin, indicating that Gd retention can occur throughout the whole body.31,45–48 Because of the limited availability of human brain specimens, much information on Gd retention in the brain has been acquired from rodent studies. The preclinical studies performed in rats36–41 provided cumulative evidence for Gd presence in the brain after GBCA administration and support that Gd deposition is largely restricted to linear agents with minor Gd retention observed for macrocyclic GBCAs.
Although these rodent studies have been extremely valuable as mechanistic studies, they were carried out in inbred young animals under highly standardized experimental conditions. In addition, GBCAs in rodent studies are often administered repeatedly with high doses over a relatively short time. These conditions help to control outcome variability but do not reflect typical clinical settings. Major heterogeneities in clinical cohorts of patients receiving GBCA concern sex, age, dosage, and number of and time between applications. Therefore, this retrospective study was carried out in a heterogeneous pig cohort for closer comparison with clinical cohorts. The pig cohort included a group of animals that received multiple doses of both linear Gd-DTPA and macrocyclic gadobutrol and a group that received gadobutrol only.
The neuroanatomy of the porcine brain has inherently greater similarity to the human brain than that of laboratory rodents. Among other differences, the pig cortical surface is gyrencephalic (folded) similar to humans, whereas rat brains are lissencephalic (smooth).49
Furthermore, the use of a larger animal species permitted the isolation and differential analysis of specific neuroanatomical regions.
In this study, distinct Gd accumulation was observed in the deep cerebellar nuclei and the GP nuclei, but the accumulation was restricted to animals that received linear Gd-DTPA. In animals that received only gadobutrol, the median Gd tissue concentration in the nuclei was 50 times lower than in animals that also received Gd-DTPA and was close to the LOQ. The Gd accumulation was correlated only to Gd-DTPA dose and not to the total Gd dose, including macrocyclic gadobutrol. Remarkably, a single administration of linear Gd-DTPA sufficed to induce a marked increase in the Gd concentration in these areas. The results underline the necessity to obtain the complete history of all GBCA administrations in patients that are included in clinical studies, which, unfortunately, is often hard to achieve.
The dose-dependent accumulation of Gd with a linear GBCA is consistent with results from a clinical study by McDonald et al.7 The authors detected a median concentration of 6.6 μg/g (41.2 nmol/g) in the DN and 1.7 μg/g (10.7 nmol/g) in the GP of patients (n = 13) who received linear gadodiamide and reported that the Gd concentration correlated with the cumulative gadodiamide dose. Their cohort included patients with a cumulative dose greater than 200 mmol Gd, which exceeds the doses of linear Gd-DTPA administered in this preclinical study (≤30 mmol Gd corresponding to ≤27 mmol Gd equivalent human dose).
Recently, Murata et al31 published an autopsy analysis including a small sample size for macrocyclic gadoteridol (n = 5). They measured Gd concentrations between 0.005 μg/g (0.03 nmol/g) and 0.066 μg/g (0.42 nmol/g) in the GP and calculated a 20-fold lower Gd deposition rate following gadoteridol as compared to the published data on gadodiamide.31 The order of magnitude in the difference in Gd deposition between linear (gadodiamide) and macrocyclic (gadoteridol) GBCAs observed in humans is thus comparable to the difference observed for Gd-DTPA/gadobutrol versus gadobutrol alone in this pig study. Surprisingly, Murata et al. reported Gd concentrations of 0.19 μg/g (1.2 nmol/g) and 0.63 μg/g (3.94 nmol/g) from 2 gadobutrol patients, which is an at least 10-fold higher increase in Gd found in patients who received gadobutrol compared to gadoteridol patients. This is in contrast to our data and to a previously published preclinical rat study which showed a similar magnitude of Gd concentration between gadobutrol and gadoteridol after 8 weeks in whole brain homogenates and tissue slices using ICP-MS and LA-ICP-MS.41
It is crucial to identify potential confounding factors when assessing Gd tissue retention in patients. In the study by Murata et al, 1 of the 2 gadobutrol patients had received the last dose of gadobutrol only 5 days before death and as the authors stated possibly at a time point with multiple organ failure. The second gadobutrol patient had liver cirrhosis. The accumulation of manganese and other metals in the brain is often observed in patients with liver cirrhosis, suggesting alterations of neurophysiological pathways that have a potential impact on GBCA clearance.28,50,51 Finally, the authors could neither ascertain that this patient's glomerular filtration rate was not severely reduced nor completely exclude previous unknown GBCA administrations. Taken together, generalization of the findings in these 2 gadobutrol patients is not warranted.31
The potential clearance of Gd from the brain remains an important question for the safety of GBCA. Data from preclinical rodent studies provided evidence for partial clearance of Gd over time, but long-term studies are required to draw definite conclusions.38,39,52 In rodent models, Gd concentration was mostly measured at earlier time points because of the shorter life span of this species. After an 8-week Gd-free period, residual amounts of Gd were also detected for macrocyclic agents in the brain but were significantly lower than for linear agents.38,39,41 Both Frenzel et al38 and Kartamidhaja et al39 indicated superior clearance of brain Gd from macrocyclic agents, whereas the elimination of Gd from linear agents was limited. In the study by Frenzel et al,38 Gd from gadobutrol was reduced by ~70% between day 3 and 24 postinjection compared with less than 50% clearance of Gd-DTPA. More importantly, at day 3 the Gd species from gadobutrol-treated animals was predominantly present in a soluble fraction rendering it available for further excretion whereas a larger fraction of linear-derived Gd was found in an insoluble form or bound to macromolecules possibly impeding clearance from the brain. The soluble Gd species present in animals that received macrocyclic GBCA eluted identically as intact GBCA with no observation of a high molecular weight peak.
This retrospective pig study investigated long time retention (>8 months) after multiple nonuniform GBCA administrations in healthy animals with no underlying disease as a confounding factor. The amount of Gd found in animals that have received only gadobutrol was very low and comparable with the control animals supporting a continuous and nearly complete clearance of macrocylic agents. As rodent studies indicate a clearance of GBCA from the brain, the Gd-free period is a potential confounding factor in clinical studies. With striking differences in the clearance rates of GBCAs, details such as highly variable time periods—ranging from a few days to years7,30,31,33—between the last GBCA application and the MR study or death of a given patient must be thoroughly accounted for when it comes to data interpretation.
We were unable to identify a correlation between the Gd-free period and brain Gd concentrations in the group that received both gadobutrol and Gd-DTPA, but the small sample size and the high variability in the timing and dosage of treatment among the pigs could have masked weaker correlations. A recent study in rats has investigated the clearance of linear gadodiamide after 20 weeks and reported a brain clearance of approximately 50% at this time point.52 However, further long-term studies are needed to investigate whether linear type GBCA can be completely eliminated from the brain or if a certain fraction, presumably the insoluble form of Gd, is ultimately deposited in the tissue.
Cortical structures, which account for more than 80% of brain mass in humans,53 and the pons exhibited only very low Gd concentrations below 0.2 nmol/g. The difference between gadobutrol/Gd-DTPA and gadobutrol-only animals was less pronounced in these structures and similar Gd traces were also detected in control animals with no history of GBCA administration. Gadolinium quantities in tap water reported for Berlin, Germany,54–56 are one possible explanation for the trace amounts of Gd found in the brain samples. Increasing amounts of Gd in surface and tap water have been reported in several densely populated areas.57,58 We also point out that only 2 animals were included as controls and that the concentrations were very low and near the LOQ of the instrument. Interestingly, for control animals, the amount of Gd measured in the nuclei regions was at (cerebellum) or below (cerebrum) the LOQ.
Most studies in rats did not distinguish between cerebellar cortex and cerebellar nuclei because of the small size of the rat brain. A recent study by McDonald et al59 measured Gd in excised tissue of the DN but did not provide the Gd concentration in the cerebellar cortex for comparison. The rat study by Lohrke et al41 used spatial resolved laser ablation ICP-MS to analyze the Gd distribution within a tissue slice taken from the region of the DN that included cortical structures. They reported that a lower amount of Gd is also present in specific cortical structures (granular layer) of the cerebellum after administration of linear agents. An autopsy case report published by Roberts and colleagues34 similarly showed a high amount of Gd within the DN and lower but significant amounts in specific regions throughout the cerebellar cortex. In both the rat study and the single case report, analysis was performed at an earlier time point with less than 12 weeks after the last administration. With regard to the possibility of a continuous clearance mechanism, the time point has a potential influence on the brain distribution. In our study, we analyzed excised whole cortical tissue that included all substructures and did not provide a spatial resolution of the Gd distribution in the cerebellar cortex. Thus, we cannot exclude the presence of Gd-enriched substructures within the cerebellar cortex.
Transmetallation processes by endogenous ions, in particular iron, have been suggested and iron-binding proteins such as transferrin are potential macromolecular binding partners for Gd.60 However, further studies are needed to analyze Gd transmetallation and to identify possible binding partners. This study reports iron concentrations in the brain and thus provides information on the physiological environment that has to be taken into account when analyzing the extent of transmetallation. However, iron is not present as a free ion that would be required for transmetallation processes. In vivo iron is bound to high-affinity carrier proteins.
This study has limitations, and certain questions remain unanswered. First, the specific form of the measured Gd is unknown. The data do not distinguish between free ions, intact GBCA, or any other Gd species. Second, contrast agents were administered under anesthesia. This does not confound the differences between GBCAs observed in this study, but it might increase overall clearance from the brain. In rodents, it has been shown that natural sleep or anesthesia promotes the elimination of solutes from the central nervous system by increasing glymphatic influx and efflux.61,62 After the GBCA imaging experiment, the animals received an anti-inflammatory medication as a precaution to any intubation-induced injury. As inflammatory mediators can negatively influence blood brain barrier permeability (as reviewed in Varatharaj and Galea63), the short-term anti-inflammatory medication minimizes potential procedure-induced inflammation. Third, this study provides results from a limited number of subjects. It is possible that additional correlations have been missed because of the small sample size. Furthermore, the tissue from different brain regions has been excised manually after visual assessment. Nuclei regions were small and a certain degree of impurity due to the concurrent excision of some adjacent tissue cannot be excluded. We did not analyze the complete cerebral and cerebellar cortex. Cortices were analyzed by random sampling from 3 different cortical areas and thus are limited and may not fully represent this brain structure.
In conclusion, the results of this retrospective pig study confirm and contribute to the growing body of evidence that Gd retention in the brain is dependent on the type of contrast agent applied. Macrocyclic gadobutrol is not selectively retained in the brain tissue of a higher species. Gd accumulation is found only in the cerebellar nuclei and GP after administration of linear Gd-DTPA. The results of this study demonstrate that a relationship between cumulative dose and tissue accumulation existed only for linear GBCAs but not for macrocyclic GBCAs in pigs.
ACKNOWLEDGMENTS
We thank I. Krause, D. Hallmann, and C. Heyer for the exceptional technical assistance. We would also like to thank R. Ernst, PhD, as well as W. Melinat and S. Neumeyer from Bayer Pathology for the assistance and excellent support.
Footnotes
Conflicts of interest and sources of funding: none declared.
REFERENCES
- 1.Kanda T, Ishii K, Kawaguchi H, et al. High signal intensity in the dentate nucleus and globus pallidus on unenhanced T1-weighted MR images: relationship with increasing cumulative dose of a gadolinium-based contrast material. Radiology. 2014;270:834–841. [DOI] [PubMed] [Google Scholar]
- 2.Gulani V, Calamante F, Shellock FG, et al. Gadolinium deposition in the brain: summary of evidence and recommendations. Lancet Neurol. 2017;16:564–570. [DOI] [PubMed] [Google Scholar]
- 3.Adin ME, Kleinberg L, Vaidya D, et al. Hyperintense dentate nuclei on T1-weighted MRI: relation to repeat gadolinium administration. AJNR Am J Neuroradiol. 2015;36:1859–1865. [DOI] [PMC free article] [PubMed] [Google Scholar]
- 4.Cao Y, Huang DQ, Shih G, et al. Signal change in the dentate nucleus on T1-weighted MR images after multiple administrations of gadopentetate dimeglumine versus gadobutrol. AJR Am J Roentgenol. 2016;206:414–419. [DOI] [PubMed] [Google Scholar]
- 5.Errante Y, Cirimele V, Mallio CA, et al. Progressive increase of T1 signal intensity of the dentate nucleus on unenhanced magnetic resonance images is associated with cumulative doses of intravenously administered gadodiamide in patients with normal renal function, suggesting dechelation. Invest Radiol. 2014;49:685–690. [DOI] [PubMed] [Google Scholar]
- 6.Kanda T, Osawa M, Oba H, et al. High signal intensity in dentate nucleus on unenhanced T1-weighted MR images: association with linear versus macrocyclic gadolinium chelate administration. Radiology. 2015;275:803–809. [DOI] [PubMed] [Google Scholar]
- 7.McDonald RJ, McDonald JS, Kallmes DF, et al. Intracranial gadolinium deposition after contrast-enhanced MR imaging. Radiology. 2015;275:772–782. [DOI] [PubMed] [Google Scholar]
- 8.Radbruch A, Weberling LD, Kieslich PJ, et al. Gadolinium retention in the dentate nucleus and globus pallidus is dependent on the class of contrast agent. Radiology. 2015;275:783–791. [DOI] [PubMed] [Google Scholar]
- 9.Radbruch A, Weberling LD, Kieslich PJ, et al. High-signal intensity in the dentate nucleus and globus pallidus on unenhanced T1-weighted images: evaluation of the macrocyclic gadolinium-based contrast agent gadobutrol. Invest Radiol. 2015;50:805–810. [DOI] [PubMed] [Google Scholar]
- 10.Ramalho J, Castillo M, AlObaidy M, et al. High signal intensity in globus pallidus and dentate nucleus on unenhanced T1-weighted MR images: evaluation of two linear gadolinium-based contrast agents. Radiology. 2015;276:836–844. [DOI] [PubMed] [Google Scholar]
- 11.Weberling LD, Kieslich PJ, Kickingereder P, et al. Increased signal intensity in the dentate nucleus on unenhanced T1-weighted images after gadobenate dimeglumine administration. Invest Radiol. 2015;50:743–748. [DOI] [PubMed] [Google Scholar]
- 12.Schlemm L, Chien C, Bellmann-Strobl J, et al. Gadopentetate but not gadobutrol accumulates in the dentate nucleus of multiple sclerosis patients. Mult Scler. 2017;23:963–972. [DOI] [PubMed] [Google Scholar]
- 13.Radbruch A, Weberling LD, Kieslich PJ, et al. Intraindividual analysis of signal intensity changes in the dentate nucleus after consecutive serial applications of linear and macrocyclic gadolinium-based contrast agents. Invest Radiol. 2016;51:683–690. [DOI] [PubMed] [Google Scholar]
- 14.Quattrocchi CC, Mallio CA, Errante Y, et al. Gadodiamide and dentate nucleus T1 hyperintensity in patients with meningioma evaluated by multiple follow-up contrast-enhanced magnetic resonance examinations with no systemic interval therapy. Invest Radiol. 2015;50:470–472. [DOI] [PubMed] [Google Scholar]
- 15.Flood TF, Stence NV, Maloney JA, et al. Pediatric brain: repeated exposure to linear gadolinium-based contrast material is associated with increased signal intensity at unenhanced T1-weighted MR imaging. Radiology. 2017;282:222–228. [DOI] [PubMed] [Google Scholar]
- 16.Zhang Y, Cao Y, Shih GL, et al. Extent of signal hyperintensity on unenhanced T1-weighted brain MR images after more than 35 administrations of linear gadolinium-based contrast agents. Radiology. 2017;282:516–525. [DOI] [PubMed] [Google Scholar]
- 17.Kahn J, Posch H, Steffen IG, et al. Is there long-term signal intensity increase in the central nervous system on T1-weighted images after MR imaging with the hepatospecific contrast agent gadoxetic acid? A cross-sectional study in 91 patients. Radiology. 2017;282:708–716. [DOI] [PubMed] [Google Scholar]
- 18.Radbruch A, Haase R, Kickingereder P, et al. Pediatric brain: no increased signal intensity in the dentate nucleus on unenhanced T1-weighted MR images after consecutive exposure to a macrocyclic gadolinium-based contrast agent. Radiology. 2017;283:828–836. [DOI] [PubMed] [Google Scholar]
- 19.Radbruch A, Haase R, Kieslich PJ, et al. No signal intensity increase in the dentate nucleus on unenhanced T1-weighted MR images after more than 20 serial injections of macrocyclic gadolinium-based contrast agents. Radiology. 2017;282:699–707. [DOI] [PubMed] [Google Scholar]
- 20.Frenzel T, Lengsfeld P, Schirmer H, et al. Stability of gadolinium-based magnetic resonance imaging contrast agents in human serum at 37 degrees C. Invest Radiol. 2008;43:817–828. [DOI] [PubMed] [Google Scholar]
- 21.Schmitt-Willich H. Stability of linear and macrocyclic gadolinium based contrast agents. Br J Radiol. 2007;80:581–582; author reply 584–585. [DOI] [PubMed] [Google Scholar]
- 22.Bjornerud A, Vatnehol SAS, Larsson C, et al. Signal enhancement of the dentate nucleus at unenhanced MR imaging after very high cumulative doses of the macrocyclic gadolinium-based contrast agent gadobutrol: an observational study. Radiology. 2017;285:434–444. [DOI] [PubMed] [Google Scholar]
- 23.Rossi Espagnet MC, Bernardi B, Pasquini L, et al. Signal intensity at unenhanced T1-weighted magnetic resonance in the globus pallidus and dentate nucleus after serial administrations of a macrocyclic gadolinium-based contrast agent in children. Pediatr Radiol. 2017;47:1345–1352. [DOI] [PubMed] [Google Scholar]
- 24.Stojanov DA, Aracki-Trenkic A, Vojinovic S, et al. Increasing signal intensity within the dentate nucleus and globus pallidus on unenhanced T1W magnetic resonance images in patients with relapsing-remitting multiple sclerosis: correlation with cumulative dose of a macrocyclic gadolinium-based contrast agent, gadobutrol. Eur Radiol. 2016;26:807–815. [DOI] [PubMed] [Google Scholar]
- 25.Agris J, Pietsch H, Balzer T. What evidence is there that gadobutrol causes increasing signal intensity within the dentate nucleus and globus pallidus on unenhanced T1W MRI in patients with RRMS? Eur Radiol. 2016;26:816–817. [DOI] [PMC free article] [PubMed] [Google Scholar]
- 26.Lancelot E, Raynaud JS, Desche P. Lack of evidence of a relationship between magnetic resonance signal intensity changes in the globus pallidus and dentate nucleus, and repeated administrations of gadoterate meglumine in children. Pediatr Radiol. 2017;47:1692–1693. [DOI] [PMC free article] [PubMed] [Google Scholar]
- 27.Radbruch A, Quattrocchi CC. Interpreting signal-intensity ratios without visible T1 hyperintensities in clinical gadolinium retention studies. Pediatr Radiol. 2017;47:1688–1689. [DOI] [PubMed] [Google Scholar]
- 28.Maeda H, Sato M, Yoshikawa A, et al. Brain MR imaging in patients with hepatic cirrhosis: relationship between high intensity signal in basal ganglia on T1-weighted images and elemental concentrations in brain. Neuroradiology. 1997;39:546–550. [DOI] [PubMed] [Google Scholar]
- 29.Mochizuki H, Kamakura K, Masaki T, et al. Atypical MRI features of Wilson's disease: high signal in globus pallidus on T1-weighted images. Neuroradiology. 1997;39:171–174. [DOI] [PubMed] [Google Scholar]
- 30.Kanda T, Fukusato T, Matsuda M, et al. Gadolinium-based contrast agent accumulates in the brain even in subjects without severe renal dysfunction: evaluation of autopsy brain specimens with inductively coupled plasma mass spectroscopy. Radiology. 2015;276:228–232. [DOI] [PubMed] [Google Scholar]
- 31.Murata N, Gonzalez-Cuyar LF, Murata K, et al. Macrocyclic and other non-group 1 gadolinium contrast agents deposit low levels of gadolinium in brain and bone tissue: preliminary results from 9 patients with normal renal function. Invest Radiol. 2016;51:447–453. [DOI] [PubMed] [Google Scholar]
- 32.McDonald JS, McDonald RJ, Jentoft ME, et al. Intracranial gadolinium deposition following gadodiamide-enhanced magnetic resonance imaging in pediatric patients: a case-control study. JAMA Pediatr. 2017;171:705–707. [DOI] [PMC free article] [PubMed] [Google Scholar]
- 33.McDonald RJ, McDonald JS, Kallmes DF, et al. Gadolinium deposition in human brain tissues after contrast-enhanced MR imaging in adult patients without intracranial abnormalities. Radiology. 2017;285:546–554: 161595. [DOI] [PubMed] [Google Scholar]
- 34.Roberts DR, Welsh CA, LeBel DP, 2nd, et al. Distribution map of gadolinium deposition within the cerebellum following GBCA administration. Neurology. 2017;88:1206–1208. [DOI] [PMC free article] [PubMed] [Google Scholar]
- 35.Jost G, Lenhard DC, Sieber MA, et al. Signal increase on unenhanced T1-weighted images in the rat brain after repeated, extended doses of gadolinium-based contrast agents: comparison of linear and macrocyclic agents. Invest Radiol. 2016;51:83–89. [DOI] [PMC free article] [PubMed] [Google Scholar]
- 36.Robert P, Lehericy S, Grand S, et al. T1-weighted hypersignal in the deep cerebellar nuclei after repeated administrations of gadolinium-based contrast agents in healthy rats: difference between linear and macrocyclic agents. Invest Radiol. 2015;50:473–480. [DOI] [PMC free article] [PubMed] [Google Scholar]
- 37.Robert P, Violas X, Grand S, et al. Linear gadolinium-based contrast agents are associated with brain gadolinium retention in healthy rats. Invest Radiol. 2016;51:73–82. [DOI] [PMC free article] [PubMed] [Google Scholar]
- 38.Frenzel T, Apte C, Jost G, et al. Quantification and assessment of the chemical form of residual gadolinium in the brain after repeated administration of gadolinium-based contrast agents: comparative study in rats. Invest Radiol. 2017;52:396–404. [DOI] [PMC free article] [PubMed] [Google Scholar]
- 39.Kartamihardja AA, Nakajima T, Kameo S, et al. Distribution and clearance of retained gadolinium in the brain: differences between linear and macrocyclic gadolinium based contrast agents in a mouse model. Br J Radiol. 2016;89:20160509. [DOI] [PMC free article] [PubMed] [Google Scholar]
- 40.Kartamihardja AA, Nakajima T, Kameo S, et al. Impact of impaired renal function on gadolinium retention after administration of gadolinium-based contrast agents in a mouse model. Invest Radiol. 2016;51:655–660. [DOI] [PubMed] [Google Scholar]
- 41.Lohrke J, Frisk AL, Frenzel T, et al. Histology and gadolinium distribution in the rodent brain after the administration of cumulative high doses of linear and macrocyclic gadolinium-based contrast agents. Invest Radiol. 2017;52:324–333. [DOI] [PMC free article] [PubMed] [Google Scholar]
- 42.Lind NM, Moustgaard A, Jelsing J, et al. The use of pigs in neuroscience: modeling brain disorders. Neurosci Biobehav Rev. 2007;31:728–751. [DOI] [PubMed] [Google Scholar]
- 43.Félix B, Léger ME, Albe-Fessard D, et al. Stereotaxic atlas of the pig brain. Brain Res Bull. 1999;49:1–137. [DOI] [PubMed] [Google Scholar]
- 44.FDA. Guidance for Industry. Estimating the maximum safe starting dose in initial clinical trials for therapeutics in adult healthy volunteers. 2005. https://www.fda.gov/downloads/Drugs/GuidanceComplianceRegulatoryInformation/Guidances/ucm078932.pdf. Accessed November 7, 2017.
- 45.Gibby WA, Gibby KA. Comparison of Gd DTPA-BMA (Omniscan) versus Gd HP-DO3A (ProHance) retention in human bone tissue by inductively coupled plasma atomic emission spectroscopy. Invest Radiol. 2004;39:138–142. [DOI] [PubMed] [Google Scholar]
- 46.Maximova N, Gregori M, Zennaro F, et al. Hepatic gadolinium deposition and reversibility after contrast agent-enhanced MR imaging of pediatric hematopoietic stem cell transplant recipients. Radiology. 2016;281:418–426. [DOI] [PubMed] [Google Scholar]
- 47.Roberts DR, Lindhorst SM, Welsh CT, et al. High levels of gadolinium deposition in the skin of a patient with normal renal function. Invest Radiol. 2016;51:280–289. [DOI] [PubMed] [Google Scholar]
- 48.White GW, Gibby WA, Tweedle MF. Comparison of Gd(DTPA-BMA) (Omniscan) versus Gd(HP-DO3A) (ProHance) relative to gadolinium retention in human bone tissue by inductively coupled plasma mass spectroscopy. Invest Radiol. 2006;41:272–278. [DOI] [PubMed] [Google Scholar]
- 49.Hofman MA. Size and shape of the cerebral cortex in mammals, I: the cortical surface. Brain Behav Evol. 1985;27:28–40. [DOI] [PubMed] [Google Scholar]
- 50.Klos KJ, Ahlskog JE, Kumar N, et al. Brain metal concentrations in chronic liver failure patients with pallidal T1 MRI hyperintensity. Neurology. 2006;67:1984–1989. [DOI] [PubMed] [Google Scholar]
- 51.Pomier-Layrargues G, Spahr L, Butterworth RF. Increased manganese concentrations in pallidum of cirrhotic patients. Lancet. 1995;345:735. [DOI] [PubMed] [Google Scholar]
- 52.Smith AP, Marino M, Roberts J, et al. Clearance of gadolinium from the brain with no pathologic effect after repeated administration of gadodiamide in healthy rats: an analytical and histologic study. Radiology. 2017;282:743–751. [DOI] [PubMed] [Google Scholar]
- 53.Herculano-Houzel S. The human brain in numbers: a linearly scaled-up primate brain. Front Hum Neurosci. 2009;3:31. [DOI] [PMC free article] [PubMed] [Google Scholar]
- 54.Lindner U, Lingott J, Richter S, et al. Speciation of gadolinium in surface water samples and plants by hydrophilic interaction chromatography hyphenated with inductively coupled plasma mass spectrometry. Anal Bioanal Chem. 2013;405:1865–1873. [DOI] [PubMed] [Google Scholar]
- 55.Lindner U, Lingott J, Richter S, et al. Analysis of gadolinium-based contrast agents in tap water with a new hydrophilic interaction chromatography (ZIC-cHILIC) hyphenated with inductively coupled plasma mass spectrometry. Anal Bioanal Chem. 2015;407:2415–2422. [DOI] [PubMed] [Google Scholar]
- 56.Kulaksiz S, Bau M. Anthropogenic gadolinium as a microcontaminant in tap water used as drinking water in urban areas and megacities. Appl Geochem. 2011;26:1877–1885. [Google Scholar]
- 57.Bau M, Dulski P. Anthropogenic origin of positive gadolinium anomalies in river waters. Earth Planetary Sci Lett. 1996;143:245–255. [Google Scholar]
- 58.Thomsen HS. Are the increasing amounts of gadolinium in surface and tap water dangerous? Acta Radiol. 2017;58:259–263. [DOI] [PubMed] [Google Scholar]
- 59.McDonald RJ, McDonald JS, Dai D, et al. Comparison of gadolinium concentrations within multiple rat organs after intravenous administration of linear versus macrocyclic gadolinium chelates. Radiology. 2017;285:536–545. [DOI] [PubMed] [Google Scholar]
- 60.Korkusuz H, Ulbrich K, Welzel K, et al. Transferrin-coated gadolinium nanoparticles as MRI contrast agent. Mol Imaging Biol. 2013;15:148–154. [DOI] [PubMed] [Google Scholar]
- 61.Jessen NA, Munk AS, Lundgaard I, et al. The Glymphatic System: a beginner's guide. Neurochem Res. 2015;40:2583–2599. [DOI] [PMC free article] [PubMed] [Google Scholar]
- 62.Xie L, Kang H, Xu Q, et al. Sleep drives metabolite clearance from the adult brain. Science. 2013;342:373–377. [DOI] [PMC free article] [PubMed] [Google Scholar]
- 63.Varatharaj A, Galea I. The blood-brain barrier in systemic inflammation. Brain Behav Immun. 2017;60:1–12. [DOI] [PubMed] [Google Scholar]