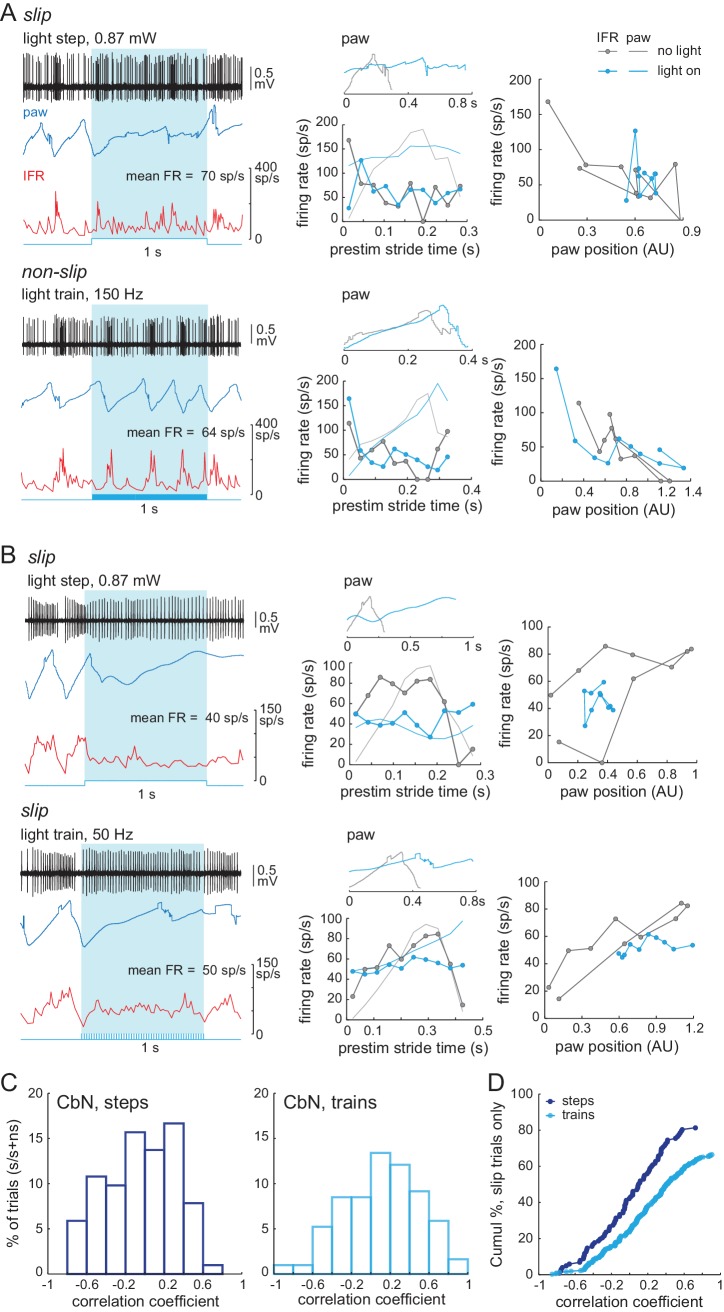
Figure 10. Loss of stride-related firing rate modulation during slips evoked by steps or trains.
(A) Left, Rate matched trials from a single CbN cell in which a step led to a slip (top) and a train led to a non-slip (bottom). Middle, Overlaid paw records from the pre-stimulation and stimulation period (upper plots) and binned instantaneous firing rates (10 bins) during the pre-stimulus stride and during the stimulation over an equivalent period (lower plots) for the trials at left. Right, firing rate vs. paw position for the trials at left. (B) As in (A) for a different CbN cell in which both the step and train led to a slip. (C) Data from Figure 8H showing the correlation between the firing rate during the pre-stimulus stride and during the stimulus on slip trials, separated by steps and trains, and normalized to the total number of step trials (122) or train trials (286). (D) Cumulative histograms for the percentage of trials with a given correlation coefficient, for slip trials only. The maximal value of each histogram corresponds to the percentage of slip trials resulting from steps (81%) or trains (63%).

