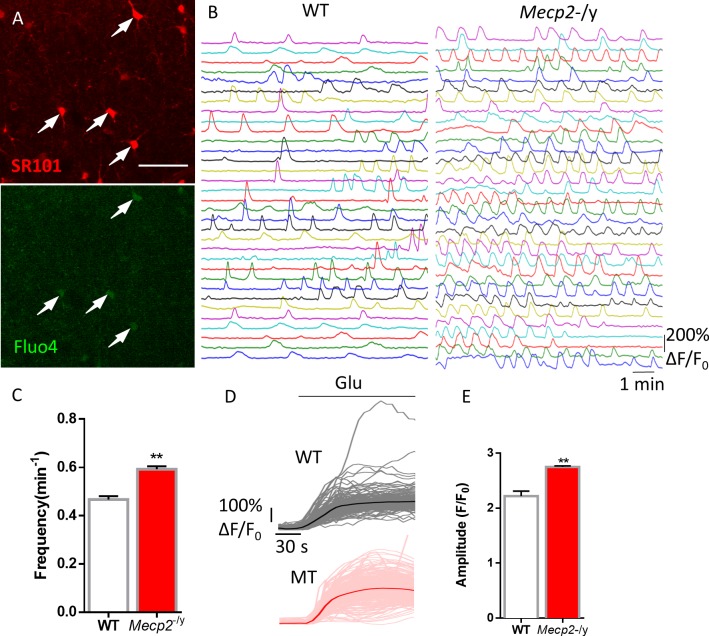
Figure 4. Abnormal Ca2+ activities in astrocytes in acute brain slices prepared from Mecp2 null mice.
(A) Representative images of SR101 labeling (astrocyte marker) and Fluo4 signals in acute hippocampal slices. Note the colocalization of SR101 and Fluo4. Scale bars = 50 μm. (B) Representative ΔF/F0 traces showing the spontaneous intracellular Ca2+ activity in SR101 positive cells in acute hippocampal slices prepared from wild type and Mecp2-/y mice. (C) Quantification of the frequency of the astrocytic Ca2+ oscillations in the slice experiments. (D) Traces of Fluo4 fluorescence changes stimulated by 100 μM glutamate in SR101 positive cells in acute hippocampal slices prepared from wild type and Mecp2-/y mice. Average traces are shown with solid lines. (E) Quantification of the peak amplitude of the glutamate-evoked Ca2+ elevations. The bar graphs in this figure show the mean ±s.e.m. *p<0.05, **p<0.01, ***p<0.001.

