. 2018 Mar 29;7:e33417. doi: 10.7554/eLife.33417

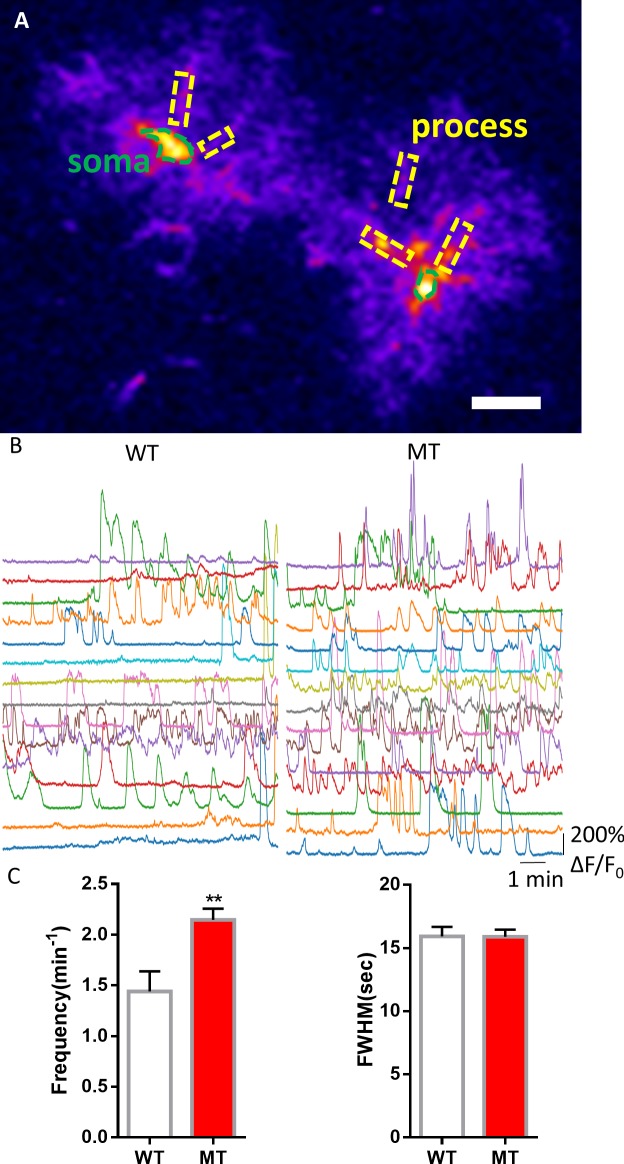
Figure 5. Abnormal spontaneous Ca2+ activities in vivo from Mecp2 null astrocytes.

(A) Representative GCaMP6s image showing two astrocytes in vivo. The somas and the processes could be clearly identified. Scale bars = 10 μm. (B) Representative ΔF/F0 traces showing the spontaneous intracellular Ca2+ activity in the soma of astrocytes in vivo from wild type and Mecp2 null astrocytes. (C) Quantification of the frequency (left) and the full width at half maximum (FWHM, right) of the astrocytic Ca2+ oscillations in vivo. The bar graphs in this figure show the mean ±s.e.m. ***p<0.001.

Figure 5—source data 1. The numerical data for the graphs shown in Figure 5.
DOI: 10.7554/eLife.33417.025

Figure 5.

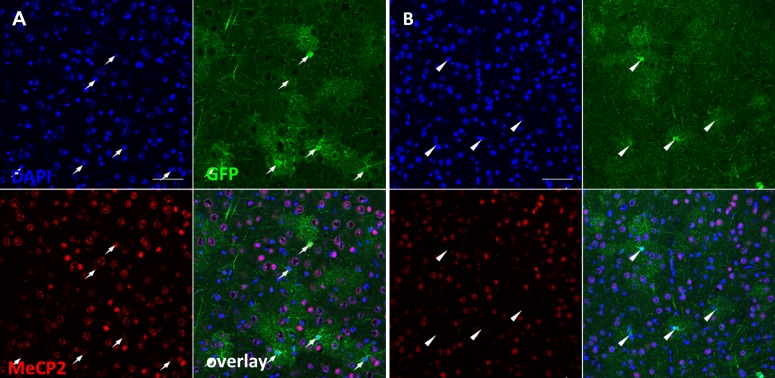
Figure 5—figure supplement 1. Co-staining of MeCP2 and GCaMP6 in cortex from WT (A) and MeCP2flox/y mice (B) that received AAV8-hGFAP-mCherry-Cre injection.

Figure 5—figure supplement 1.

Note that all of the GFP positive cells from WT mice (marked by white arrows, (A) are positive for MeCP2, while all of the GFP positive cells from MeCP2flox/y mice (marked by white arrowheads, (B) are negative for MeCP2.
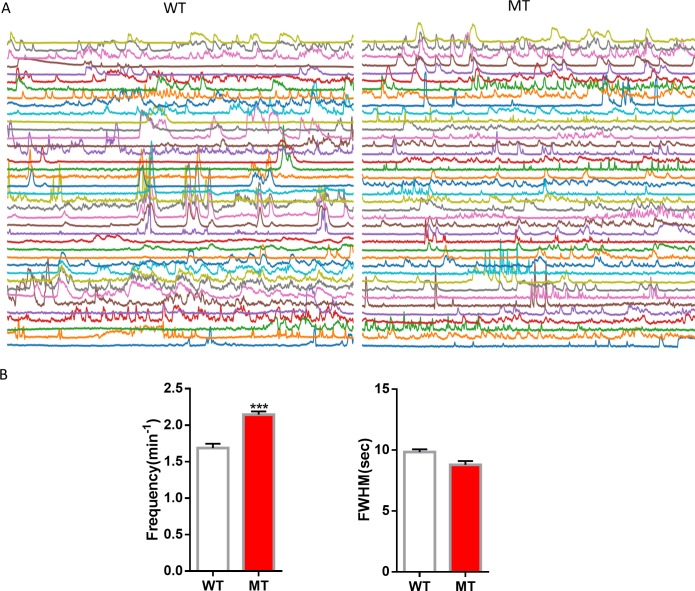
Figure 5—figure supplement 2. Quantification of spontaneous Ca2+ activity in astrocytic processes from live WT and Mecp2 null mice.

Figure 5—figure supplement 2.

(A) GCaMP6 fluorescence traces in astrocytic processes from WT and Mecp2 null mice. (B) Quantification of the frequency and full width at half maximum (FWHM) of the spontaneous Ca2+ activity in astrocytic processes. ***p<0.001. Please see Table 2 for quantification of the amplitude.