Abstract
The use of visible/NIR-emitting gold nano-clusters (Au NCs), previously proposed for in vivo imaging, has been limited to some extent by low quantum yields (QYs) and the limited penetration of visible light in tissue. Here we report short wavelength infrared (SWIR, λ = 1–2 μm) emitting Au NCs with a good photoluminescence QY for this wavelength range (0.6% to 3.8% for λem = 1000 to 900 nm) and excellent stability under physiological conditions. We show that surface ligand chemistry is critical to achieving these properties. We demonstrate the potential of these SWIR-emitting Au NCs for in vivo imaging in mice. The Au NCs have a hydrodynamic diameter that is small (~5 nm) enough that they exhibit a rapid renal clearance, and images taken in the SWIR region show better resolution of the blood vessels than in the NIR region.
Keywords: Gold nanocluster, SWIR imaging, zwitterionic ligand, renal clearance
Graphical abstract
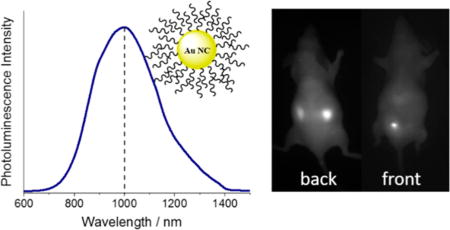
Luminescent noble metal nanoclusters, especially gold nanoclusters (Au NCs) with potentially low toxicity, ultrasmall size, excellent photostability, and facile surface functionalization, are being actively pursued as novel species of fluorescent materials.1,2 Composed of several to up to a few hundreds of Au atoms, these Au NCs exhibit quantum confinement effects and molecule-like properties.2–5 Au NCs with tunable emission from ultraviolet to near-IR (NIR) region have been reported in the last several decades, and utilization of those Au NCs for in vitro cell labeling and in vivo fluorescence imaging applications is an active research area.6–10 In earlier reports, Au NCs with emission in the NIR region are particularly being investigated for in vivo imaging applications owing to the enhanced tissue penetration enabled by NIR light.9,11,12 As in vivo imaging in the SWIR range has further reduced background noise from tissue scattering than traditional visible and NIR imaging, we focus our effort on obtaining Au NCs for SWIR in vivo imaging applications in this work.
Recently, substantial progress has been made to improve the photoluminescence (PL) quantum yield (QY) of Au NCs,13 to characterize and establish their atomically precise structures,14–16 and to understand the mechanism of their luminescence.17 However, most of the luminescent Au NCs reported so far have emission <950 nm9,18 and relatively low PL QYs,19 limiting their in vivo applications. Although the luminescence mechanism of Au NCs is still debated and has not yet been well understood, it is clear that the type and stacking structure of surface ligands play a critical role in the PL properties of Au NCs.17,20 Emission of Au NCs in the 800–950 nm range has been achieved by using a variety of ligands.21–25 Zwitterionic and bidentate thiol molecules in particular, have been explored as surface ligands and were shown to result in a higher QY and longer wavelength emission.26,27 We hypothesized that these zwitterionic and bidentate thiol ligands may enable expansion of the emission spectrum of Au NCs to the SWIR range. Here we report that Au NCs capped with a suitable shell of zwitterionic ligands (Scheme 1) can have an emission peak in the range of 900–1000 nm with acceptable PL QYs and excellent stability under physiological conditions. We show that these properties improve contrast and resolution for in vivo fluorescence imaging with Au NCs in mice.
Scheme 1.
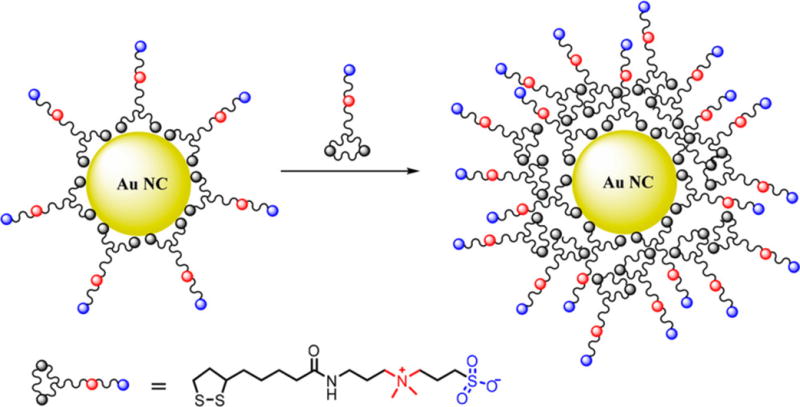
Schematic Illustration of Zwitterionic Ligands Capped Au NCs, Treated with Extra Zwitterionic Ligands, Resulting in an Expanded Ligand Shell
Au NCs are generally synthesized by reducing chloroauric acid with a reducing agent or by heating in the presence of thiolated ligands such as glutathione, dihydrolipoic acid, or proteins like bovine serum albumin.28–30 In this study, we first synthesized lipoic acid-based sulfobetaine (LA-sulfobetaine)-capped SWIR-emitting Au NCs in water by modifying a literature method that reduces chloroauric acid in the presence of LA-sulfobetaine.26 These LA-sulfobetaine capped Au NCs have an average inorganic core size of 1.6 nm (Figure S1). Their emission peak is centered at ~1000 nm (Figure 1a) with an initial QY of 0.6%. Matrix-assisted laser desorption/ionization (MALDI) analysis shows a mass interval of 197 (Figure 1b, inset), which matches the mass of Au, and the range of Au atoms in the Au NCs is estimated to be 20–50. As we discuss below, Au NCs with higher initial QYs can be synthesized by decreasing the chloroauric acid to LA-sulfobetaine ratio, presumably due to tuning of the core sizes and the existence of extended ligand layers. However, the maximum emission of these higher QY NCs is blue-shifted (~200 nm) out of the SWIR range, likely due to different core sizes and surface Au–thiolate staple motifs created in the presence of the additional ligands during synthesis.14 We hypothesized that a two-step stacking of LA-sulfobetaine ligands would help improve the QY and the amount of signal in the SWIR region. After the formation of SWIR-emitting Au NCs (~1000 nm emission peak), we then added additional LA-sulfobetaine ligands to form an extended ligand shell via electrostatic forces between ligands, and this yielded Au NCs with a QY of 3.8% and an emission peak at 900 nm.
Figure 1.
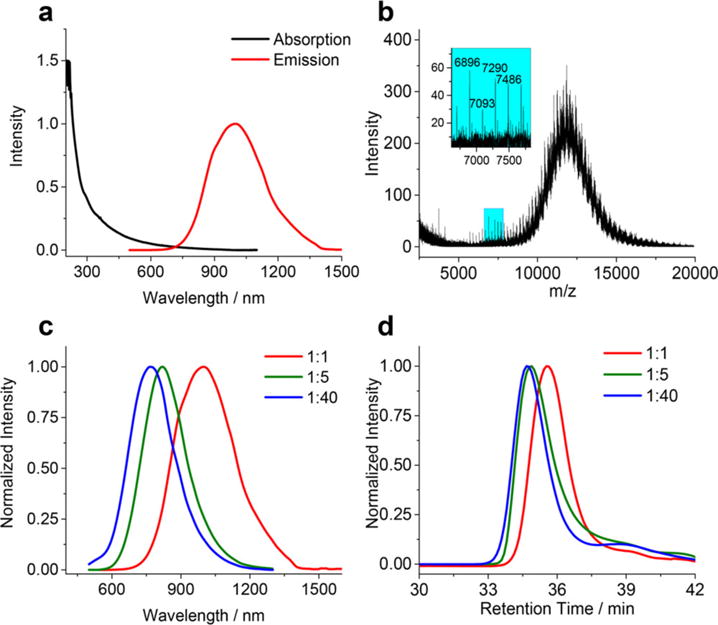
(a) Absorption and PL spectra and (b) MALDI spectrum of LA-sulfobetaine capped Au NCs (1:1, QY = 0.6%), inset is a zoomed-in area indicated in the blue region on the spectrum. (c) PL spectra and (d) gel filtration chromatography (GFC) traces of Au NCs (1:1, 1:5, and 1:40, QY = 0.6%, 6.2%, and 14.9%, respectively). PL spectra were taken under 532 nm excitation.
As indicated above, increasing the QY of our initial Au NCs (~1000 nm, 0.6% QY) by simply adjusting the chloroauric acid to LA-sulfobetaine ratio during the initial step in the synthesis results in the emission shifting to the blue. As the weight ratio of chloroauric acid hydrate to LA-sulfobetaine decreases from 1:1 to 1:5, and then to 1:40, the QY increases from 0.6% to 6.2% and 14.9%, respectively. However, the emission peak also blue-shifts by ~200 nm (Figure 1c), which counterbalances the QY improvement for potential SWIR imaging applications. As we see from the images of the three Au NCs samples (same Au molar concentration) taken using an InGaAs camera with two 1000 nm long pass (LP) filters, the detected PL intensity of the higher QY blue-shifted Au NCs (1:40) is significantly weaker than that of lower QY but red-shifted Au NCs (1:1 and 1:5) (Figure S2). Concurrent with the increased QY and the blue-shift in emission, the hydrodynamic diameter (HD) also slightly increases with more ligands present during synthesis (Figure 1d) (4.5, 5.0, and 5.2 nm, respectively, according to the GFC calibration curve, Figure S3). The inorganic core diameters of these samples are 1.6, 1.5, and 1.3 nm, respectively (Figure S1), indicating the presence of an extended ligand shell that gives rise to the increased HD. We speculate that an extra layer of LA-sulfobetaine ligands may be bound to the surface of Au NCs (1:5) and Au NCs (1:40) through electrostatic interactions between ligands or formation of disulfide bonds between LA-sulfobetaine ligands and exposed thiols on the surface of Au NCs. Consistent with this hypothesis, MALDI spectra of Au NCs (1:5) and Au NCs (1:40) (Figure S4) show an increased fragmentation, indicating more capping ligands.
To elucidate whether the extended ligand shell contributes to the increased QY and the blue-shifted emission of Au NCs (1:5 or 1:40), we incubated the low QY Au NCs (1:1) with extra LA-sulfobetaine ligands. Indeed, following treatment with additional LA-sulfobetaine ligands, the QY of Au NCs (1:1) significantly increases from 0.6% to 3.8%, accompanied by a ~100 nm blue-shift (to 900 nm) (Figure 2b). Since it is unlikely that the disulfide bond of LA-sulfobetaine can change the core size of the initial Au NCs (1:1),31,32 which is also verified by inductively coupled plasma optical emission spectrometry (ICP-OES) result that 96% of the Au was conserved after additional ligand treatment, we hypothesized the formation of an extended ligand shell (verified by an increase of 0.5 nm in HD shown by GFC, Figure S5), likely through electrostatic forces between ligands, and that this led to increased QYs and slight blue-shifts in emissions. Thermogravimetric analysis (TGA) demonstrates the extended ligand shell of Au NCs after treatment with additional LA-sulfobetaine ligands (Figure S6). As shown in Figure S6, Au NCs (1:1) lose ~40% of their original weight when heated to 500 °C, while Au NCs treated with extra ligands lose ~75% of their original weight. We further quantified the amount of ligands bound to Au NCs via liquid chromatography–mass spectrometry (LC-MS) and ICP-OES (Figure S7). Au NCs were dissolved with potassium cyanide prior to LC-MS and ICP-OES measurements to quantify the concentration of LA-sulfobetaine and Au, respectively. The result shows that there is 0.866 mg ligand/mg of Au in nontreated Au NCs, which is much lower than 3.949 mg ligand/mg of Au in treated Au NCs (Table S1). Since the Au NCs (1:5) initially have a signal intensity in the SWIR range that is similar to Au NCs (1:1) (Figure S2), we treated both samples with extra ligands for comparisons. Images of treated and untreated Au NCs (5:1, 1:1 and 1:5) taken using an InGaAs camera with two 1000 nm LP filters show that Au NCs (1:1) treated with extra LA-sulfobetaine ligands are the brightest (Figure 2a). There is also a slight increase of the SWIR signal intensity of Au NCs (1:5) after treatment, which is due to an increase in the QY. However, the blue-shift of the emission results in less signal beyond 1000 nm (Figure 2b).
Figure 2.
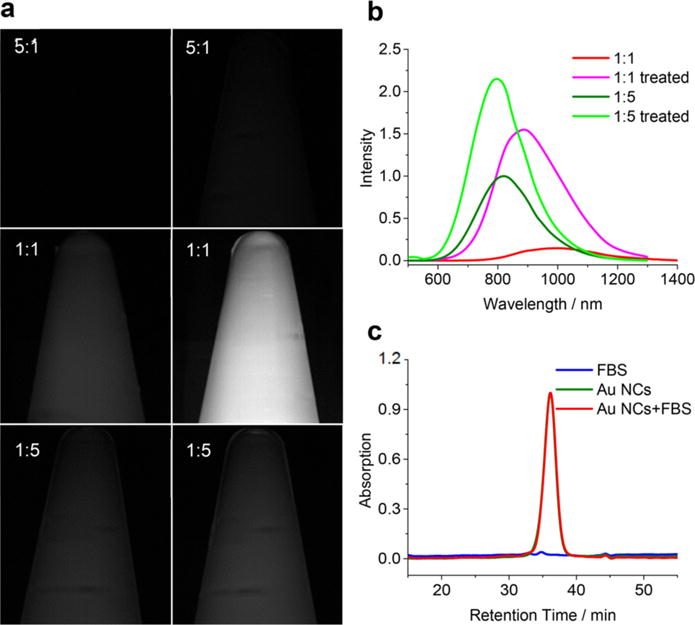
(a) Images of Au NCs (5:1, 1:1, and 1:5) (0.25 mg/mL on Au basis) in Eppendorf tubes before (left column) and after (right column) treated with extra LA-sulfobetaine ligands, taken using InGaAs SWIR camera under 808 nm excitation. (b) PL spectra of Au NCs (1:1 and 1:5) before and after treated with LA-sulfobetaine ligands at 532 nm excitation (normalized based on the signal intensities detected by the SWIR camera). (c) GFC traces of FBS, Au NCs (1:1) treated with LA-sulfobetaine ligands, and Au NCs (1:1) treated with LA-sulfobetaine ligands in FBS, respectively. Absorption was detected at 750 nm.
Although previous work has revealed some insights into the origin of the luminescence from Au NCs, the mechanism has not yet been well understood.17,20,21 Size (or number of gold atoms), the structure of the nanocluster cores, the packing of gold–thiolate motifs, and the types of ligands all play an important role.17,25,33–35 In our case, the extended ligand shell contributes to the blue-shifted luminescence and higher QY, which is probably due to rigidification of the gold shell structure that contains several Au–S motifs.13,36 To get the highest SWIR signal from Au NCs, we need to balance a higher QY but a shorter emission maximum with a lower QY but a longer emission maximum. Au NCs (1:1) treated with extra ligands (Figure 2a) provide the highest brightness in the SWIR, and we use these to demonstrate in vivo SWIR imaging. This preparation has a relatively good QY (3.8%) and an emission maximum at 900 nm.
SWIR in vivo imaging can be advantageous because of deeper penetration and higher contrast and resolution. Longer-wavelength photons in the SWIR region experience less scattering in biological tissues, combined with lower auto-fluorescence, giving higher spatial resolution at deeper tissue penetration depths.37 With their small HD, high stability, SWIR emission, and relatively good QYs, these Au NCs are promising probes for in vivo imaging. Before applying these NCs to in vivo imaging, we performed a pH and ionic strength stability test. Au NCs were dispersed in aqueous solutions of different pH (4–10) and sodium chloride solutions of different ionic strengths (0–500 mM), respectively. Both the PL intensity and HD of the Au NCs show good stability within physiological pH range and over a broad range of ionic strength (Figure S9). Moreover, Au NCs show minimal cell toxicity, as evidenced by an in vitro MTT assay (Figure S10). Serum stability test was also carried out to test the stability of the Au NCs against nonspecific binding with serum proteins. Au NCs (900 nm, 3.8% QY) were incubated with fetal bovine serum (FBS) or 1× PBS at 37 °C for 4 h, and images under an InGaAs camera show negligible difference in PL intensity (Figure S11). In addition, the retention time of Au NCs before and after incubation with FBS shows no significant changes (Figure 2c), indicating that the LA-sulfobetaine ligand not only prevents Au NCs from degradation but also minimizes adsorption of serum proteins in biologically relevant environments, consistent with previously published results.38–40
Efficient renal clearance of functional nanomaterials for contrast is of fundamental importance for in vivo biomedical applications to ensure that agents can be effectively cleared from the body, have little accumulation in organs, and show minimum interference with other diagnostic tests.12 To have a general understanding of the biodistribution and efficiency of the renal clearance of our Au NCs, Au NCs (0.125 mg Au) treated with extra LA-sulfobetaine were injected into NCRNU-M mice via the tail vein, and images were taken under 808 nm laser excitation using a SWIR camera from the front side of the mouse. The signals in heart, lung and gut of the mice can immediately be observed, and renal clearance is observed after 5 min (Figure 3a and Supporting Information, Video 1). To further demonstrate that the Au NCs were excreted by the kidneys, a second injection of Au NCs (0.125 mg gold) was given to the same mouse and images were recorded from the back side (Figure 3b). The kidneys are visible within 1 min and the signal disappears after 18 min (Supporting Information, Video 2). Urine was collected from the bladder for further analysis. The PL spectra of the injected sample and the urine overlapped well (Figure S13a), indicating that Au NCs were present in the urine. GFC traces show that the retention time of the Au NCs in the urine is the same as that of Au NCs prior to injection (Figure S13b), indicating negligible size change of the Au NCs before injection and after being excreted from the mouse. We also took images of the fractions collected by GFC using our InGaAs camera, which further demonstrates the presence of the Au NCs in the urine and the consistent HDs before and after injection (Figure S14).
Figure 3.
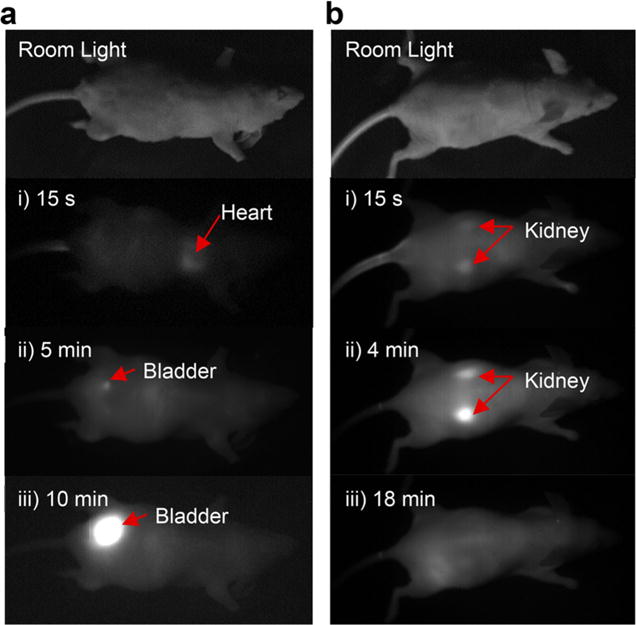
A time series of images taken from (a) the front side and (b) the back side of a mouse after injection of Au NCs.
The in vivo biodistribution of Au NCs was also investigated by intravenously injecting Au NCs into FVB mice and subsequently quantifying Au content in different tissues via inductively coupled plasma mass spectrometry (ICP-MS). As shown in Figure 4, Au NCs showed minimal accumulation in skin, muscle, heart, lungs, brain, and blood at 3 h post injection. Some accumulation of Au NCs in mononuclear phagocytic system (MPS) such as liver, spleen, and bone marrow was observed. Images of the organs taken using InGaAs camera showed higher signal intensities of liver, kidneys, spleen, and bone (Figure S15), which is consistent with the ICP-MS result. SWIR imaging of mouse urines collected at 0.5, 1.5, and 3 h, respectively, showed a decreased fluorescence intensity over time (Figure S16), and ICP-MS analysis indicates Au content in the urine counts for about 70% of injected dose, further demonstrating the rapid clearance of Au NCs, which is faster than previously reported Au NCs.12,41
Figure 4.
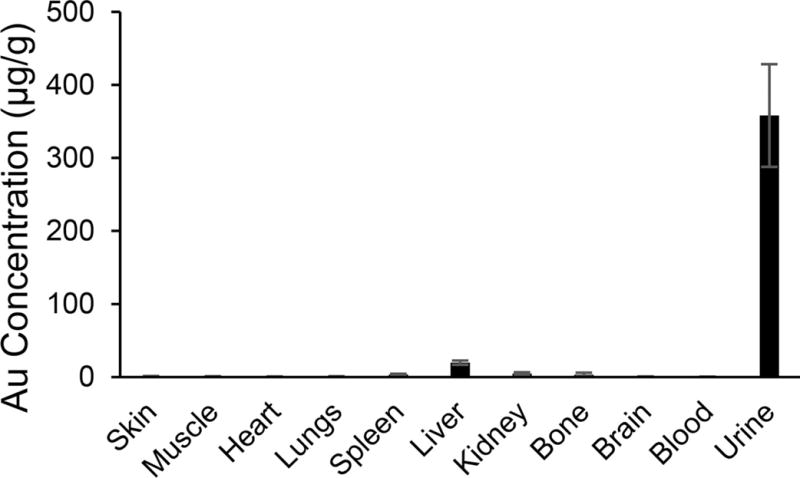
Biodistribution of Au in FVB mice (n = 6) at 3 h post injection. Data were measured using ICP-MS and presented as micrograms of Au per gram of tissue.
As seen from the emission spectrum of Au NCs (1:1) treated with extra LA-sulfobetaine ligands, a long spectral tail exists to 1300 nm (Figure 2b). Despite the lower intensity in this region, the quality of in vivo SWIR imaging may be better because of the reduced background signal from tissues. Thus, we took images of this sample using an InGaAs camera with 1250 nm, and 1300 nm LP filters added, respectively. As shown in Figure S17, a high SNR was maintained even after applying a 1300 nm LP filter. We later injected the sample into a wild type mouse (C57BL/6), and a set of images of the left leg were taken using a silicon camera with a 850 nm LP filter and an InGaAs camera with a 1250 nm LP filter respectively under 808 nm excitation. Figure 5 shows that a more detailed image of the blood vessels can be discerned from the images taken using the InGaAs camera, demonstrating the advantage of SWIR in vivo imaging with Au NCs over conventional NIR imaging.
Figure 5.
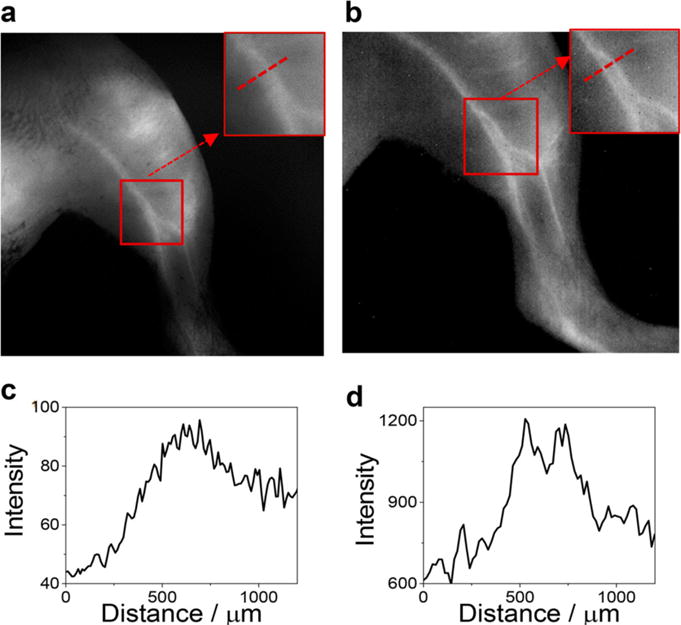
Images of the left leg of a wild type C57BL/6 mouse taken using (a) a silicon camera with a 850 nm LP filter, and (b) an InGaAs camera with a 1250 LP filter, respectively (insets are zoomed-in areas indicated in the red squares). (c,d) The intensity across a line of interest drawn in the inset images above.
In summary, we demonstrate water-soluble LA-sulfobetaine capped Au NCs with good QYs that emit in the SWIR. The SWIR-emitting Au NCs have small HDs, minimum nonspecific binding and rapid renal clearance. In vivo imaging of these Au NCs shows a higher contrast and resolution in the SWIR than in the more conventional NIR, demonstrating the potential of SWIR imaging to improve in vivo imaging using Au NCs.
Supplementary Material
Acknowledgments
This work was supported in part by the U.S. Department of Energy, Office of Science, Office of Basic Energy Sciences, Division of Materials Science and Engineering under Award Number DE-FG02-07ER46454 (Y.C.). This work received support from the NIH funded Laser Biomedical Research Center through 5-P41-EB015871-29 (O.T.B.); the ARO through the Institute for Soldier Nanotechnologies (W911NF-13-D-0001; O.C., H.W.); the MIT-MGH Strategic Partnership Program (D.M.). O.T.B. is supported by an EMBO long-term fellowship. The authors would like to thank Hua Wang, Jessica Carr, Mark Wilson, Hendrik Utzat, Michel Nasilowski, Yong Zhang, and Igor Coropceanu for helpful discussions regarding the experiments and manuscript. Part of this work made use of the MRSEC shared experimental facilities at the MIT Center for Materials Science and Engineering (CMSE).
Footnotes
Supporting Information
The Supporting Information is available free of charge on the ACS Publications website at DOI: 10.1021/acs.nano-lett.7b03070.
In vivo SWIR imaging (AVI)
In vivo SWIR imaging (AVI)
Experimental details, SWIR images, TGA figures, GFC traces and LC/MS data (PDF)
ORCID
Yue Chen: 0000-0002-9579-5189
Marc Schneider: 0000-0002-9260-7357
Xavier Le Guével 0000-0003-3634-7762
Ou Chen: 0000-0003-0551-090X
Moungi G. Bawendi: 0000-0003-2220-4365
Author Contributions
Y.C. did syntheses, characterization, stability test, and biodistribution of Au NCs. D.M. performed serum binding test. H.W., D.M. and O.C. provided assistance on ligand synthesis. O.T.B., D.M., and Y.C. performed in vivo imaging experiments. All authors participated in data analysis.
Notes
The authors declare no competing financial interest.
References
- 1.Yuan X, Luo ZT, Yu Y, Yao QF, Xie JP. Chem - Asian J. 2013;8:858–871. doi: 10.1002/asia.201201236. [DOI] [PubMed] [Google Scholar]
- 2.Zheng J, Nicovich PR, Dickson RM. Annu Rev Phys Chem. 2007;58:409–431. doi: 10.1146/annurev.physchem.58.032806.104546. [DOI] [PMC free article] [PubMed] [Google Scholar]
- 3.Chen SW, Ingram RS, Hostetler MJ, Pietron JJ, Murray RW, Schaaff TG, Khoury JT, Alvarez MM, Whetten RL. Science. 1998;280:2098–2101. doi: 10.1126/science.280.5372.2098. [DOI] [PubMed] [Google Scholar]
- 4.Zhou M, Zeng CJ, Chen YX, Zhao S, Sfeir MY, Zhu MZ, Jin RC. Nat Commun. 2016;7:13240. doi: 10.1038/ncomms13240. [DOI] [PMC free article] [PubMed] [Google Scholar]
- 5.Qian H, Zhu M, Wu Z, Jin R. Acc Chem Res. 2012;45:1470–1479. doi: 10.1021/ar200331z. [DOI] [PubMed] [Google Scholar]
- 6.Shang L, Nienhaus GU. Biophys Rev. 2012;4:313–322. doi: 10.1007/s12551-012-0076-9. [DOI] [PMC free article] [PubMed] [Google Scholar]
- 7.Zheng J, Zhou C, Yu MX, Liu JB. Nanoscale. 2012;4:4073–4083. doi: 10.1039/c2nr31192e. [DOI] [PMC free article] [PubMed] [Google Scholar]
- 8.Fernandez TD, Pearson JR, Leal MP, Torres MJ, Blanca M, Mayorga C, Le Guevel X. Biomaterials. 2015;43:1–12. doi: 10.1016/j.biomaterials.2014.11.045. [DOI] [PubMed] [Google Scholar]
- 9.Wu X, He XX, Wang KM, Xie C, Zhou B, Qing ZH. Nanoscale. 2010;2:2244–2249. doi: 10.1039/c0nr00359j. [DOI] [PubMed] [Google Scholar]
- 10.Mishra D, Aldeek F, Lochner E, Palui G, Zeng BR, Mackowski S, Mattoussi H. Langmuir. 2016;32:6445–6458. doi: 10.1021/acs.langmuir.6b00950. [DOI] [PubMed] [Google Scholar]
- 11.Sun CJ, Yang H, Yuan Y, Tian X, Wang LM, Guo Y, Xu L, Lei JL, Gao N, Anderson GJ, Liang XJ, Chen CY, Zhao YL, Nie GJ. J Am Chem Soc. 2011;133:8617–8624. doi: 10.1021/ja200746p. [DOI] [PubMed] [Google Scholar]
- 12.Zhou C, Long M, Qin YP, Sun XK, Zheng J. Angew Chem Int Ed. 2011;50:3168–3172. doi: 10.1002/anie.201007321. [DOI] [PMC free article] [PubMed] [Google Scholar]
- 13.Pyo K, Thanthirige VD, Kwak K, Pandurangan P, Ramakrishna G, Lee D. J Am Chem Soc. 2015;137:8244–8250. doi: 10.1021/jacs.5b04210. [DOI] [PubMed] [Google Scholar]
- 14.Jin RC. Nanoscale. 2015;7:1549–1565. doi: 10.1039/c4nr05794e. [DOI] [PubMed] [Google Scholar]
- 15.Zhu M, Aikens CM, Hollander FJ, Schatz GC, Jin R. J Am Chem Soc. 2008;130:5883–5885. doi: 10.1021/ja801173r. [DOI] [PubMed] [Google Scholar]
- 16.Salorinne K, Malola S, Wong OA, Rithner CD, Chen X, Ackerson CJ, Hakkinen H. Nat Commun. 2016;7:10401. doi: 10.1038/ncomms10401. [DOI] [PMC free article] [PubMed] [Google Scholar]
- 17.Wu ZK, Jin RC. Nano Lett. 2010;10:2568–2573. doi: 10.1021/nl101225f. [DOI] [PubMed] [Google Scholar]
- 18.Liu JB, Yu MX, Ning XH, Zhou C, Yang SY, Zheng J. Angew Chem Int Ed. 2013;52:12572–12576. doi: 10.1002/anie.201304465. [DOI] [PMC free article] [PubMed] [Google Scholar]
- 19.Yu Y, Luo ZT, Chevrier DM, Leong DT, Zhang P, Jiang DE, Xie JP. J Am Chem Soc. 2014;136:1246–1249. doi: 10.1021/ja411643u. [DOI] [PubMed] [Google Scholar]
- 20.Luo ZT, Yuan X, Yu Y, Zhang QB, Leong DT, Lee JY, Xie JP. J Am Chem Soc. 2012;134:16662–16670. doi: 10.1021/ja306199p. [DOI] [PubMed] [Google Scholar]
- 21.Wang GL, Huang T, Murray RW, Menard L, Nuzzo RG. J Am Chem Soc. 2005;127:812–813. doi: 10.1021/ja0452471. [DOI] [PubMed] [Google Scholar]
- 22.Wan XK, Xu WW, Yuan SF, Gao Y, Zeng XC, Wang QM. Angew Chem Int Ed. 2015;54:9683–9686. doi: 10.1002/anie.201503893. [DOI] [PubMed] [Google Scholar]
- 23.Crawford SE, Andolina CM, Smith AM, Marbella LE, Johnston KA, Straney PJ, Hartmann MJ, Millstone JE. J Am Chem Soc. 2015;137:14423–14429. doi: 10.1021/jacs.5b09408. [DOI] [PubMed] [Google Scholar]
- 24.Lee D, Donkers RL, Wang GL, Harper AS, Murray RW. J Am Chem Soc. 2004;126:6193–6199. doi: 10.1021/ja049605b. [DOI] [PubMed] [Google Scholar]
- 25.Wang GL, Guo R, Kalyuzhny G, Choi JP, Murray RW. J Phys Chem B. 2006;110:20282–20289. doi: 10.1021/jp0640528. [DOI] [PubMed] [Google Scholar]
- 26.Le Guevel X, Tagit O, Rodriguez CE, Trouillet V, Leal MP, Hildebrandt N. Nanoscale. 2014;6:8091–8099. doi: 10.1039/c4nr01130a. [DOI] [PubMed] [Google Scholar]
- 27.Aldeek F, Muhammed MAH, Palui G, Zhan NQ, Mattoussi H. ACS Nano. 2013;7:2509–2521. doi: 10.1021/nn305856t. [DOI] [PubMed] [Google Scholar]
- 28.Zhou C, Hao GY, Thomas P, Liu JB, Yu MX, Sun SS, Oz OK, Sun XK, Zheng J. Angew Chem Int Ed. 2012;51:10118–10122. doi: 10.1002/anie.201203031. [DOI] [PubMed] [Google Scholar]
- 29.Shang L, Azadfar N, Stockmar F, Send W, Trouillet V, Bruns M, Gerthsen D, Nienhaus GU. Small. 2011;7:2614–2620. doi: 10.1002/smll.201100746. [DOI] [PubMed] [Google Scholar]
- 30.Xie JP, Zheng YG, Ying JY. J Am Chem Soc. 2009;131:888–889. doi: 10.1021/ja806804u. [DOI] [PubMed] [Google Scholar]
- 31.Lopez-Tobar E, Hernandez B, Ghomi M, Sanchez-Cortes S. J Phys Chem C. 2013;117:1531–1537. [Google Scholar]
- 32.Nuzzo RG, Allara DL. J Am Chem Soc. 1983;105:4481–4483. [Google Scholar]
- 33.Zeng CJ, Liu C, Chen YX, Rosi NL, Jin RC. J Am Chem Soc. 2014;136:11922–11925. doi: 10.1021/ja506802n. [DOI] [PubMed] [Google Scholar]
- 34.Zhang ZY, Xu LJ, Li HX, Kong JL. RSC Adv. 2013;3:59–63. [Google Scholar]
- 35.Huang T, Murray RW. J Phys Chem B. 2001;105:12498–12502. [Google Scholar]
- 36.Deng HH, Shi XQ, Wang FF, Peng HP, Liu AL, Xia XH, Chen W. Chem Mater. 2017;29:1362–1369. [Google Scholar]
- 37.Hong GS, Zou YP, Antaris AL, Diao S, Wu D, Cheng K, Zhang XD, Chen CX, Liu B, He YH, Wu JZ, Yuan J, Zhang B, Tao ZM, Fukunaga C, Dai HJ. Nat Commun. 2014;5:4206. doi: 10.1038/ncomms5206. [DOI] [PubMed] [Google Scholar]
- 38.Moyano DF, Saha K, Prakash G, Yan B, Kong H, Yazdani M, Rotello VM. ACS Nano. 2014;8:6748–6755. doi: 10.1021/nn5006478. [DOI] [PMC free article] [PubMed] [Google Scholar]
- 39.Gupta A, Moyano DF, Parnsubsakul A, Papadopoulos A, Wang LS, Landis RF, Das R, Rotello VM. ACS Appl Mater Interfaces. 2016;8:14096–14101. doi: 10.1021/acsami.6b02548. [DOI] [PMC free article] [PubMed] [Google Scholar]
- 40.Oh E, Susumu K, Goswami R, Mattoussi H. Langmuir. 2010;26:7604–7613. doi: 10.1021/la904438s. [DOI] [PubMed] [Google Scholar]
- 41.Semmler-Behnke M, Kreyling WG, Lipka J, Fertsch S, Wenk A, Takenaka S, Schmid G, Brandau W. Small. 2008;4:2108–2111. doi: 10.1002/smll.200800922. [DOI] [PubMed] [Google Scholar]
Associated Data
This section collects any data citations, data availability statements, or supplementary materials included in this article.


