

Summary
The abundance of the human intestinal symbiont Akkermansia muciniphila has found to be inversely correlated with several diseases, including metabolic syndrome and obesity. A. muciniphila is known to use mucin as sole carbon and nitrogen source. To study the physiology and the potential for therapeutic applications of this bacterium, we designed a defined minimal medium. The composition of the medium was based on the genome‐scale metabolic model of A. muciniphila and the composition of mucin. Our results indicate that A. muciniphila does not code for GlmS, the enzyme that mediates the conversion of fructose‐6‐phosphate (Fru6P) to glucosamine‐6‐phosphate (GlcN6P), which is essential in peptidoglycan formation. The only annotated enzyme that could mediate this conversion is Amuc‐NagB on locus Amuc_1822. We found that Amuc‐NagB was unable to form GlcN6P from Fru6P at physiological conditions, while it efficiently catalyzed the reverse reaction. To overcome this inability, N‐acetylglucosamine needs to be present in the medium for A. muciniphila growth. With these findings, the genome‐scale metabolic model was updated and used to accurately predict growth of A. muciniphila on synthetic media. The finding that A. muciniphila has a necessity for GlcNAc, which is present in mucin further prompts the adaptation to its mucosal niche.
Introduction
Akkermansia muciniphila is a mucin‐degrading bacterium that is present in the intestinal tract of a majority of people (Derrien et al., 2008). Akkermansia muciniphila was first isolated using purified hog gastric mucus as sole carbon and nitrogen source (Derrien et al., 2004). In addition to the degradation of intestinal mucins, A. muciniphila was shown to be closely associated to colonic epithelial cells producing these mucins (Derrien et al., 2011). The adaptation to this niche is exemplified by the capabilities of A. muciniphila to utilize low concentrations of oxygen present in the mucus layer (Ouwerkerk et al., 2016), even though it was previously characterized as a strictly anaerobic bacterium (Derrien et al., 2004 (Derrien et al., 2004). The efficient use of mucin by A. muciniphila was shown in an in vitro intestinal model and upon addition of mucus, A. muciniphila abundance showed over 10 000‐fold increase, the highest ever observed in this model (Van Herreweghen et al., 2017).
The mucin in the mucus layer lining the intestinal track is composed of a peptide backbone abundantly decorated with O‐linked glycans (Johansson et al., 2011; Thomsson et al., 2012). The peptide backbone is rich in threonine, serine, cysteine and proline, while the glycans are composed of a plethora of sugar groups that contain mannose, galactose, fucose and N‐acetylhexosamines such as N‐acetylglucosamine (GlcNAc), and N‐acetylgalactosamine (GalNAc). Akkermansia muciniphila is capable of fermenting some of these sugars including galactose, fucose, glucose, GlcNAc and GalNAc, which have been reported to be used for both energy generation and as carbon source (Desai et al., 2016; Ottman et al., 2017a). However, the degradation of these sugars is only possible in the presence of mucin or large amounts of a tryptic digest of casein (Desai et al., 2016; Ottman et al., 2017a).
The genome‐encoded metabolic potential of A. muciniphila has been previously exploited to design a genome‐scale model of its metabolism (van Passel et al., 2011; Ottman et al., 2017a). Extensive model curation and evaluation led to the prediction of an auxotrophy for l‐threonine as well as predictions regarding the production of the short‐chain fatty acids (SCFA) acetate and propionate, and succinate in the absence of vitamin B12. The production of these SCFAs was confirmed by growth experiments, however, in deviating ratios compared with the predictions. The addition of l‐threonine to the growth media did increase growth, but its essentiality for growth was not confirmed due to the presence of the partially undefined casein hydrolysate in the medium (Ottman et al., 2017a).
Inverse correlations have been reported between the relative abundance of A. muciniphila and diseases and disorders as reviewed previously (Derrien et al., 2016). Moreover, in a series of preclinical interventions in mice, it was shown that A. muciniphila reversed diet‐induced metabolic fat‐mass gain and insulin resistance (Everard et al., 2013; Plovier et al., 2017) possibly due to outer membrane produced pili (Ottman et al., 2017b; Plovier et al., 2017). To better understand the physiological properties, clinical effects and function of A. muciniphila (Ottman et al., in press), it is essential to have a defined minimal medium for growth. Such a medium can also be the basis for the application of A. muciniphila as a therapeutic microbe as the medium components should be defined and preferably of non‐animal origin before clinical tests can be conducted. Here, we present a completely defined and minimal medium that supports growth of this beneficial microbe. We confirmed that the amino acid l‐threonine is essential for growth and observed that the addition of either GlcNAc or GalNAc was essential for the growth of A. muciniphila. Furthermore, we discovered A. muciniphila does not code for a functional GlmS and hence requires the exogenously added GlcNAc or GalNAc not only for fermentation, but also for peptidoglycan formation.
Results and discussion
GlcNAc is essential for A. muciniphila growth
Akkermansia muciniphila was isolated using porcine gastric mucus, and it was shown that this complex substrate could serve as the sole nitrogen and carbon source (Derrien et al., 2004). Limited growth was also observed when large amounts of tryptone, a tryptic digest of casein, were added as nitrogen source in combination with monosaccharides (Ottman et al., 2017a). This can be due to the presence of either amino acids or glycans in both complex substrates. Hence, the dependency of A. muciniphila on exogenous nitrogen‐containing compounds and sugars was tested in a series of growth experiments (Fig. 1). The amino sugars tested (GlcNac, GalNac and GlcN) in these experiments were selected based on their presence in mucin glycans. We tested the essentiality of l‐threonine by omitting it in the medium in the presence of ammonium and other amino acids, which resulted in no growth (Fig. S1). This amino acid was selected based on the A. muciniphila genome‐scale constraint‐based model of metabolism, referred to as ‘the model’ hereafter (Ottman et al., 2017a). The final composition of the minimal medium is a basal mineral medium, called CP medium (Derrien et al., 2004; Plugge, 2005), containing per litre 0.4 g KH2PO4; 0.53 g Na2HPO4; 0.3 g NaCl; 0.1 g MgCl2 6(H2O); 0.11 g CaCl2; 1 ml alkaline trace element solution; 1 ml acid trace element solution; 1 ml vitamin solution; 0.5 mg resazurin; 4 g NaHCO3; 0.25 g Na 2S.7–9H 2O as described before, but without ammonium chloride (Derrien et al., 2004) and added l‐threonine and GlcNAc or GalNAc. The composition of trace elements and vitamins was used as described before (Plugge, 2005).
Figure 1.

Growth of Akkermansia muciniphila on CP medium supplemented with l‐threonine and different sugars. All sugars were supplemented to a total of 25 mM. The negative control was supplemented with GlcNAc/glucose and not inoculated. The data shown are averages of three biological replicates and two technical duplicates for each. The experiment was performed twice in duplicate; bars indicate standard deviations.
A specific growth rate of 0.056 h−1 was observed for medium containing 25 mM GlcNAc, and a value of 0.084 h−1 was found for growth on 25 mM GalNAc (Table 1), which is no significant difference (P > 0.05). The specific growth rate was increased from 0.056 h−1 to 0.122 h−1 when half of the GlcNAc was replaced by an equimolar amount of glucose, which is a significant increase (P < 0.05). The final density of the cells is similar for growth on GlcNAc, GalNAc and GlcNAc/glucose (Fig. 1). When GlcN was used as substrate, growth was only observed with the addition of glucose, at a very low specific growth rate of 0.005 h−1.
Table 1.
Specific growth rate per hour (μ) of Akkermansia muciniphila on different sugars, with 6 g/l l‐Thr
| Sugars | μ (h−1) | SD |
|---|---|---|
| GlcNAc/Glc | 0.122 | 0.036 |
| GlcNAc | 0.056 | 0.023 |
| GalNAc | 0.084 | 0.014 |
| GlcN/Glc | 0.005 | 0.004 |
| GlcN | −0.001 | 0.002 |
| Fru | 0.000 | 0.000 |
| Glc | 0.000 | 0.000 |
| Neg. control | 0.000 | 0.000 |
The consumption and production of metabolites by A. muciniphila after growth was measured by HPLC and used to obtain insight into the pathways operating (Fig. 2), which can be used to study the degradation pathways of sugars. This analysis showed that the consumption rates of glucose and GlcNAc were the same when both were present in the growth medium (Fig. 2A). The growth differences observed (Fig. 1) could be influenced by transcriptional adaptations to the presence of amino sugars. The sugar degradation profiles (Fig. 2A and D) indicate that glucose is consumed at a similar rate throughout the analysed time‐course, indicating that no additional adaptations are required for sugar consumption. In case of GlcNAc and GalNAc degradation by A. muciniphila, the ratio of acetate and propionate production was the same, between 1.5:1 and 2:1 (Fig. 2B and C). Combination of GlcNAc and glucose in the medium leads to a 1:1 ratio (Fig. 2A). Degradation of glucose in the presence of GlcN produced acetate and propionate in a 1:2 ratio, GlcN as a sole carbon source was not able to sustain growth, nevertheless is degraded albeit in low amounts and did not contribute to SCFA production (Fig. 2D and E). This level of SCFA production on glucose was in line with the predictions by the model (Ottman et al., 2017a), but not with previous findings in growth experiments where an acetate to propionate ratio of 1:1 was found (Ottman et al., 2017a). The accurate determination of SCFA production on monosaccharides needed the minimal medium described here as on complex and undefined media with mucus or casein hydrolysate such measurements were inaccurate.
Figure 2.
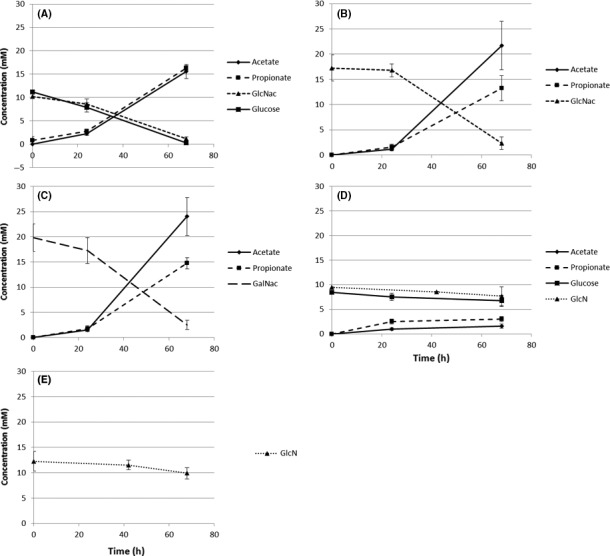
SCFA production and degradation of sugars. The degradation of GlcNAc and glucose results in a 1:1 ratio of acetate and propionate (A). The degradation of GlcNAc and GalNAc results in similar acetate and propionate ratios of 1.5:1 to 2:1 (B, C). The production of acetate and propionate on glucose and GlcN is in a 1:2 ratio (D). GlcN is still degraded when not supplemented with glucose, but no SCFA production was observed (E). The experiment was performed twice in duplicate; bars indicate standard deviations.
The production of SCFA after degradation of the acetylated amino sugars GlcNAc and GalNAc indicated that these compounds are degraded for the generation of energy in addition to their possible use for the formation of peptidoglycan. A ratio of 1.5:1 to 2:1 is in line with previous findings (Ottman et al., 2017a). The metabolic model predicts a 5:4 ratio, which slightly lower than the measured value (Ottman et al., 2017a). The early stagnation of growth on GlcN and glucose while there is some production of SCFA shows that the cells are active and alive, but limited in growth. This shows again that either GlcNAc or GalNAc is essential for growth in terms of biomass formation.
Although it has been suggested that A. muciniphila is able to degrade GalNAc (Ottman et al., 2017a), the previous metabolic reconstruction of A. muciniphila contained no GalNac degradation pathways due to the current lack of reference degradation pathways in the MetaCyc database (Caspi et al., 2014). The growth of A. muciniphila on GalNAc could possibly be explained by an isomerizing step from UDP‐GalNAc to UDP‐GlcNAc, mediated by the enzyme UDP‐glucose 4‐epimerase encoded on locus Amuc_1125 (AMUC_RS06020) (Thoden et al., 2001; Bernatchez et al., 2005; van Passel et al., 2011). The growth of A. muciniphila on GlcN in combination with glucose could be due to acetylation of GlcN6P (Fig. 3). This acetate group is known to be donated by acetyl‐CoA, which can only be formed if a sugar is degraded first. Due to this constraint, the growth may be slower because it requires glucose to form acetyl‐CoA. Additionally, from the metabolic model point of view, growth on GlcN is only impaired by the lack of a transport mechanism as we could not identify a gene in the A. muciniphila genome that would code for a transporter for GlcN. Therefore, it could be that the transport of GlcN to the cytoplasm is limited to transportation by other sugars transporters and thereby very inefficient.
Figure 3.
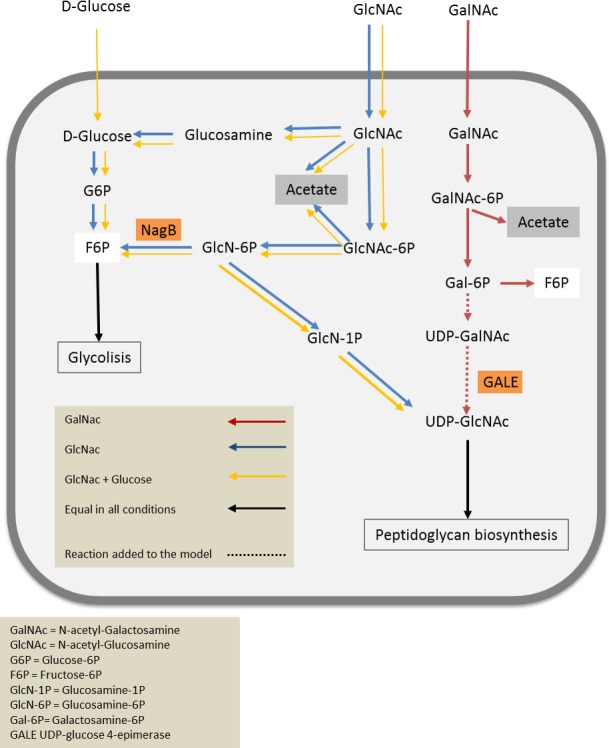
Core biochemical network of Akkermansia muciniphila with the distribution of expected fluxes in the main catabolic pathways under optimal growth conditions described in the article. Arrow width indicates relative changes in the fluxes on different substrates GalNac (red), GlcNac (blue) and mixture of GlcNac and glucose (yellow). Reactions for which all conditions showed similar fluxes are represented by black arrows. Model simulations were performed with equimolar total amounts of sugar. Figure has been adapted from (Ottman et al., 2017a).
The results indicated that amino sugars (GlcNAc, GalNAc and limited on GlcN) could support growth of A. muciniphila, but not glucose or fructose (Table S1). This suggested that A. muciniphila might lack the ability to aminate fructose‐6‐phospgate (Fru6P) to form glucosamine‐6‐phosphate (GlcN6P), which is an essential step in peptidoglycan synthesis (Barreteau et al., 2008; Durand et al., 2008) (Fig. 3). This reaction is catalyzed by the enzyme GlmS (see below), which mediates the attachment of an amino group donated by glutamine to Fru6P to form GlcN6P (Durand et al., 2008). This phosphorylated sugar is subsequently converted to N‐acetylglucosamine‐6‐phosphate after the addition of an acetate group and isomerized to N‐acetylglucosamine‐1‐phosphate (Barreteau et al., 2008; Fig. 3). The enzyme GlmS is essential in all peptidoglycan‐forming bacteria (Milewski, 2002), and Escherichia coli glms mutants are only viable if the growth medium is supplemented with GlcNAc (Wu and Wu, 1971). This indicates that the GlcNAc can be phosphorylated and used for peptidoglycan synthesis directly by A. muciniphila, an Akkermansia GlcNac shortcut (Fig. 3).
Genomic analysis of A. muciniphila for the identification of glucosamine‐6‐phosphate deaminase
We mined the A. muciniphila genome to identify genes encoding enzymes mediating conversions between Fru6P and GlcN6P. This lead to the finding that the genome of A. muciniphila does not code for a gene with high similarity to a characterized GlmS, see Table S5. The highest identity to E. coli GlmS was a von Willebrand factor type A domain protein (KXT50996.1) with an identity of 26% and an Expect (E)‐value of 0.68, indicating a very low likelihood that this protein is a GlmS homologue (Table S6) (Altschul et al., 1990, 1994). There are also no gene homologues to GlmS from Verrucomicrobium spinosum, the type strain for Verrucromicrobiae, and thus a relative of A. muciniphila (Table S7). Therefore, we consider A. muciniphila does not code for GlmS. The gene that encodes for glucosamine‐6‐phosphate deaminase (CDB55261.1) on locus amuc_1822 (AMUC_RS09725) is the only candidate gene that expresses an enzyme which could mediate the reaction between GlcN6P and Fru6P (Table S4). No homologues were found in the A. muciniphila genome. The analogue in E. coli is named NagB. The directionality of this enzyme from different organisms is ambiguous (Vincent et al., 2005). It has been found to predominantly mediate the reaction in the deaminating direction, but aminating activity has been found as well (Tanaka et al., 2005; Kwiatkowska‐Semrau et al., 2015). Hence, we focused our attention to the kinetic characterization of the A. muciniphila NagB homologue. It should be noted that the recent genome sequencing of 39 A. muciniphila isolates might result in the discovery of genes coding for a functional NagB homologue, especially because of the great differences found between strains in the amino sugar metabolism (Guo et al., 2017).
Enzyme assays confirm the deamination properties of glucosamine‐6‐phosphate deaminase
We observed that A. muciniphila was not able to metabolise fructose and does not grow on glucose, while GlcN supports growth, although very limited (Table 1). To assess the capabilities of A. muciniphila to convert fructose‐6‐phosphate (Fru6P) into glucosamine‐6‐phosphate (GlcN6P) and vice versa, we overproduced the only possible candidate enzyme, termed Amuc‐NagB, encoded by gene amuc_1822 (AMUC_RS09725) in E. coli BL21 (DE3) with a C‐terminal His‐tag and purified it to apparent homogeneity as a 33‐kDa protein (Fig. S2). The purified Amuc‐NagB was assayed for conversions in both the aminating and deaminating direction and with all possible substrates involved (Table S2).
At non‐physiological and saturating conditions, we found that the enzyme Amuc‐NagB can mediate the reaction combining Fru6P and NH4 to produce GlcN6P, with Km values for Fru6P and NH4 of 5.5 ± 0.9 mM and 41.3 ± 12.8 mM, respectively (Table 2), as calculated based on triplicate assays. However, the Km of GlcN6P value for the deaminating direction is much lower at 2.4 ± 0.2 mM (Table 2). The addition of GlcNAc6P as possible allosteric activator had no significant influence on the Km values (P > 0.05). On top of this, the activity of the purified Amuc‐NagB on Fru6P with glutamine was measured to determine the possibility for this enzyme to mediate the conversion of Fru6P + glutamine □ GlcN6P + glutamate [EC 2.6.1.16]. No activity was found using these substrates. Additional controls using enzyme without substrates and substrate without enzyme also showed no activity (Table S8).
Table 2.
Enzyme kinetics of Akkermansia muciniphila NagB with and without GlcNAc6P. The addition of 0.25 mM GlcNAc6P as activator has no influence on the kinetics of the enzyme
| Activator: GlcNAc6P (mM) | Km (mM) | P‐value | |
|---|---|---|---|
| 0 (n = 3) | 25 (n = 2) | ||
| NH4 | 41.3 ± 12.8 | 50.6 ± 10.5 | 0.54 |
| Fru6P | 5.5 ± 0.9 | 8.4 ± 2.7 | 0.48 |
| GlcN6P | 2.4 ± 0.2 | 2.1 ± 0.8 | 0.75 |
The Km value of 41.3 mM for NH4 is high, but ammonium is not toxic at this concentration (Fig. S3), and these concentrations are described to be present in the gut (Macfarlane et al., 1986, 1992). The ammonium present in the gut diffuses through the cell to almost equilibrium (Muller et al., 2006), so the required ammonium concentration for the aminating direction could take place as such in the A. muciniphila cells. However, the Km value of Fru6P at 5.5 mM is rather high, this compound is described to be toxic in these amounts in many bacteria (Kadner et al., 1992). Additionally, the Km value of GlcN6P is lower at 2.4 mM. GlcN6P is the only compound involved in the deaminating direction (Table 2, Table S8).
The kinetic values found for Amuc‐NagB are in line with previously characterized NagB‐like enzymes (Calcagno et al., 1984), except for the absence of the need for an allosteric activator. In all cases, GlcNAc6P is described as an allosteric activator (Alvarez‐Anorve et al., 2005, 2016). Our results clearly show that the overexpressed Amuc‐NagB is not allosterically activated by GlcNAc6P (Table 2).
Considering the kinetic values of Amuc‐NagB, it is unlikely for the aminating reaction to occur at physiological conditions, as also postulated before (Calcagno et al., 1984). We assume an alternative route to synthesize phosphorylated amino glucoses (GlcN6P, GlcN1P, GlcNAc6P and GlcNAc1P) is taking place, which is provided by the addition of non‐phosphorylated GlcNAc or GalNAC to the growth medium. We propose that GlcNAc can be used by A. muciniphila to form peptidoglycan intermediates and ultimately peptidoglycan via the Akkermansia GlcNac shortcut (Fig. 3).
Optimization of the A. muciniphila genome‐scale constraint‐based model of metabolism
The growth on different sugars was compared with predictions from the A. muciniphila model as presented before (Ottman et al., 2017a). The initial version of the model (AkkMuc_588 v1) predicted growth on all sugars testes, except GlcN, as discussed above. This is in discrepancy with growth in minimal medium and can be explained by the absence of GlmS that was assumed to be present in the model due to the use of gap‐filling algorithms (Table 3). Based on these findings, the model was adjusted by deleting the reaction Fru6P + Glutamine □ GlcN6P + Glutamate [EC 2.6.1.16]. This yielded correct growth predictions for glucose and GlcNAc. The adjusted model (AkkMuc_588 v2) still did not predict growth on GalNAc. This was solved by the additional annotation of UDP‐glucose 4‐epimerase on locus Amuc_1125 (AMUC_RS06020) as UDP‐GlcNAc 4‐epimerase and which supports the formation of UDP‐GalNAc from GalNAc as discussed above. The epimerase has previously shown to bidirectional mediate the conversion of UDP‐glucose to UDP‐galactose and UDP‐GlcNAc to UDP‐GalNAc in both bacteria and human (Thoden et al., 2001; Bernatchez et al., 2005). The improved version of the model contains 748 reactions describing conversions among 737 metabolites and can be found in SBML and table (xls) formats in the Supplementary Information.
Table 3.
Growth comparison between in vitro and in silico analyses
| Sugar 1 | Sugar 2 | AkkMuc_588 v1 (y/n) | AkkMuc_588 v2 (y/n) | AkkMuc_588 v2 (au) | Lab (μ) (h−1) |
|---|---|---|---|---|---|
| Glucose | GlcN | y | n | 0 | 0.005 |
| GlcN | n | n | 0 | 0 | |
| GlcNAc | y | y | 0.09 | 0.056 | |
| GlcNAc | Glucose | y | y | 0.13 | 0.122 |
| GalNAc | y | y | 0.09 | 0.084 | |
| Glucose | y | n | 0 | 0 |
Qualitative predictions by the adjusted model (AkkMuc_588 v2) showed higher similarity to our laboratory experiments than the original model (Table 3). The only small difference between the model and laboratory experiments is the growth on a medium containing GlcN and glucose. While the model predicts no growth, a specific growth rate of 0.005 h−1 was observed in the laboratory experiment. This could be caused by a limited uptake of GlcN, even though there is no GlcN transporter annotated. Simulations with an in silico generated mutant with a hypothetical GlcN transporter show that the absence of this transporter is the sole reason for the lack of growth predicted for this sugar. This small uptake could explain the low growth rate in the presence of both GlcN and glucose, thereby providing full agreement between the model qualitative predictions and the experimental results. Nevertheless, the role of glucose remains unclear, as from the experiments, we see that it would be essential to enable this possible low uptake rate.
Concluding, we have shown that GlcNAc or Galnac with the addition of l‐threonine are essential for growth of A. muciniphila. The dependency on GlcNAc or GalNAc is caused by the absence of a gene coding for GlmS, which mediates the aminating reaction from Fru6P to GlcN6P with glutamine as amino donor (Fig. 3), while Amuc‐NagB was shown to be NagB indeed. The absence of GlmS enzyme and the presence of GlcNAc in the ecological niche of A. muciniphila resulted in an alternative pathway for peptidoglycan formation.
This finding supported the development of a growth medium that allows the use of A. muciniphila in preclinical and phase I clinical trials. Additionally, a minimal medium can be used for detailed physiological studies, and manipulation. With this information, we adjusted an existing genome‐scale metabolic model by deleting the reaction mediated by GlmS. This yielded a more accurate prediction of growth possibilities and growth rate by the metabolic model compared with the previous version of the model. The development of the defined minimal medium for A. muciniphila was based on gathered knowledge about this species and contributed to a better understanding of this organism and it evolutionary adaptation to mucin components.
Experimental procedures
Culturing A. muciniphila, optical density and HPLC
Akkermansia muciniphila was grown in anoxic bottles containing 10 ml CP medium as described before without ammonium chloride (Derrien et al., 2004), supplemented with 6 g/l of l‐threonine. Initial tests were performed with varying concentrations of GlcNAc (1 mM, 5 mM, and 10 mM) and 50 mM of glucose. Specific growth rates were seen to increase with increasing GlcNAc concentration, and 25 mM sugar was selected for further study, as indicated in Table S1. It should be noted that we used anoxic bottles to culture the bacteria and added the sugars with a syringe and filter after autoclaving. This could yield slightly lower total amounts, but in all cases, the initial sugar concentrations remained above 20 mM sugar, except for GluN where a lower amount of sugar was tested. Inoculum for the determination of growth speed was grown in basal mineral medium supplemented with 6 g/l l‐threonine and 25 mM of GlcNAc. Inoculum for the determination of sugar essentiality was grown on mucus medium as described before (Derrien et al., 2004). A volume of 100 μl of cultures in stationary phase was used as inoculum. Growth was determined by measuring the optical density at 600 nm. High‐pressure liquid chromatography (HPLC) was used to determine sugar consumption and SCFA production, as described before (Derrien et al., 2004; Ouwerkerk et al., 2016; Ottman et al., 2017a). Glucosamine (GlcN) concentration was determined by reagent‐free ion chromatography using a Dionex™ ICS‐5000 (Thermo Scientific, Sunnyville, CA, USA), with a Dionex CarboPac PA20 Analytic column and 20 mM NaOH as eluent. Further settings were according to manufacturer's application note. Experiments were performed twice in duplicate; significance of differences was determined by a paired T‐test.
Identification of GlmS and NagB homologues in A. muciniphila
Escherichia coli K12 NagB (NP_415204.1) and GlmS (NP_418185.1) amino acid sequences were used to identify enzymes that can mediate the formation of GlcN6P from Fru6P in Akkermansia (taxid:239934). This was performed by selecting best bidirectional blastp (protein‐protein BLAST) hits between both genomes (Altschul et al., 1990). Analysis was performed on February 10, 2017.
Enzyme expression and purification
The A. muciniphila gene NagB on locus Amuc_1822 (AMUC_RS09725) was amplified using the forward primer 5′‐ATAGAGGTACCATGATCGGGGTGGAAAGT‐3′ and the reverse primer 5′‐ TATGCCCTAGGTTAATGGTGGTGGTGATGATGAAGGAGGGAAGCAGCCC‐3′, adding a C‐terminal His‐tag (bold in primer sequence) and restriction sites (underlined in primer sequence). Genomic DNA from A. muciniphila ATCC BAA‐835 was used as template. The purified amplicon and vector pCDF‐1b (Novagen, Merck Milipore, Darmstadt, Germany) were digested using enzymes XmaIJ (Thermo Fisher Scientific) and KpnI HF (New England Biolabs) in Tango buffer (Thermo Fisher Scientific) for 1.5 h at 37°C. The DNA was purified again and ligated with 3:1 ratio (insert:vector) using T4 ligase (manufacturers protocol, Thermo Fisher Scientific). Competent Escherichia coli DH10B (manufacturers protocol, New England Biolabs) were transformed with 2 μl ligation mixture and plated on LB agar with 50 ug/ml spectinomycin. A selected colony was grown in 10 ml liquid LB until an OD600 of 1 after which plasmids were purified. Escherichia coli BL21 (DE3) (manufacturers protocol, New England Biolabs) was transformed with 1 μl plasmid containing 60 ug/ml DNA, and 100 μl was plated on LB agar with 50 ug/ml spectinomycin. The transformed strain was grown in 250 ml liquid LB medium with 50 ug/ml spectinomycin until an OD600 of 0.5‐1 after which is was induced with 1 mM IPTG for 4 h at 37°C. The bacteria were collected by centrifugation at 5000 g for 10 min and suspended in lysis buffer (50 mM Tris‐HCl pH 7.5, 200 mM NaCl, 1 mM MgCl2, 5 mM DTT, 1 mM PMSF). The cells were lysed by three passages in a French Press (15 000 psi, Pressure Cell Homogeniser, Stansted Fluid Power Ltd., Essex, UK). The lysate was cleared by centrifugation for 10 min at 16 000 g. The proteins were purified using a nickel column (manufacturers protocol, Ni‐NTA Agarose, Qiagen GmbH, Hilden, Germany). Purified fractions were dialyzed against 1 L of buffer A (25 mM KH2PO4/K2HPO4, pH 7.0, 0.5 mM PMSF, 1 mM DTT, 1 mM EDTA). Purity of the enzymes was checked using SDS‐PAGE. Enzyme concentration was determined by BCA protein assay (manufacturers protocol, Thermo Fisher Scientific).
Enzyme assays
Enzyme assays were performed as described before (Kwiatkowska‐Semrau et al., 2015). Shortly, 1.5 ml tubes were filled with the buffer and substrates as indicated in Table S3. The enzymes were added last, after which the tubes were vortexed shortly and incubated at 37°C for exactly 3 min. Subsequently, the tubes were placed at 99°C for 1 min and cooled on ice. To acetylate GlcN6P, 100 μl of 10% acetic acid in acetone and 200 μl of a saturated NaHCO3 solution were added, after which the samples were incubated for 3 min at 20°C and 3 min at 99°C. The samples were cooled on ice again, after which 200 μl of a 0.8 M potassium tetraborate hexahydrate solution was added. The samples were incubated for 3 min at 99°C and cooled on ice. Finally, 800 μl of this solution was added to 5 ml of reagent A (1 g of 4‐dimethylaminobenzaldehyde in 100 ml of glacial acetic acid to which 1.5 ml 37% HCl is added). The samples were incubated at 37°C for 30 min, after which the absorbance was measured at 585 nm (manufacturer). The Km and Vmax values were determined by plotting the obtained data on a Lineweaver‐Burk plot (Burk et al., 1934).
Genome‐scale constraint‐based metabolic model
The genome‐scale constraint‐based model of A. muciniphila AkkMuc_588 reported previously (Ottman et al., 2017a) was used to assess growth potential on different media. The core of the model is S the stoichiometric matrix. S is an m × n matrix, where n is the number of metabolites and m is the number of reactions in the model, 734 and 745 respectively. Entries of S represent the stoichiometric coefficients of each metabolite in each reaction. In addition to reactions describing metabolic interconversions and transport, the model also contain reactions that describe the media composition and the uptake and secretion potential of the organism, these are the so‐called exchange reactions. The usual convention (followed in the A. muciniphila model) is to represent uptake and production as negative and positive fluxes through the exchange reactions respectively. The model was used to simulate steady state as, in such situation, production of intracellular metabolites equals consumption, and the model was used to identify sets of reactions (or pathways) that carry flux in such a case. Moreover, flux balance analysis (FBA) can be used to identify optimal (maximal or minimal) theoretical values for selected objectives such as biomass synthesis or metabolite uptake or production (Orth et al., 2010).
Model simulations were performed by simulating the experimentally tested media. Unlimited secretion was allowed for metabolites in the media by setting the upper bounds of the corresponding exchange reactions to 1000. Abundant metabolites in the media such as water, P, Mn, Mg, Fe, Cu, Co, Cl, H2O2, sulphate and dimethylbenzimidazole, were set to be non‐limiting by setting the lower bounds of the corresponding exchange reactions to −1000. Simulations involving threonine media supplementation were performed with a limited maximal possible uptake of 1. For all the tested sugars, a range of uptake rates between 0 and 10 was tested. Arbitrary units (a.u.) were used in all simulations. Estimations of changes in fluxes in different growth conditions were performed by assessing the variations in the maximum and minimum flux values through each reaction compatible with maximal growth rate. FBA and model simulations were performed using python version 2.7.12 (Python, 2017) the cobrapy library (version 0.4.1) (Ebrahim et al., 2013) and gurobi solver (Gurobi Optimizer Version 6.5.1 linux64) (Gurobi, 2016).
Contributions
All authors read and approved the final manuscript.
Availability of data and materials
The genome‐scale metabolic model of Akkermansia muciniphila AkkMuc_588_v2 is available as supplementary material together with a list of the changes respect to the previous version. Supplementary file contains the AkkMuc_588_v2 model in SBML level 2 and in table (xls) format. The file also contains documentation indicating the changes respect to the previous version. Finally, to ease model reutilization, we have included a Python script to perform growth simulations on different media. The script requires the COBRApy library (and has been tested with version 0.4.1) (Ebrahim et al., 2013) and an LP solver such as Gurobi (Gurobi, 2016). This model was deposited in BioModels (Chelliah et al., 2015) and assigned the identifier MODEL1710040000.
Conflict of Interests
The authors declare that they have no competing interests.
Supporting information
Fig. S1. Growth of A. muciniphila on CP medium supplemented with 25 mM of each glucose and GlcNAc.
Fig. S2. SDS‐PAGE gel of overexpressed protein purification using a Ni‐column.
Fig. S3. Growth of A. muciniphila on CP medium supplemented with 25 mM GlcNAc, 6 g/l Thr and 0 mM or 50 mM NH4Cl.
Table S1. Composition of tested media.
Table S2. Determination of protein concentrations by BCA assay used for enzyme assays.
Table S3. Overview of substrates used in enzyme assay.
Table S4. BlastP of Escherichia coli K12 NagB (NP_415204.1) against Akkermansia (taxid:239934).
Table S5. BlastP of A muciniphila NagB (CDB55261.1) against all sequence except Akkermansia (taxid:239934).
Table S6. BlastP of Escherichia coli K12 GlmS (NP_418185.1) against Akkermansia (taxid:239934).
Table S7. BlastP of Verrucromicrobium spinosum GlmS (WP_009962724.1) against Akkermansia muciniphila.
Table S8. Control reactions for enzyme assay of A. muciniphila NagB.
Microbial Biotechnology (2018) 11(3), 476–485
Funding Information
The work was supported by the Netherlands Organization for Scientific Research (Spinoza Award and SIAM Gravitation Grant 024.002.002) granted to WMdV. The funding organizations had no role in design of the study and collection, analysis and interpretation of data and in writing the manuscript.
References
- Altschul, S.F. , Gish, W. , Miller, W. , Myers, E.W. , and Lipman, D.J. (1990) Basic local alignment search tool. J Mol Biol 215: 403–410. [DOI] [PubMed] [Google Scholar]
- Altschul, S.F. , Boguski, M.S. , Gish, W. , and Wootton, J.C. (1994) Issues in searching molecular sequence databases. Nat Genet 6: 119–129. [DOI] [PubMed] [Google Scholar]
- Alvarez‐Anorve, L.I. , Calcagno, M.L. , and Plumbridge, J. (2005) Why does Escherichia coli grow more slowly on glucosamine than on N‐acetylglucosamine? Effects of enzyme levels and allosteric activation of GlcN6P deaminase (NagB) on growth rates. J Bacteriol 187: 2974–2982. [DOI] [PMC free article] [PubMed] [Google Scholar]
- Alvarez‐Anorve, L.I. , Gaugue, I. , Link, H. , Marcos‐Viquez, J. , Diaz‐Jimenez, D.M. , Zonszein, S. , et al (2016) Allosteric activation of Escherichia coli glucosamine‐6‐phosphate deaminase (NagB) in vivo justified by intracellular amino sugar metabolite concentrations. J Bacteriol 198: 1610–1620. [DOI] [PMC free article] [PubMed] [Google Scholar]
- Barreteau, H. , Kovac, A. , Boniface, A. , Sova, M. , Gobec, S. , and Blanot, D. (2008) Cytoplasmic steps of peptidoglycan biosynthesis. FEMS Microbiol Rev 32: 168–207. [DOI] [PubMed] [Google Scholar]
- Bernatchez, S. , Szymanski, C.M. , Ishiyama, N. , Li, J. , Jarrell, H.C. , Lau, P.C. , et al (2005) A single bifunctional UDP‐GlcNAc/Glc 4‐epimerase supports the synthesis of three cell surface glycoconjugates in Campylobacter jejuni . J Biol Chem 280: 4792–4802. [DOI] [PubMed] [Google Scholar]
- Burk, D. , Lineweaver, H. , and Horner, C.K. (1934) The specific influence of acidity on the mechanism of nitrogen fixation by Azotobacter. J Bacteriol 27: 325–340. [DOI] [PMC free article] [PubMed] [Google Scholar]
- Calcagno, M. , Campos, P.J. , Mulliert, G. , and Suastegui, J. (1984) Purification, molecular and kinetic properties of glucosamine‐6‐phosphate isomerase (deaminase) from Escherichia coli . Biochim Biophys Acta 787: 165–173. [DOI] [PubMed] [Google Scholar]
- Caspi, R. , Altman, T. , Billington, R. , Dreher, K. , Foerster, H. , Fulcher, C.A. , et al (2014) The MetaCyc database of metabolic pathways and enzymes and the BioCyc collection of pathway/genome databases. Nucleic Acids Res 42: D459–D471. [DOI] [PMC free article] [PubMed] [Google Scholar]
- Chelliah, V. , Juty, N. , Ajmera, I. , Ali, R. , Dumousseau, M. , Glont, M. , et al (2015) BioModels: ten‐year anniversary. Nucleic Acids Res 43: D542–D548. [DOI] [PMC free article] [PubMed] [Google Scholar]
- Derrien, M. , Vaughan, E.E. , Plugge, C.M. , and de Vos, W.M. (2004) Akkermansia muciniphila gen. nov., sp nov., a human intestinal mucin‐degrading bacterium. Int J Syst Evol Microbiol 54: 1469–1476. [DOI] [PubMed] [Google Scholar]
- Derrien, M. , Collado, M.C. , Ben‐Amor, K. , Salminen, S. , and de Vos, W.M. (2008) The Mucin degrader Akkermansia muciniphila is an abundant resident of the human intestinal tract. Appl Environ Microbiol 74: 1646–1648. [DOI] [PMC free article] [PubMed] [Google Scholar]
- Derrien, M. , Van Baarlen, P. , Hooiveld, G. , Norin, E. , Muller, M. , and de Vos, W.M. (2011) Modulation of mucosal immune response, tolerance, and proliferation in mice colonized by the Mucin‐degrader Akkermansia muciniphila . Front Microbiol 2: 166. [DOI] [PMC free article] [PubMed] [Google Scholar]
- Derrien, M. , Belzer, C. , and de Vos, W.M. (2016) Akkermansia muciniphila and its role in regulating host functions. Microb Pathog 106: 171–181. [DOI] [PubMed] [Google Scholar]
- Desai, M.S. , Seekatz, A.M. , Koropatkin, N.M. , Kamada, N. , Hickey, C.A. , Wolter, M. , et al (2016) A dietary fiber‐deprived gut microbiota degrades the colonic mucus barrier and enhances pathogen susceptibility. Cell 167(1339–1353): e1321. [DOI] [PMC free article] [PubMed] [Google Scholar]
- Durand, P. , Golinelli‐Pimpaneau, B. , Mouilleron, S. , Badet, B. , and Badet‐Denisot, M.A. (2008) Highlights of glucosamine‐6P synthase catalysis. Arch Biochem Biophys 474: 302–317. [DOI] [PubMed] [Google Scholar]
- Ebrahim, A. , Lerman, J.A. , Palsson, B.O. , and Hyduke, D.R. (2013) COBRApy: COnstraints‐based reconstruction and analysis for python. BMC Syst Biol 7: 74. [DOI] [PMC free article] [PubMed] [Google Scholar]
- Everard, A. , Belzer, C. , Geurts, L. , Ouwerkerk, J.P. , Druart, C. , Bindels, L.B. , et al (2013) Cross‐talk between Akkermansia muciniphila and intestinal epithelium controls diet‐induced obesity. Proc Natl Acad Sci USA 110: 9066–9071. [DOI] [PMC free article] [PubMed] [Google Scholar]
- Guo, X. , Li, S. , Zhang, J. , Wu, F. , Li, X. , Wu, D. , et al (2017) Genome sequencing of 39 Akkermansia muciniphila isolates reveals its population structure, genomic and functional diverisity, and global distribution in mammalian gut microbiotas. BMC Genom 18: 800. [DOI] [PMC free article] [PubMed] [Google Scholar]
- Gurobi (2016). Optimizer reference manual.
- Johansson, M.E. , Larsson, J.M. , and Hansson, G.C. (2011) The two mucus layers of colon are organized by the MUC2 mucin, whereas the outer layer is a legislator of host‐microbial interactions. Proc Natl Acad Sci USA 108(Suppl 1): 4659–4665. [DOI] [PMC free article] [PubMed] [Google Scholar]
- Kadner, R.J. , Murphy, G.P. , and Stephens, C.M. (1992) Two mechanisms for growth inhibition by elevated transport of sugar phosphates in Escherichia coli . J Gen Microbiol 138: 2007–2014. [DOI] [PubMed] [Google Scholar]
- Kwiatkowska‐Semrau, K. , Czarnecka, J. , Wojciechowski, M. , and Milewski, S. (2015) Heterogeneity of quaternary structure of glucosamine‐6‐phosphate deaminase from Giardia lamblia . Parasitol Res 114: 175–184. [DOI] [PMC free article] [PubMed] [Google Scholar]
- Macfarlane, G.T. , Cummings, J.H. , and Allison, C. (1986) Protein degradation by human intestinal bacteria. J Gen Microbiol 132: 1647–1656. [DOI] [PubMed] [Google Scholar]
- Macfarlane, G.T. , Gibson, G.R. , and Cummings, J.H. (1992) Comparison of fermentation reactions in different regions of the human colon. J Appl Bacteriol 72: 57–64. [DOI] [PubMed] [Google Scholar]
- Milewski, S. (2002) Glucosamine‐6‐phosphate synthase–the multi‐facets enzyme. Biochim Biophys Acta 1597: 173–192. [DOI] [PubMed] [Google Scholar]
- Muller, T. , Walter, B. , Wirtz, A. , and Burkovski, A. (2006) Ammonium toxicity in bacteria. Curr Microbiol 52: 400–406. [DOI] [PubMed] [Google Scholar]
- Orth, J.D. , Thiele, I. , and Palsson, B.O. (2010) What is flux balance analysis? Nat Biotechnol 28: 245–248. [DOI] [PMC free article] [PubMed] [Google Scholar]
- Ottman, N. , Davids, M. , Suarez‐Diez, M. , Boeren, S. , Schaap, P.J. , Martins Dos Santos, V.A.P. , et al (2017a) Genome‐scale model and omics analysis of metabolic capacities of Akkermansia muciniphila reveal a preferential mucin‐degrading lifestyle. Appl Environ Microbiol 83: e01014–e01017. [DOI] [PMC free article] [PubMed] [Google Scholar]
- Ottman, N. , Reunanen, J. , Meijerink, M. , Pietila, T.E. , Kainulainen, V. , Klievink, J. , et al (2017b) Pili‐like proteins of Akkermansia muciniphila modulate host immune responses and gut barrier function. PLoS ONE 12: e0173004. [DOI] [PMC free article] [PubMed] [Google Scholar]
- Ottman, N. , Geerlings, S.Y. , Aalvink, S. , de Vos, W.M. , and Belzer, C. (2017) Action and function of Akkermansia muciniphila in microbiome ecology, health and disease. Best Pract Res Clin Gastroenterol [In press] https://doi.org/10.1016/j.bpg.2017.10.001 [DOI] [PubMed] [Google Scholar]
- Ouwerkerk, J.P. , van der Ark, K.C. , Davids, M. , Claassens, N.J. , Robert Finestra, T. , de Vos, W.M. , and Belzer, C. (2016) Adaptation of Akkermansia muciniphila to the oxic‐anoxic interface of the mucus layer. Appl Environ Microbiol 82: 6983–6993. [DOI] [PMC free article] [PubMed] [Google Scholar]
- van Passel, M.W. , Kant, R. , Zoetendal, E.G. , Plugge, C.M. , Derrien, M. , Malfatti, S.A. , et al (2011) The genome of Akkermansia muciniphila, a dedicated intestinal mucin degrader, and its use in exploring intestinal metagenomes. PLoS ONE 6: e16876. [DOI] [PMC free article] [PubMed] [Google Scholar]
- Plovier, H. , Everard, A. , Druart, C. , Depommier, C. , Hul, M. , Geurts, L. , et al (2017) A purified membrane protein from Akkermansia muciniphila or the pasteurized bacterium improves metabolism in obese and diabetic mice. Nat Med 23: 107–113. [DOI] [PubMed] [Google Scholar]
- Plugge, C.M. (2005) Anoxic media design, preparation, and considerations. Methods Enzymol 397: 3–16. [DOI] [PubMed] [Google Scholar]
- Python (2017) Python Language Reference. Wilmington, DE: Python Software Foundation. [Google Scholar]
- Tanaka, T. , Takahashi, F. , Fukui, T. , Fujiwara, S. , Atomi, H. , and Imanaka, T. (2005) Characterization of a novel glucosamine‐6‐phosphate deaminase from a hyperthermophilic archaeon. J Bacteriol 187: 7038–7044. [DOI] [PMC free article] [PubMed] [Google Scholar]
- Thoden, J.B. , Wohlers, T.M. , Fridovich‐Keil, J.L. , and Holden, H.M. (2001) Human UDP‐galactose 4‐epimerase. Accommodation of UDP‐N‐acetylglucosamine within the active site. J Biol Chem 276: 15131–15136. [DOI] [PubMed] [Google Scholar]
- Thomsson, K.A. , Holmen‐Larsson, J.M. , Angstrom, J. , Johansson, M.E. , Xia, L. , and Hansson, G.C. (2012) Detailed O‐glycomics of the Muc2 mucin from colon of wild‐type, core 1‐ and core 3‐transferase‐deficient mice highlights differences compared with human MUC2. Glycobiology 22: 1128–1139. [DOI] [PMC free article] [PubMed] [Google Scholar]
- Van Herreweghen, F. , Van den Abbeele, P. , De Mulder, T. , De Weirdt, R. , Geirnaert, A. , Hernandez‐Sanabria, E. , et al (2017) In vitro colonisation of the distal colon by Akkermansia muciniphila is largely mucin and pH dependent. Benef Microbes 8: 81–96. [DOI] [PubMed] [Google Scholar]
- Vincent, F. , Davies, G.J. , and Brannigan, J.A. (2005) Structure and kinetics of a monomeric glucosamine 6‐phosphate deaminase: missing link of the NagB superfamily? J Biol Chem 280: 19649–19655. [DOI] [PubMed] [Google Scholar]
- Wu, H.C. , and Wu, T.C. (1971) Isolation and characterization of a glucosamine‐requiring mutant of Escherichia coli K‐12 defective in glucosamine‐6‐phosphate synthetase. J Bacteriol 105: 455–466. [DOI] [PMC free article] [PubMed] [Google Scholar]
Associated Data
This section collects any data citations, data availability statements, or supplementary materials included in this article.
Supplementary Materials
Fig. S1. Growth of A. muciniphila on CP medium supplemented with 25 mM of each glucose and GlcNAc.
Fig. S2. SDS‐PAGE gel of overexpressed protein purification using a Ni‐column.
Fig. S3. Growth of A. muciniphila on CP medium supplemented with 25 mM GlcNAc, 6 g/l Thr and 0 mM or 50 mM NH4Cl.
Table S1. Composition of tested media.
Table S2. Determination of protein concentrations by BCA assay used for enzyme assays.
Table S3. Overview of substrates used in enzyme assay.
Table S4. BlastP of Escherichia coli K12 NagB (NP_415204.1) against Akkermansia (taxid:239934).
Table S5. BlastP of A muciniphila NagB (CDB55261.1) against all sequence except Akkermansia (taxid:239934).
Table S6. BlastP of Escherichia coli K12 GlmS (NP_418185.1) against Akkermansia (taxid:239934).
Table S7. BlastP of Verrucromicrobium spinosum GlmS (WP_009962724.1) against Akkermansia muciniphila.
Table S8. Control reactions for enzyme assay of A. muciniphila NagB.
Data Availability Statement
The genome‐scale metabolic model of Akkermansia muciniphila AkkMuc_588_v2 is available as supplementary material together with a list of the changes respect to the previous version. Supplementary file contains the AkkMuc_588_v2 model in SBML level 2 and in table (xls) format. The file also contains documentation indicating the changes respect to the previous version. Finally, to ease model reutilization, we have included a Python script to perform growth simulations on different media. The script requires the COBRApy library (and has been tested with version 0.4.1) (Ebrahim et al., 2013) and an LP solver such as Gurobi (Gurobi, 2016). This model was deposited in BioModels (Chelliah et al., 2015) and assigned the identifier MODEL1710040000.